| Param | Original file | Final file |
|---|---|---|
| Filename | modeM0/AS1A14_099T01_9000006536_55434cztM0_level2.fits | modeM0/AS1A14_099T01_9000006536_55434cztM0_level2_quad_clean.evt |
| Size (bytes) | 517,394,880 | 84,309,120 |
| Size | 493.4 MB | 80.4 MB |
| Events in quadrant A | 3,313,729 | 561,585 |
| Events in quadrant B | 3,275,752 | 606,468 |
| Events in quadrant C | 3,278,125 | 528,005 |
| Events in quadrant D | 8,756,319 | 382,959 |
| Mode M9 | |||
|---|---|---|---|
| Quadrant | BADHDUFLAG | Total packets | Discarded packets |
| A | 0 | 8 | 0 |
| B | 0 | 8 | 0 |
| C | 0 | 8 | 0 |
| D | 0 | 8 | 0 |
| Mode SS | |||
|---|---|---|---|
| Quadrant | BADHDUFLAG | Total packets | Discarded packets |
| A | 0 | 138 | 0 |
| B | 0 | 138 | 0 |
| C | 0 | 138 | 0 |
| D | 0 | 138 | 0 |
| Mode M0 | |||
|---|---|---|---|
| Quadrant | BADHDUFLAG | Total packets | Discarded packets |
| A | 0 | 15009 | 2 |
| B | 0 | 14818 | 2 |
| C | 0 | 15039 | 2 |
| D | 0 | 30723 | 2 |
| Quadrant | Total seconds | Saturated seconds | Saturation percentage |
|---|---|---|---|
| A | 6793 | 112 | 1.648756% |
| B | 6794 | 54 | 0.794819% |
| C | 6794 | 88 | 1.295261% |
| D | 6794 | 1932 | 28.436856% |
Noise dominated data is calculated using 1-second bins in cleaned event files. If a bin has >2000 counts, and if more than 50% of those come from <1% of pixels, then it is considered to be noise-dominated and hence unusable.
| Quadrant | # 1 sec bins | Bins with >0 counts | Bins with >2000 counts | High rate bins dominated by noise | Noise dominated (total time) | Noise dominated (detector-on time) | Marked lightcurve |
|---|---|---|---|---|---|---|---|
| A | 7876 | 7068 | 53 | 53 | 0.67% | 0.75% | 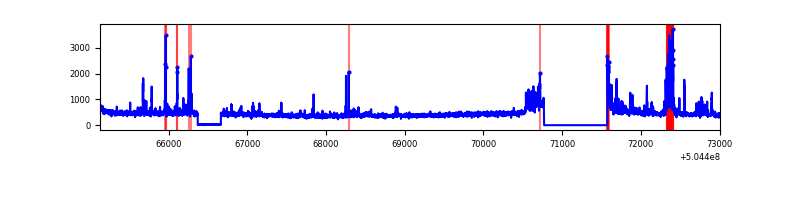 |
| B | 7877 | 7069 | 10 | 10 | 0.13% | 0.14% | 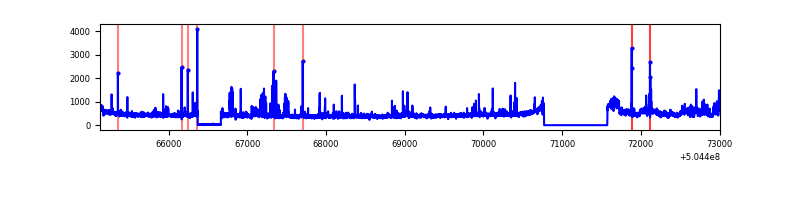 |
| C | 7877 | 7069 | 58 | 58 | 0.74% | 0.82% | 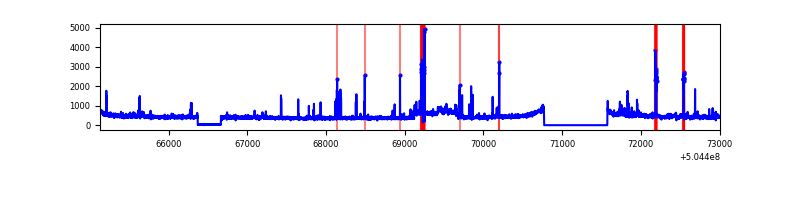 |
| D | 7877 | 7045 | 1713 | 1713 | 21.75% | 24.32% | 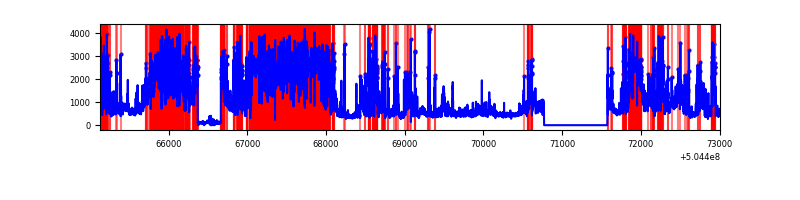 |
Top three noisy pixels from each quadrant. If the there are fewer than three noisy pixels in the level2.evt file, extra rows are filled as -1
| Pixel properties | Quadrant properties | ||||||
|---|---|---|---|---|---|---|---|
| Quadrant | DetID | PixID | Counts | Sigma | Mean | Median | Sigma |
| A | 3 | 78 | 438976 | 2479.11 | 712 | 694 | 176.8 |
| A | 4 | 159 | 45550 | 253.72 | 712 | 694 | 176.8 |
| A | 4 | 3 | 31743 | 175.63 | 712 | 694 | 176.8 |
| B | 5 | 185 | 181463 | 1208.43 | 706 | 679 | 149.6 |
| B | 9 | 254 | 93571 | 620.92 | 706 | 679 | 149.6 |
| B | 10 | 247 | 61288 | 405.13 | 706 | 679 | 149.6 |
| C | 15 | 1 | 372104 | 1933.22 | 701 | 692 | 192.1 |
| C | 15 | 147 | 43379 | 222.19 | 701 | 692 | 192.1 |
| C | 12 | 252 | 27357 | 138.79 | 701 | 692 | 192.1 |
| D | 11 | 129 | 5703461 | 32894.89 | 609 | 582 | 173.4 |
| D | 10 | 181 | 157616 | 905.79 | 609 | 582 | 173.4 |
| D | 3 | 12 | 151404 | 869.96 | 609 | 582 | 173.4 |
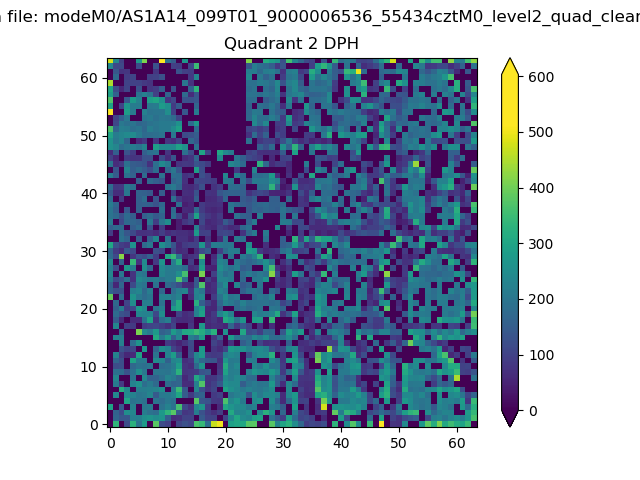
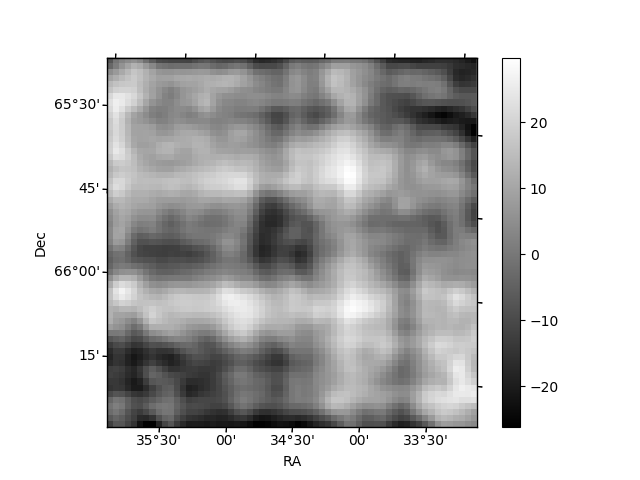
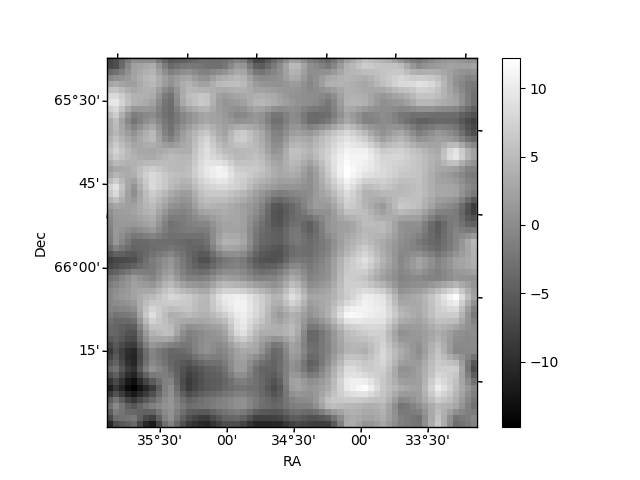
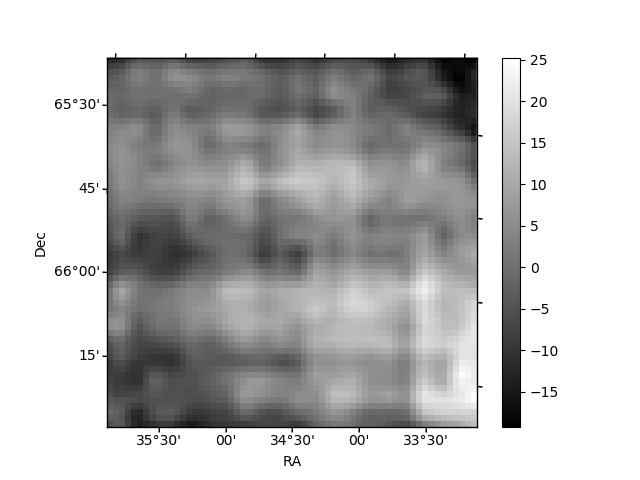
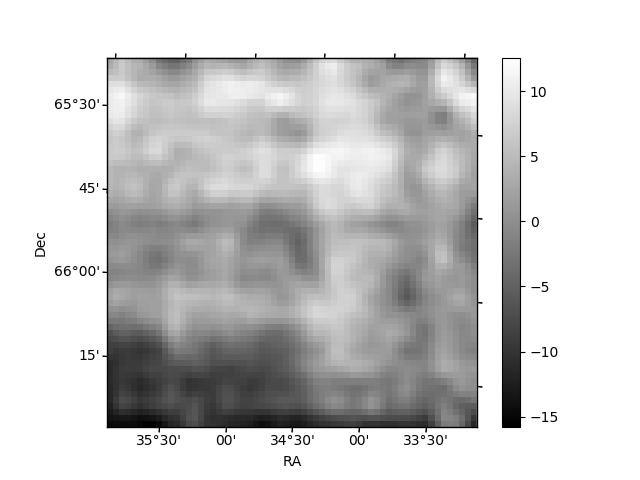
Histogram calculated using DETX and DETY for each event in the final _common_clean file
| Quadrant A | 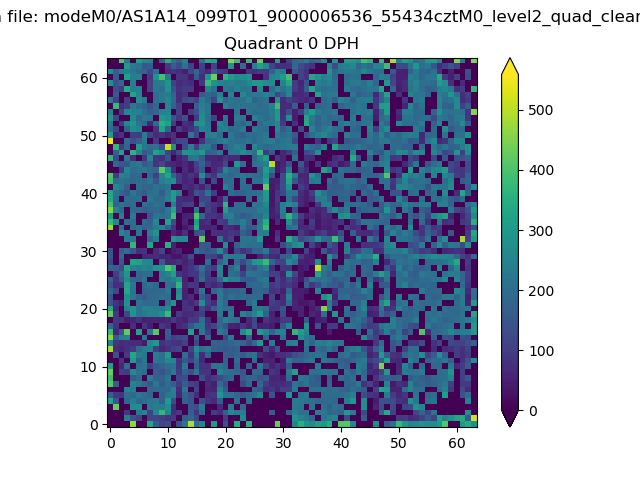 |
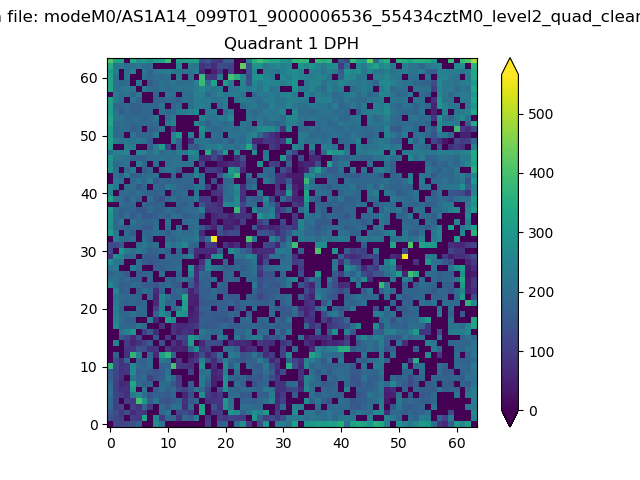 |
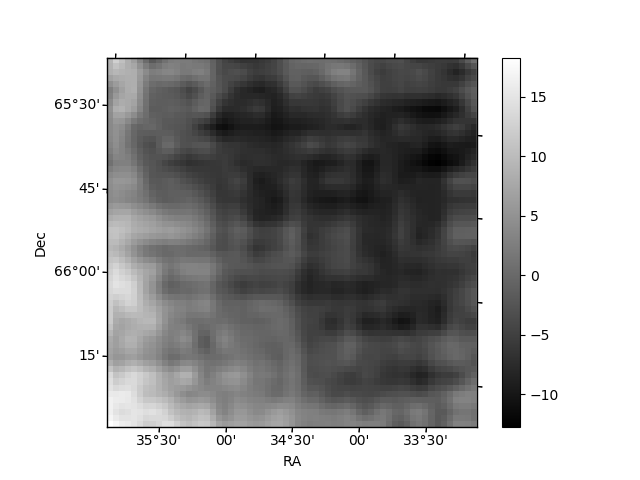
Quadrant B |
|---|---|---|---|
| Quadrant D | 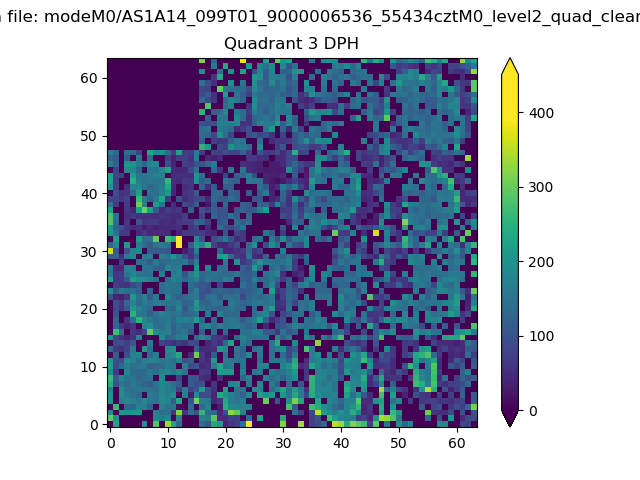 |
 |
Quadrant C |
| Plot type | Count rate plots | Images |
|---|---|---|
| Comparison with Poisson distribution Blue bars denote a histogram of data divided into 1 sec bins. Red curve is a Poisson curve with rate = median count rate of data. |
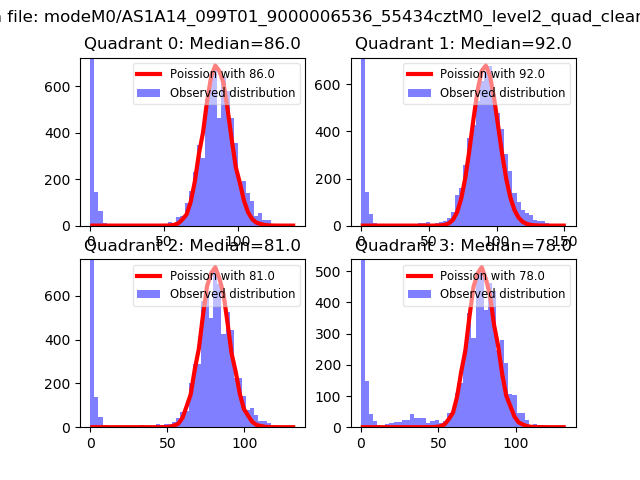 |
 |
| Quadrant-wise count rates Data is divided into 100 sec bins |
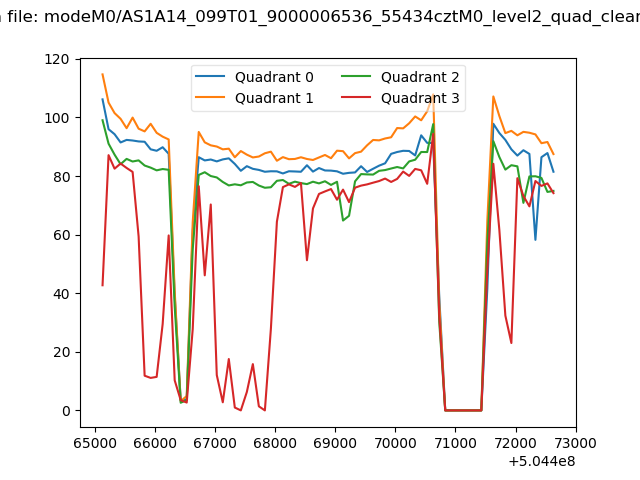 |
|
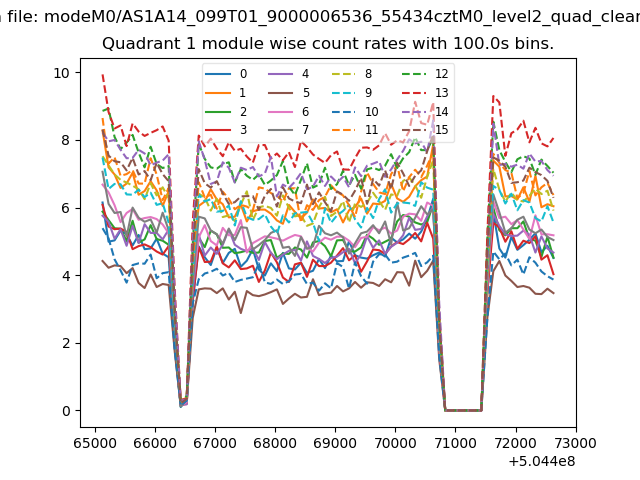
| Module-wise count rates for Quadrant A Data is divided into 100 sec bins |
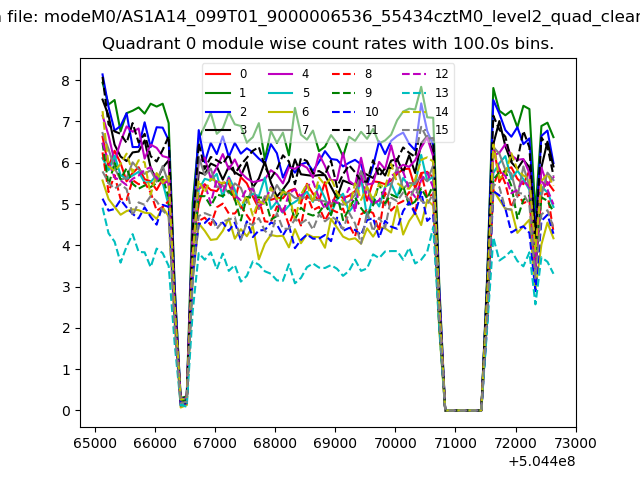 |
 |
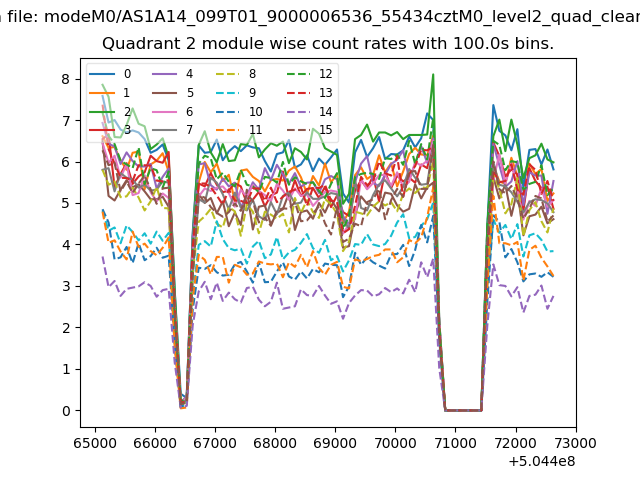
| Module-wise count rates for Quadrant B Data is divided into 100 sec bins |
 |
 |
| Module-wise count rates for Quadrant C Data is divided into 100 sec bins |
 |
 |
| Module-wise count rates for Quadrant D Data is divided into 100 sec bins |
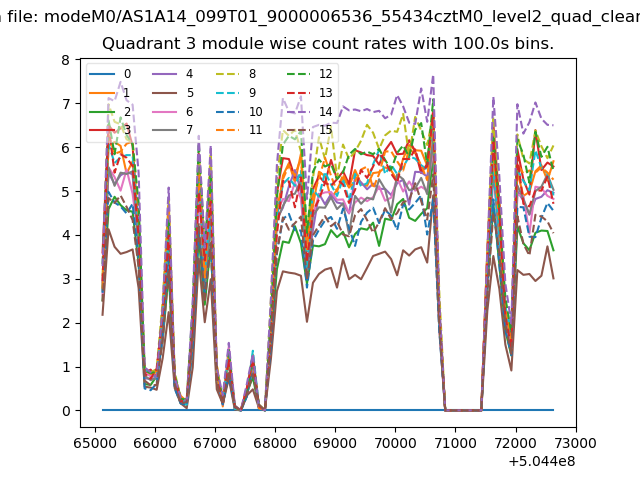 |
 |
| Parameter | Plot |
|---|---|
| CZT HV Monitor | 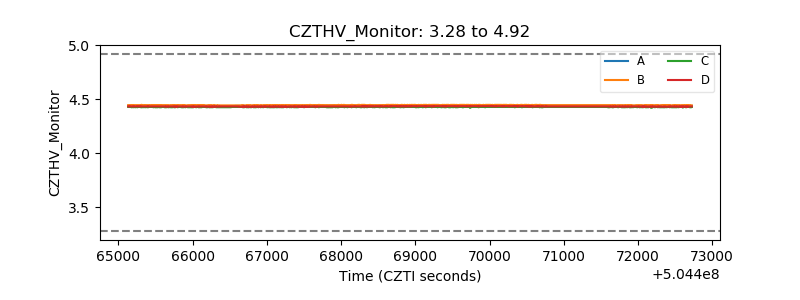 |
| D_VDD | 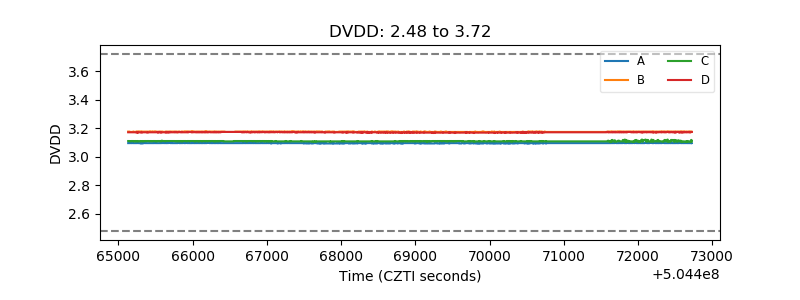 |
| Temperature 1 | 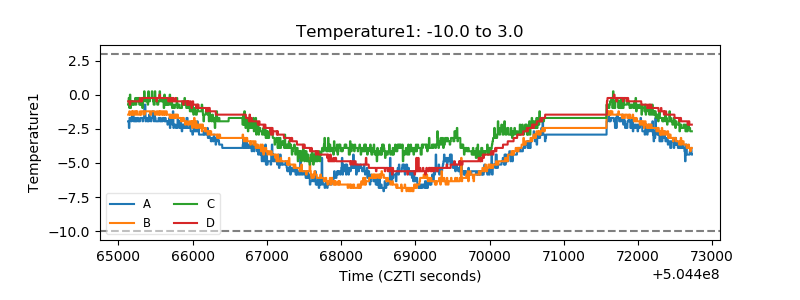 |
| Veto HV Monitor | 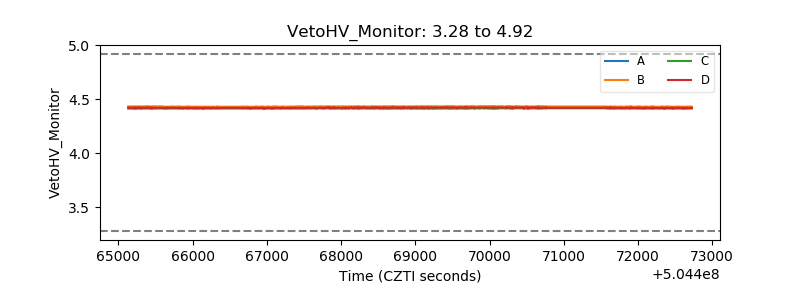 |
| Veto LLD | 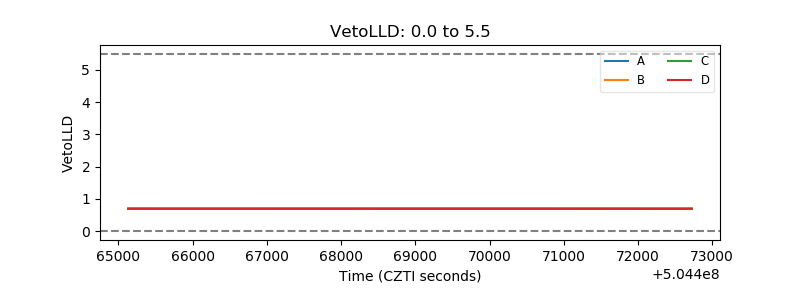 |
| Alpha Counter | 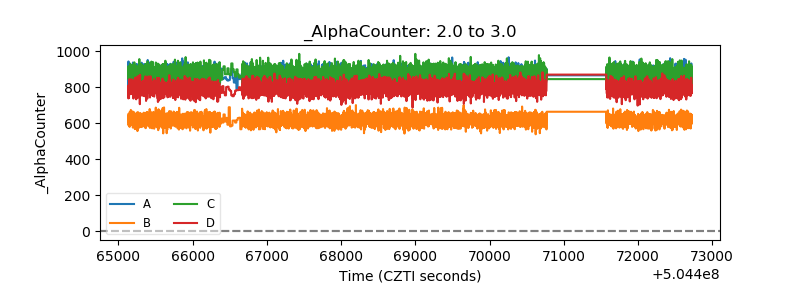 |
| _CPM_Rate | 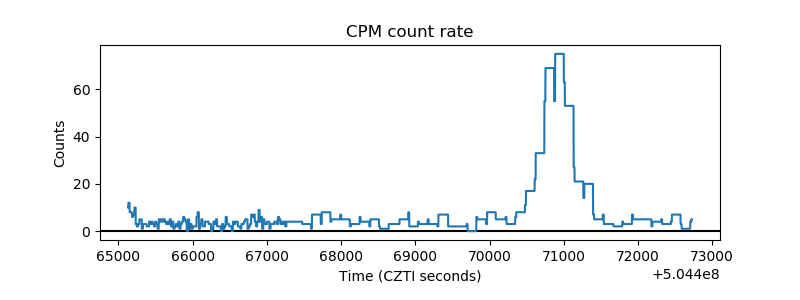 |
| CZT Counter | 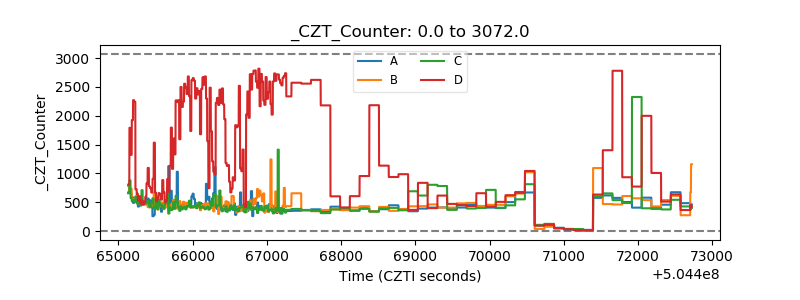 |
| +2.5 Volts monitor | 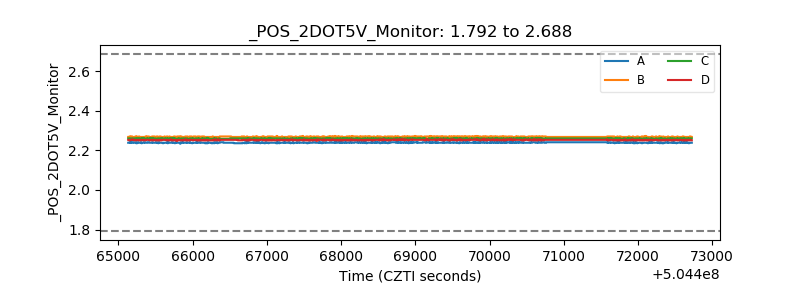 |
| +5 Volts monitor | 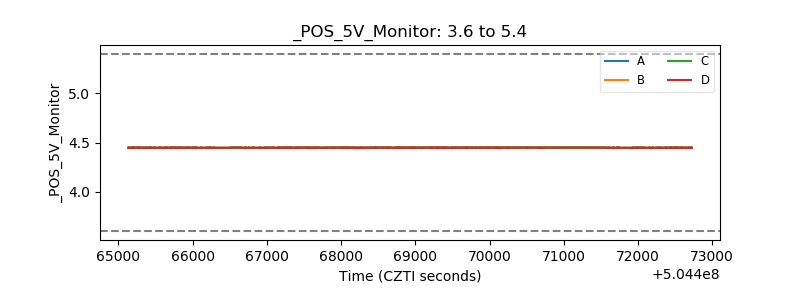 |
| _ROLL_ROT | 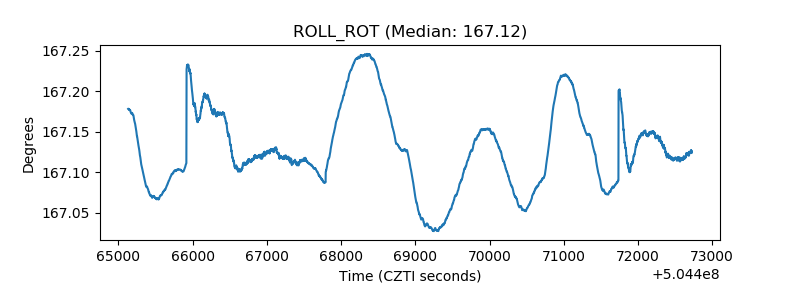 |
| _Roll_DEC | 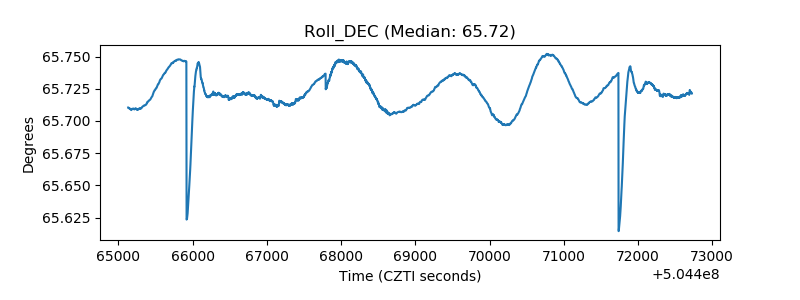 |
| _Roll_RA | 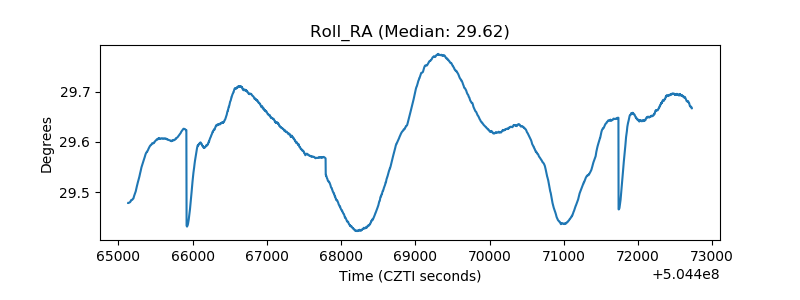 |
| Veto Counter | 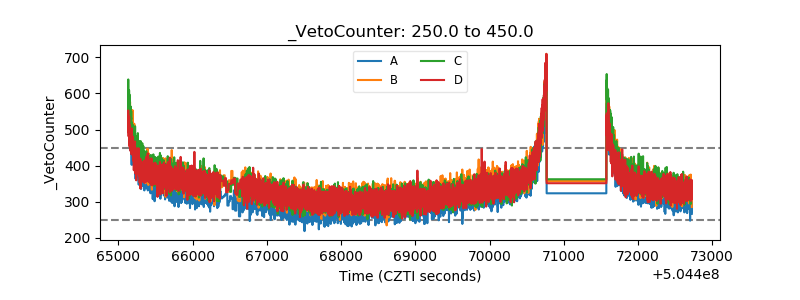 |