| Param | Original file | Final file |
|---|---|---|
| Filename | modeM0/AS1A14_099T01_9000006536_55436cztM0_level2.fits | modeM0/AS1A14_099T01_9000006536_55436cztM0_level2_quad_clean.evt |
| Size (bytes) | 506,312,640 | 111,919,680 |
| Size | 482.9 MB | 106.7 MB |
| Events in quadrant A | 4,885,816 | 703,333 |
| Events in quadrant B | 3,992,682 | 782,591 |
| Events in quadrant C | 3,782,220 | 703,395 |
| Events in quadrant D | 5,467,068 | 649,837 |
| Mode SS | |||
|---|---|---|---|
| Quadrant | BADHDUFLAG | Total packets | Discarded packets |
| A | 0 | 158 | 0 |
| B | 0 | 158 | 0 |
| C | 0 | 158 | 0 |
| D | 0 | 158 | 0 |
| Mode M0 | |||
|---|---|---|---|
| Quadrant | BADHDUFLAG | Total packets | Discarded packets |
| A | 0 | 20702 | 1 |
| B | 0 | 17677 | 10 |
| C | 0 | 17194 | 1 |
| D | 0 | 22096 | 1 |
| Quadrant | Total seconds | Saturated seconds | Saturation percentage |
|---|---|---|---|
| A | 7903 | 526 | 6.655700% |
| B | 7900 | 146 | 1.848101% |
| C | 7904 | 53 | 0.670547% |
| D | 7904 | 307 | 3.884109% |
Noise dominated data is calculated using 1-second bins in cleaned event files. If a bin has >2000 counts, and if more than 50% of those come from <1% of pixels, then it is considered to be noise-dominated and hence unusable.
| Quadrant | # 1 sec bins | Bins with >0 counts | Bins with >2000 counts | High rate bins dominated by noise | Noise dominated (total time) | Noise dominated (detector-on time) | Marked lightcurve |
|---|---|---|---|---|---|---|---|
| A | 7903 | 7903 | 317 | 317 | 4.01% | 4.01% | 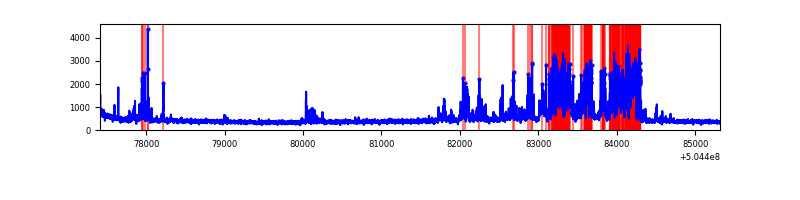 |
| B | 7903 | 7901 | 78 | 78 | 0.99% | 0.99% | 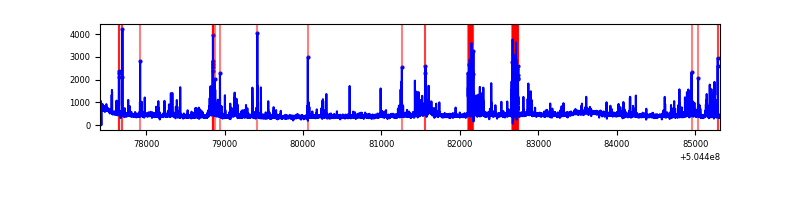 |
| C | 7904 | 7904 | 36 | 36 | 0.46% | 0.46% | 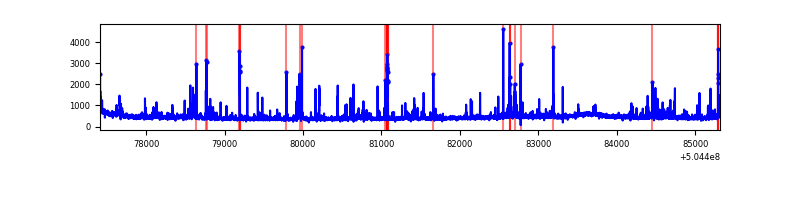 |
| D | 7904 | 7904 | 263 | 263 | 3.33% | 3.33% | 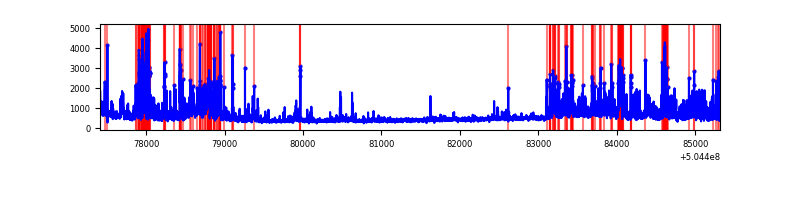 |
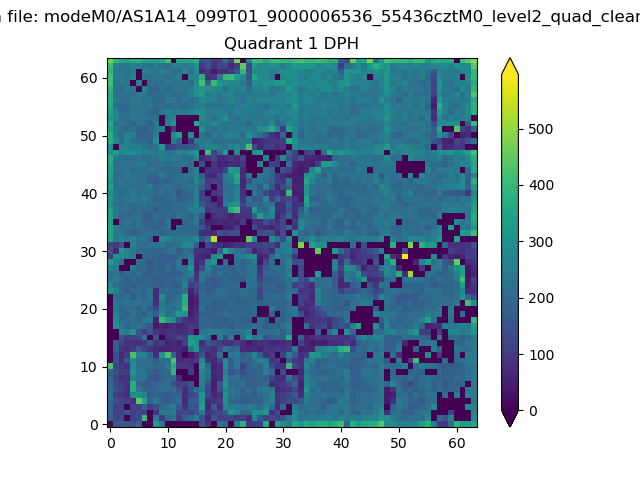
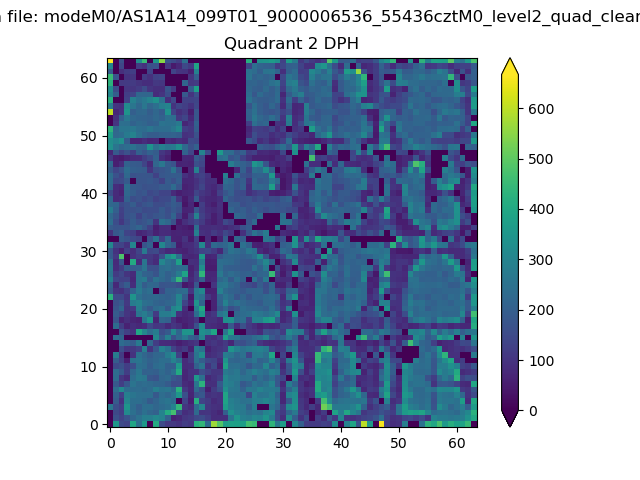
Top three noisy pixels from each quadrant. If the there are fewer than three noisy pixels in the level2.evt file, extra rows are filled as -1
| Pixel properties | Quadrant properties | ||||||
|---|---|---|---|---|---|---|---|
| Quadrant | DetID | PixID | Counts | Sigma | Mean | Median | Sigma |
| A | 4 | 159 | 1444696 | 7109.36 | 810 | 788 | 203.1 |
| A | 3 | 78 | 192287 | 942.88 | 810 | 788 | 203.1 |
| A | 4 | 3 | 30834 | 147.94 | 810 | 788 | 203.1 |
| B | 0 | 171 | 161445 | 939.55 | 812 | 782 | 171.0 |
| B | 10 | 247 | 145073 | 843.8 | 812 | 782 | 171.0 |
| B | 12 | 32 | 125399 | 728.75 | 812 | 782 | 171.0 |
| C | 14 | 254 | 205790 | 919.28 | 813 | 805 | 223.0 |
| C | 13 | 3 | 144502 | 644.43 | 813 | 805 | 223.0 |
| C | 9 | 38 | 79539 | 353.09 | 813 | 805 | 223.0 |
| D | 11 | 129 | 1226336 | 5450.14 | 797 | 761 | 224.9 |
| D | 3 | 12 | 360366 | 1599.17 | 797 | 761 | 224.9 |
| D | 8 | 48 | 302235 | 1340.66 | 797 | 761 | 224.9 |
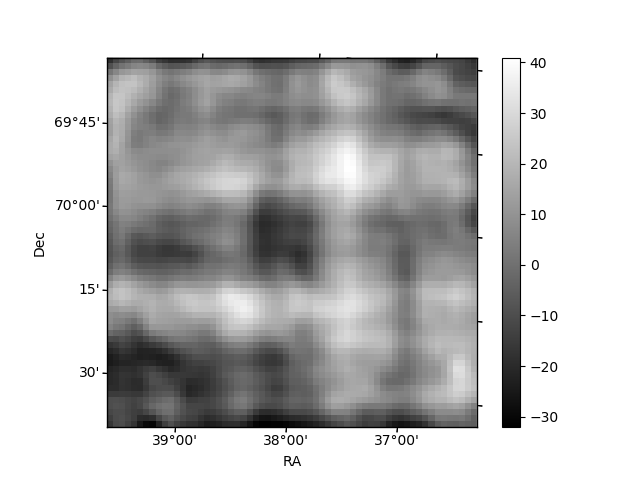
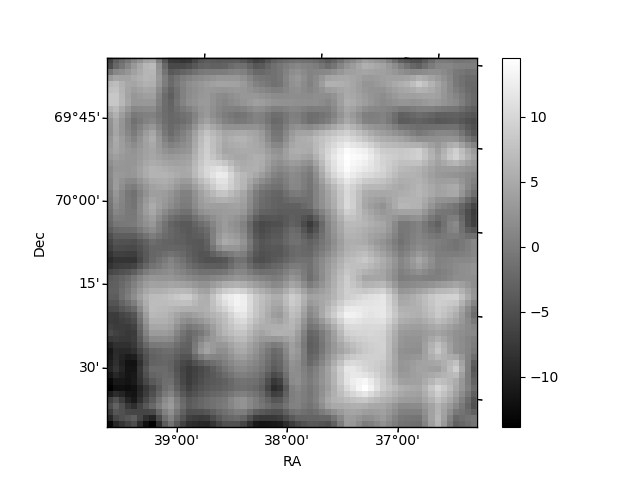
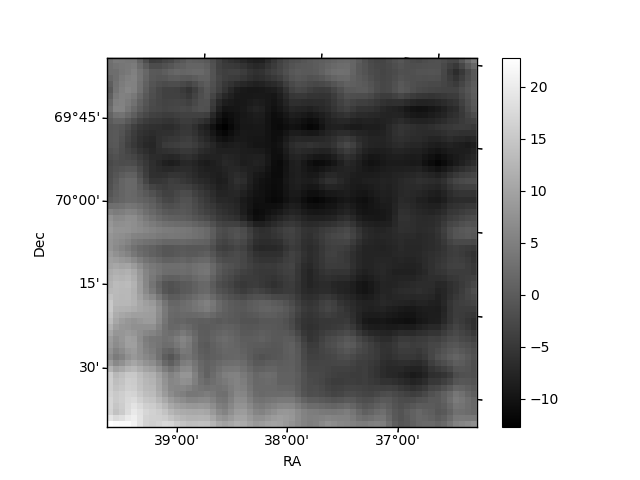
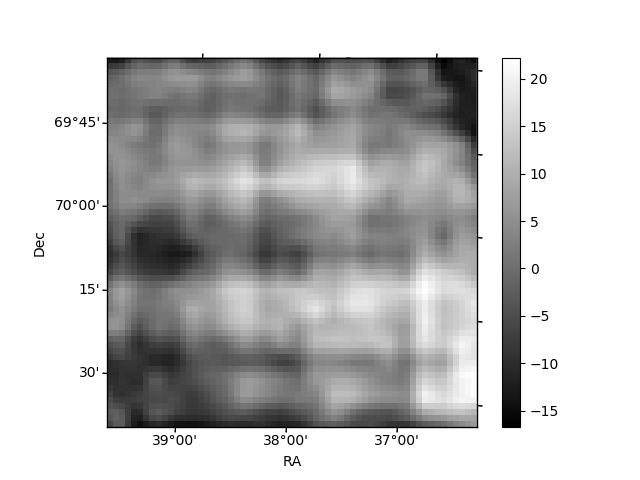
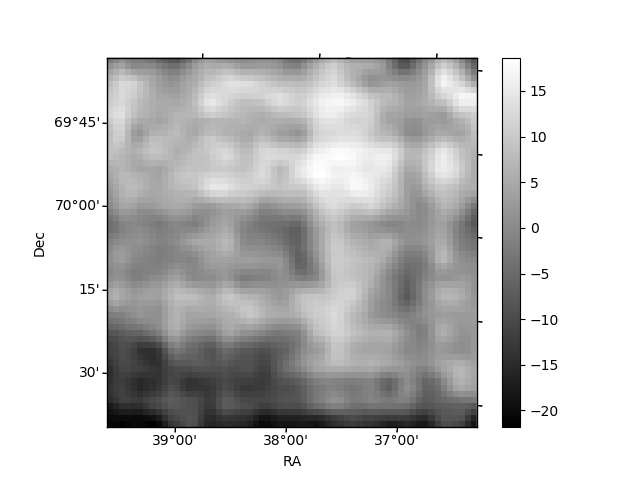
Histogram calculated using DETX and DETY for each event in the final _common_clean file
| Quadrant A | 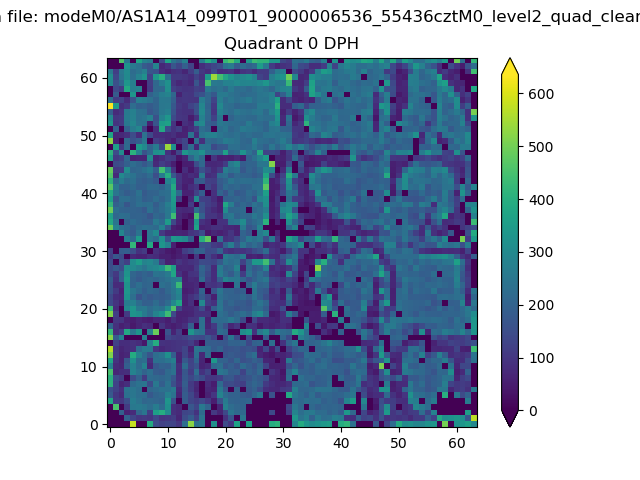 |
 |
Quadrant B |
|---|---|---|---|
| Quadrant D | 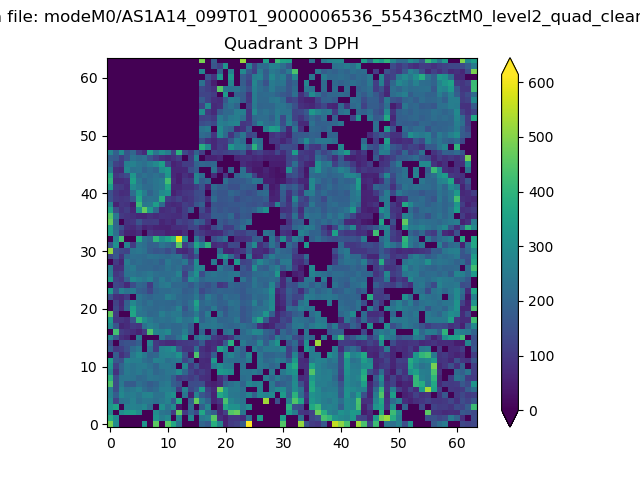 |
 |
Quadrant C |
| Plot type | Count rate plots | Images |
|---|---|---|
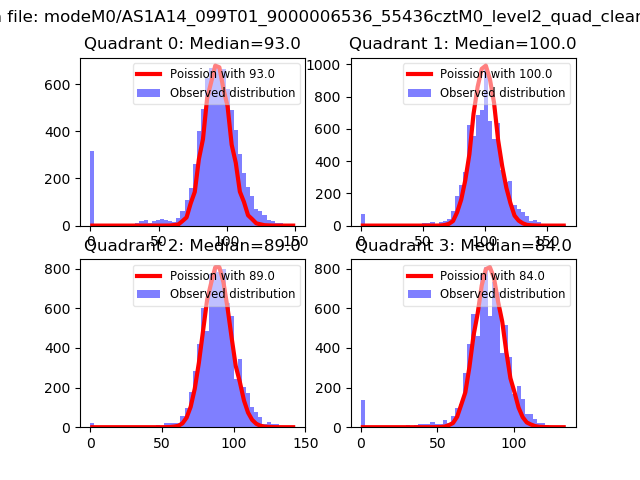
| Comparison with Poisson distribution Blue bars denote a histogram of data divided into 1 sec bins. Red curve is a Poisson curve with rate = median count rate of data. |
 |
 |
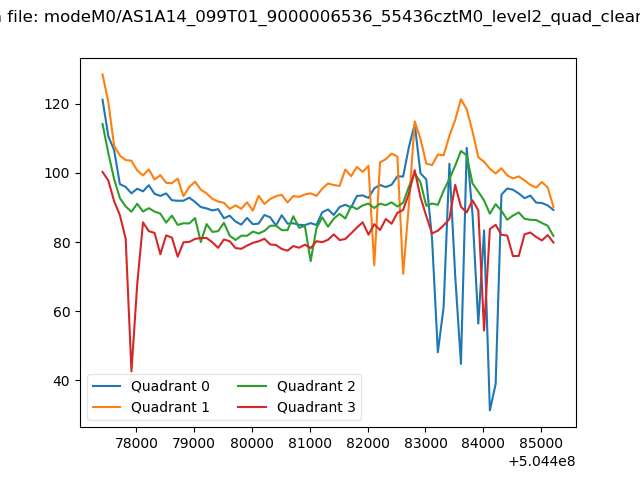
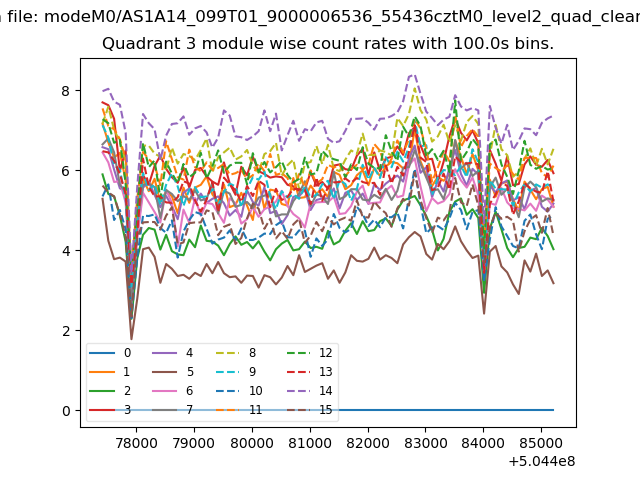
| Quadrant-wise count rates Data is divided into 100 sec bins |
 |
|
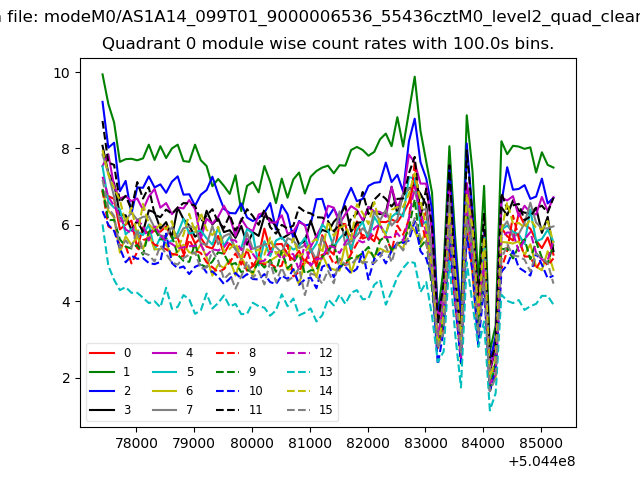
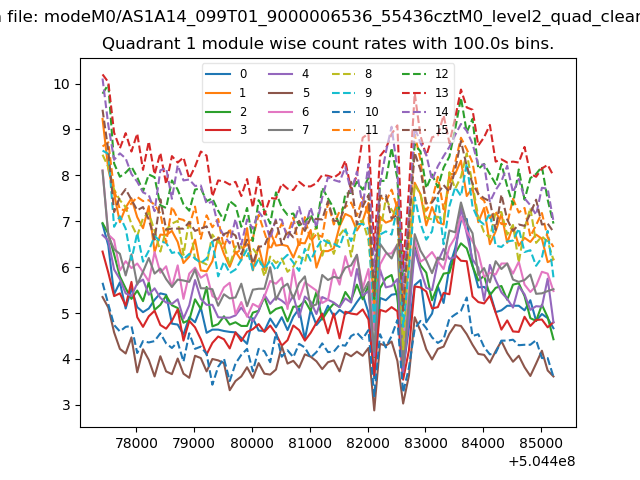
| Module-wise count rates for Quadrant A Data is divided into 100 sec bins |
 |
 |
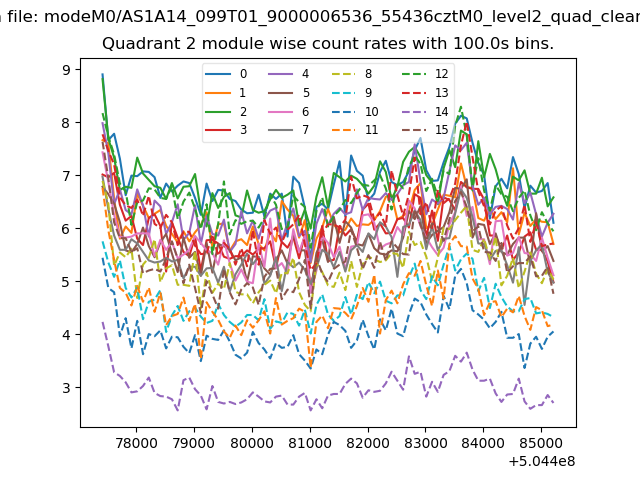
| Module-wise count rates for Quadrant B Data is divided into 100 sec bins |
 |
 |
| Module-wise count rates for Quadrant C Data is divided into 100 sec bins |
 |
 |
| Module-wise count rates for Quadrant D Data is divided into 100 sec bins |
 |
 |
| Parameter | Plot |
|---|---|
| CZT HV Monitor | 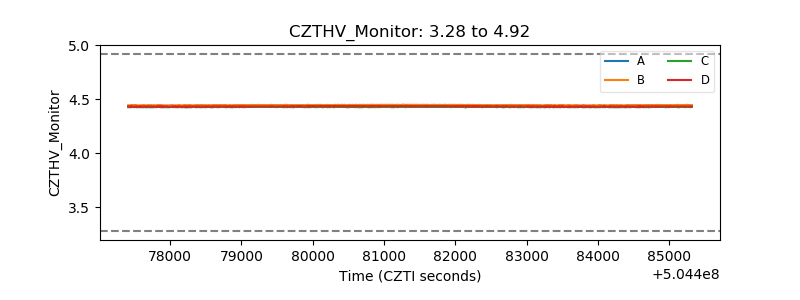 |
| D_VDD | 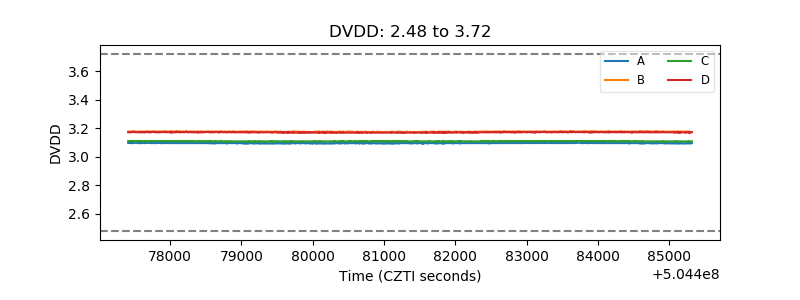 |
| Temperature 1 | 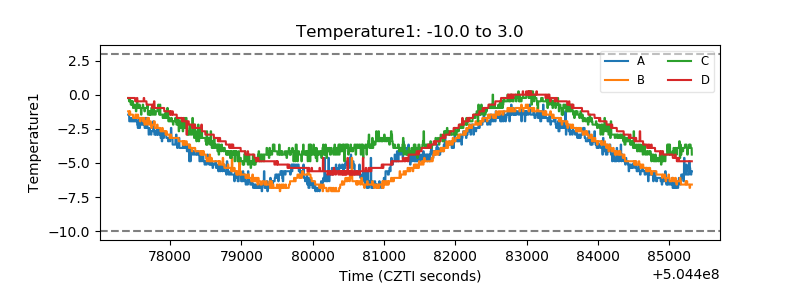 |
| Veto HV Monitor | 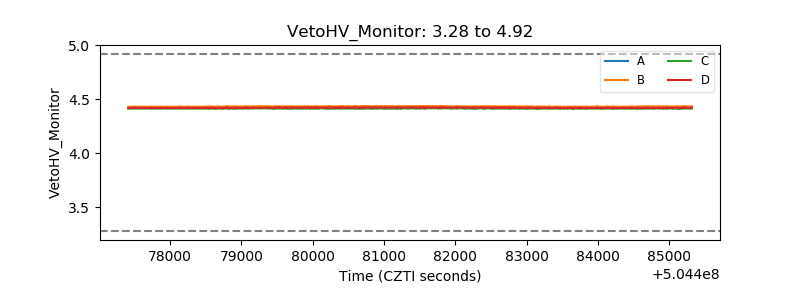 |
| Veto LLD | 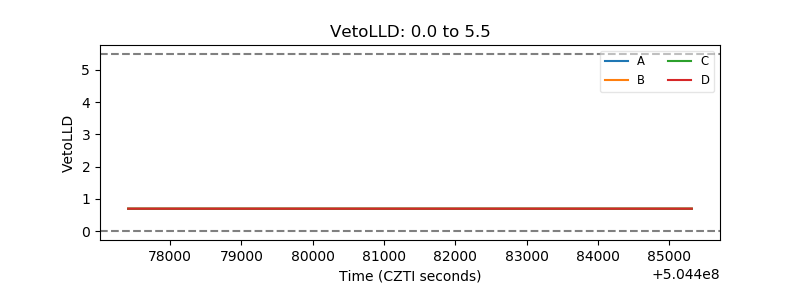 |
| Alpha Counter | 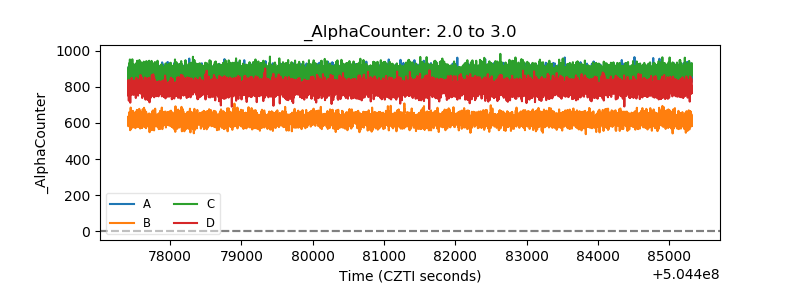 |
| _CPM_Rate | 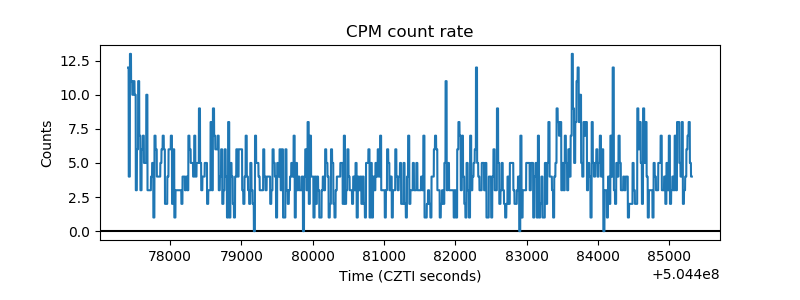 |
| CZT Counter | 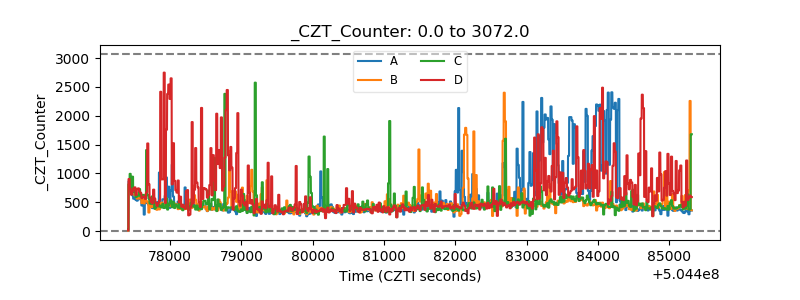 |
| +2.5 Volts monitor | 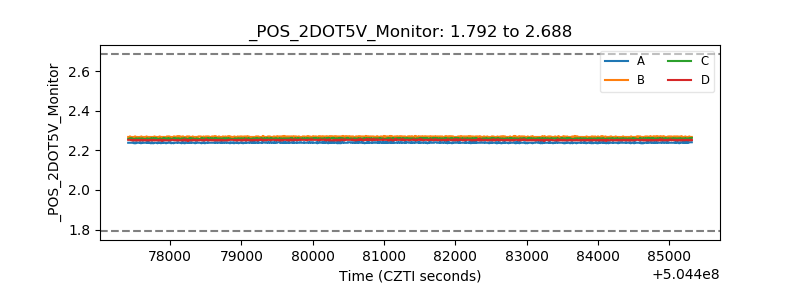 |
| +5 Volts monitor |  |
| _ROLL_ROT | 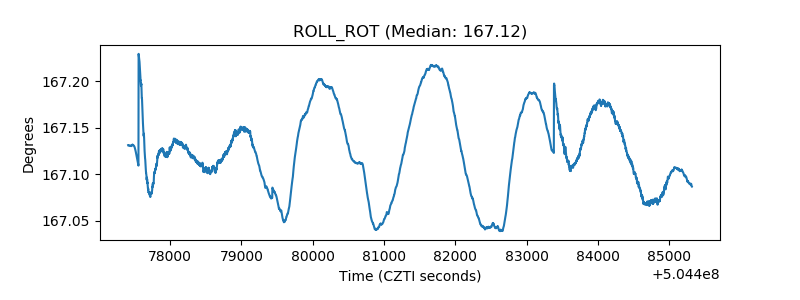 |
| _Roll_DEC | 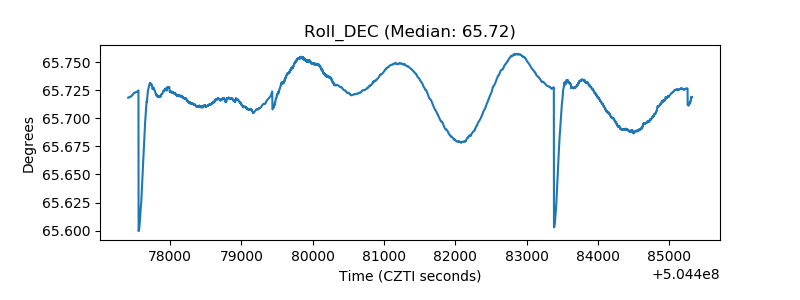 |
| _Roll_RA | 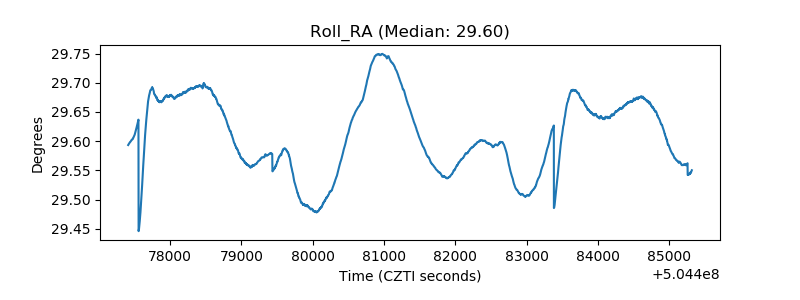 |
| Veto Counter | 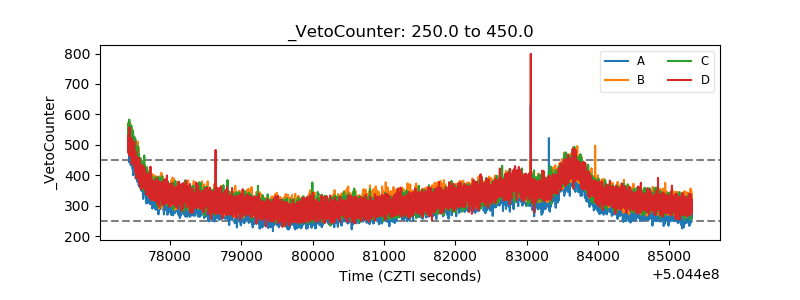 |