| Param | Original file | Final file |
|---|---|---|
| Filename | modeM0/AS1A14_099T01_9000006536_55437cztM0_level2.fits | modeM0/AS1A14_099T01_9000006536_55437cztM0_level2_quad_clean.evt |
| Size (bytes) | 496,252,800 | 102,214,080 |
| Size | 473.3 MB | 97.5 MB |
| Events in quadrant A | 4,263,056 | 660,798 |
| Events in quadrant B | 3,674,366 | 698,331 |
| Events in quadrant C | 3,564,345 | 632,260 |
| Events in quadrant D | 6,253,755 | 553,686 |
| Mode SS | |||
|---|---|---|---|
| Quadrant | BADHDUFLAG | Total packets | Discarded packets |
| A | 0 | 158 | 0 |
| B | 0 | 158 | 0 |
| C | 0 | 158 | 0 |
| D | 0 | 158 | 0 |
| Mode M0 | |||
|---|---|---|---|
| Quadrant | BADHDUFLAG | Total packets | Discarded packets |
| A | 0 | 18692 | 0 |
| B | 0 | 16761 | 0 |
| C | 0 | 16498 | 0 |
| D | 0 | 24175 | 0 |
| Quadrant | Total seconds | Saturated seconds | Saturation percentage |
|---|---|---|---|
| A | 7903 | 262 | 3.315197% |
| B | 7904 | 33 | 0.417510% |
| C | 7904 | 21 | 0.265688% |
| D | 7904 | 387 | 4.896255% |
Noise dominated data is calculated using 1-second bins in cleaned event files. If a bin has >2000 counts, and if more than 50% of those come from <1% of pixels, then it is considered to be noise-dominated and hence unusable.
| Quadrant | # 1 sec bins | Bins with >0 counts | Bins with >2000 counts | High rate bins dominated by noise | Noise dominated (total time) | Noise dominated (detector-on time) | Marked lightcurve |
|---|---|---|---|---|---|---|---|
| A | 8178 | 8178 | 197 | 197 | 2.41% | 2.41% | 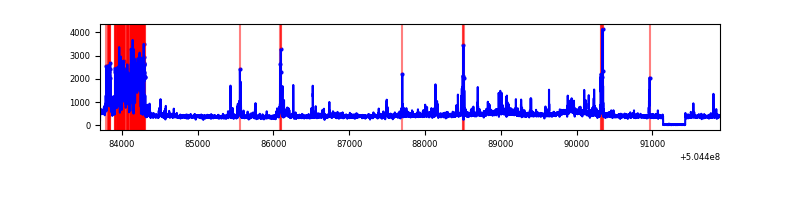 |
| B | 8179 | 8179 | 18 | 18 | 0.22% | 0.22% | 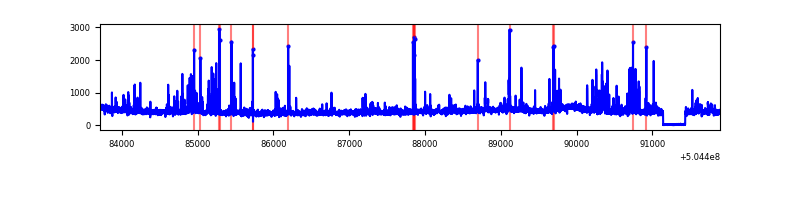 |
| C | 8179 | 8179 | 12 | 12 | 0.15% | 0.15% | 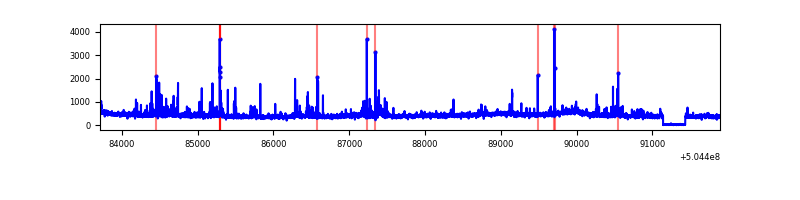 |
| D | 8179 | 8179 | 308 | 308 | 3.77% | 3.77% | 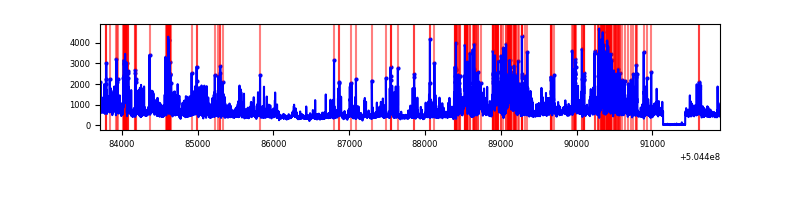 |
Top three noisy pixels from each quadrant. If the there are fewer than three noisy pixels in the level2.evt file, extra rows are filled as -1
| Pixel properties | Quadrant properties | ||||||
|---|---|---|---|---|---|---|---|
| Quadrant | DetID | PixID | Counts | Sigma | Mean | Median | Sigma |
| A | 4 | 159 | 932484 | 4576.22 | 810 | 787 | 203.6 |
| A | 0 | 8 | 77954 | 379.02 | 810 | 787 | 203.6 |
| A | 4 | 3 | 33292 | 159.65 | 810 | 787 | 203.6 |
| B | 7 | 252 | 145441 | 844.03 | 812 | 783 | 171.4 |
| B | 10 | 247 | 114369 | 662.74 | 812 | 783 | 171.4 |
| B | 0 | 171 | 50547 | 290.36 | 812 | 783 | 171.4 |
| C | 14 | 254 | 118585 | 528.36 | 808 | 800 | 222.9 |
| C | 13 | 3 | 100939 | 449.21 | 808 | 800 | 222.9 |
| C | 9 | 38 | 82306 | 365.62 | 808 | 800 | 222.9 |
| D | 11 | 129 | 1888142 | 8514.02 | 783 | 747 | 221.7 |
| D | 8 | 48 | 410964 | 1850.49 | 783 | 747 | 221.7 |
| D | 14 | 50 | 195664 | 879.27 | 783 | 747 | 221.7 |
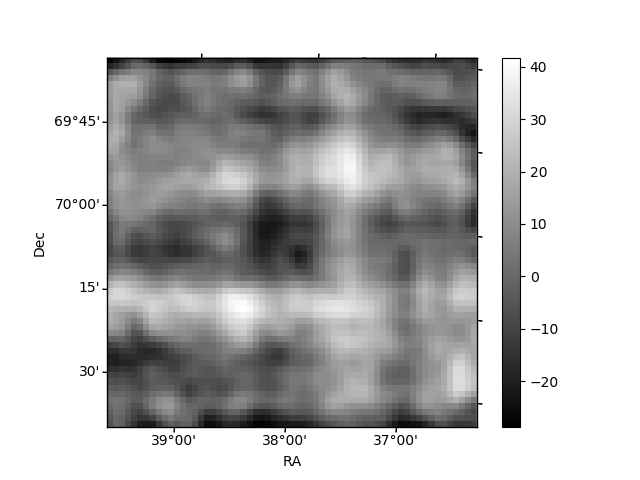
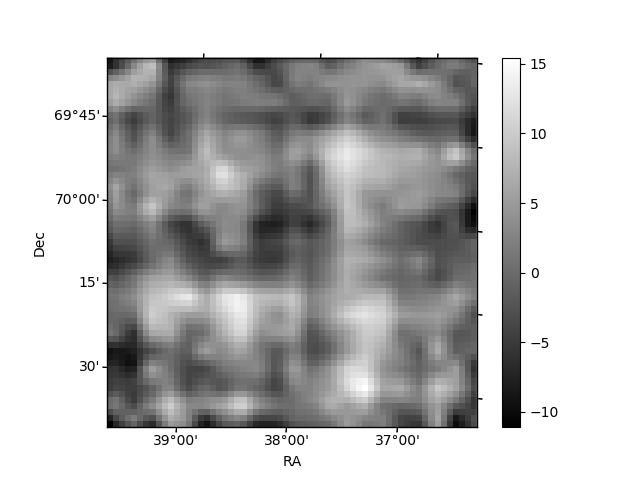
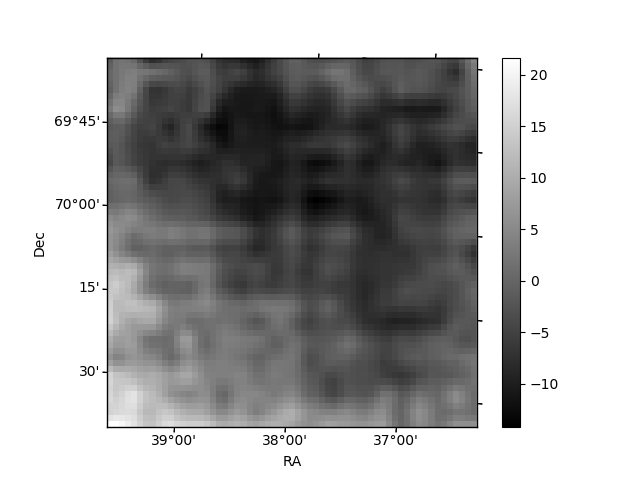
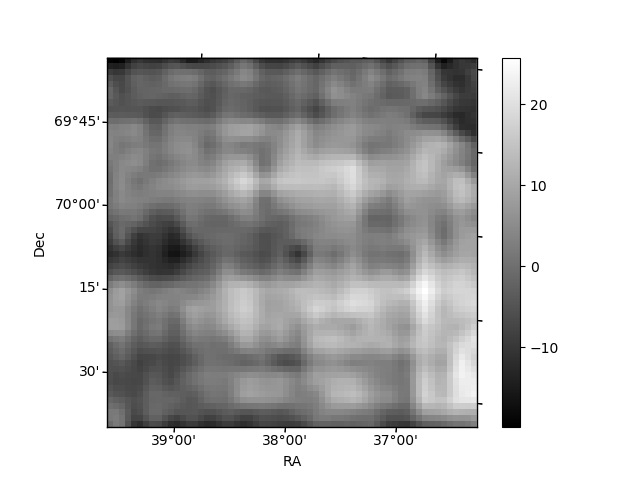
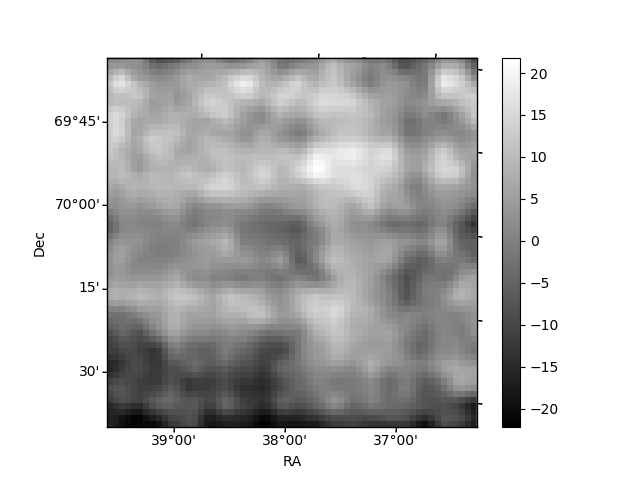
Histogram calculated using DETX and DETY for each event in the final _common_clean file
| Quadrant A | 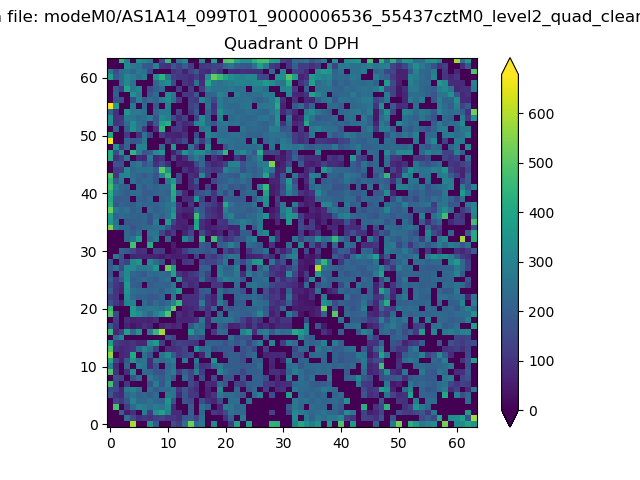 |
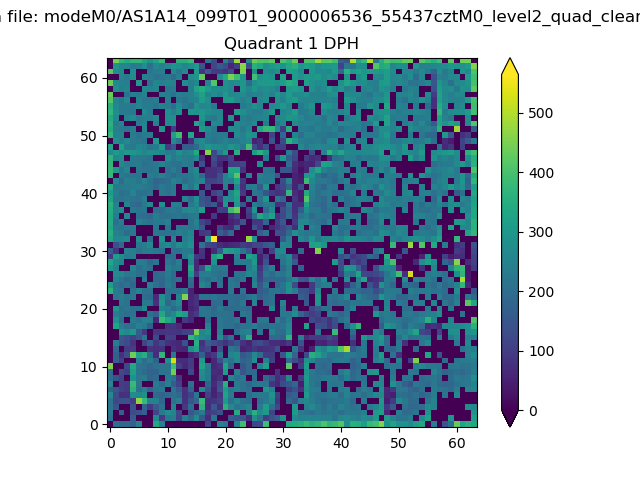 |
Quadrant B |
|---|---|---|---|
| Quadrant D | 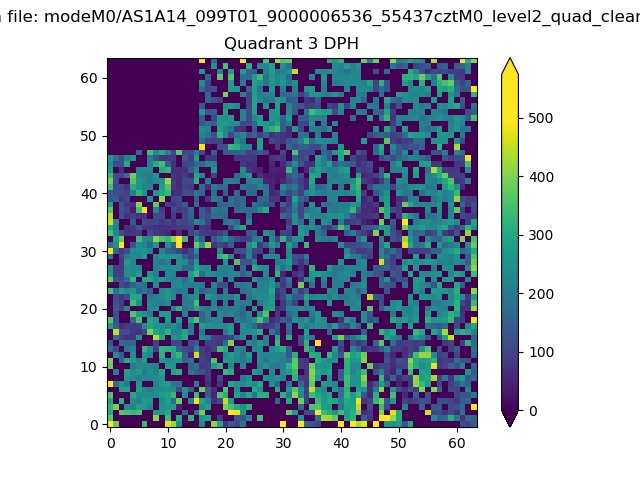 |
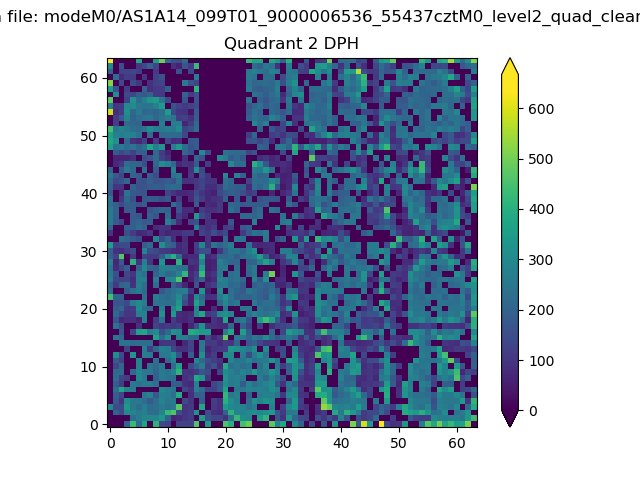 |
Quadrant C |
| Plot type | Count rate plots | Images |
|---|---|---|
| Comparison with Poisson distribution Blue bars denote a histogram of data divided into 1 sec bins. Red curve is a Poisson curve with rate = median count rate of data. |
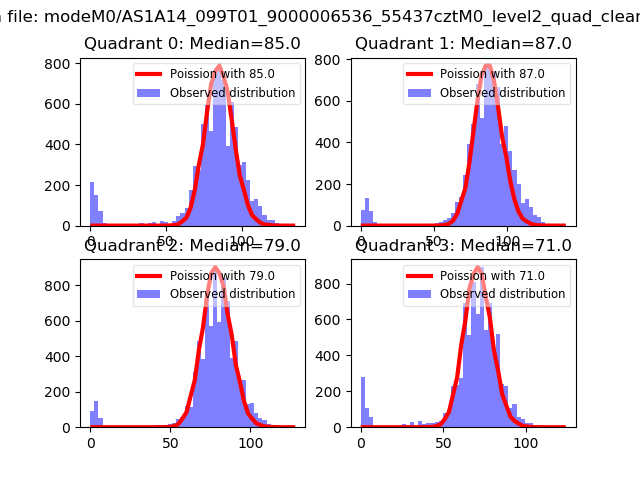 |
 |
| Quadrant-wise count rates Data is divided into 100 sec bins |
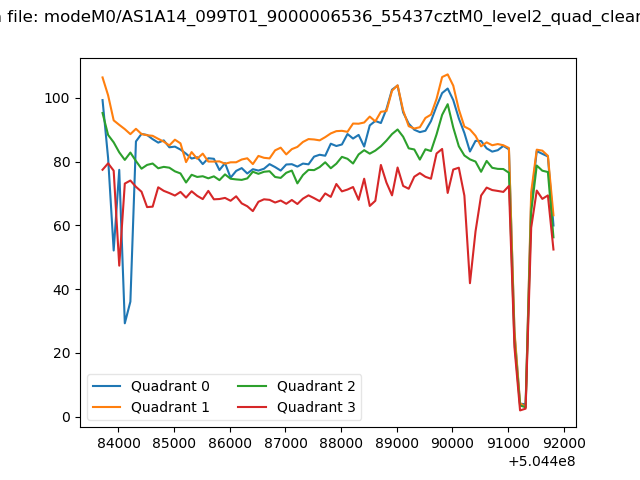 |
|
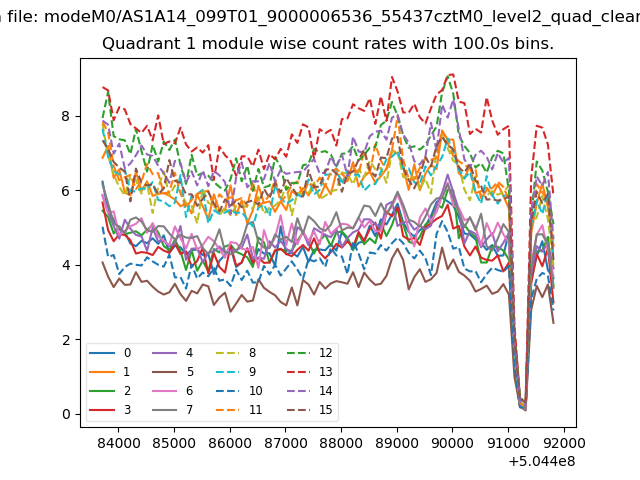
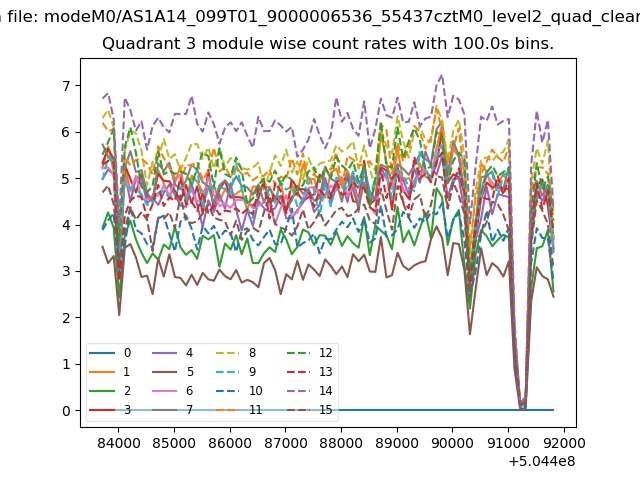
| Module-wise count rates for Quadrant A Data is divided into 100 sec bins |
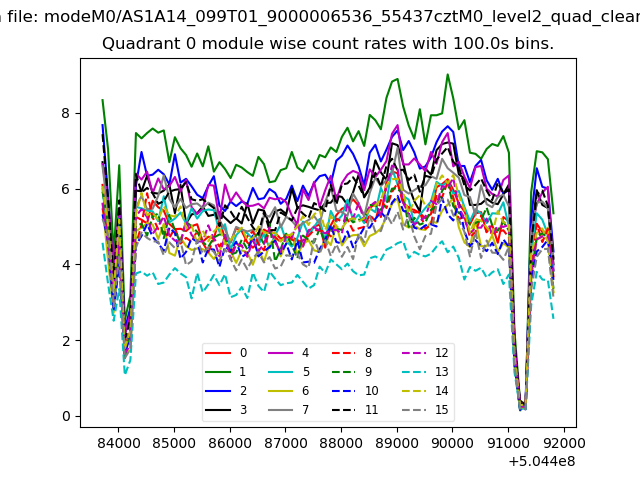 |
 |
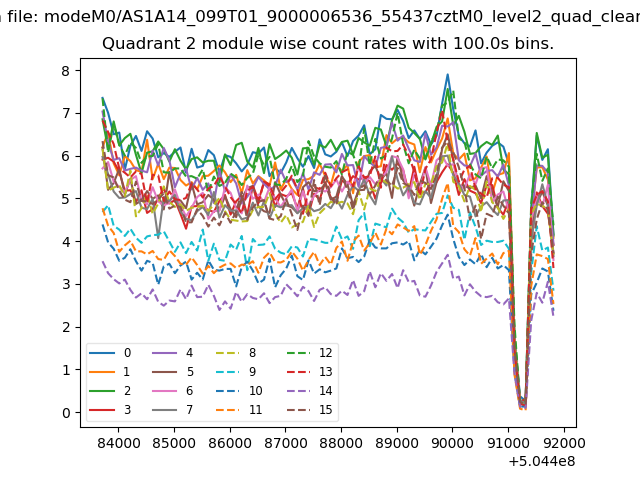
| Module-wise count rates for Quadrant B Data is divided into 100 sec bins |
 |
 |
| Module-wise count rates for Quadrant C Data is divided into 100 sec bins |
 |
 |
| Module-wise count rates for Quadrant D Data is divided into 100 sec bins |
 |
 |
| Parameter | Plot |
|---|---|
| CZT HV Monitor | 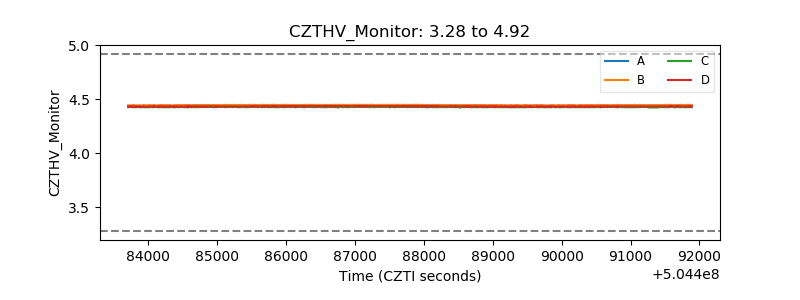 |
| D_VDD | 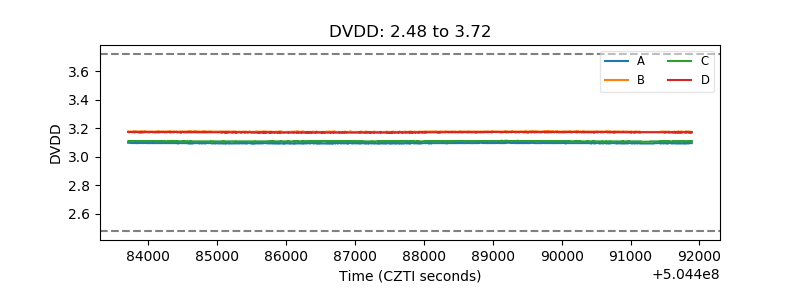 |
| Temperature 1 | 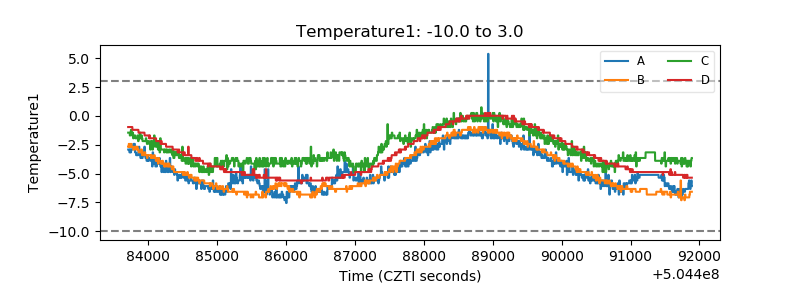 |
| Veto HV Monitor | 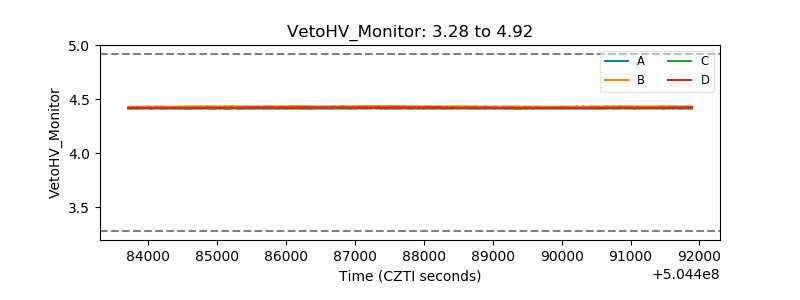 |
| Veto LLD | 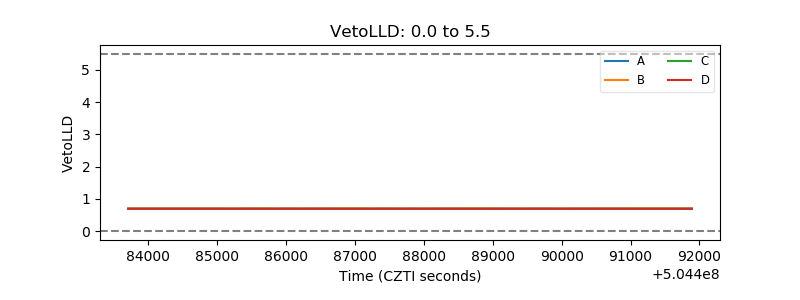 |
| Alpha Counter | 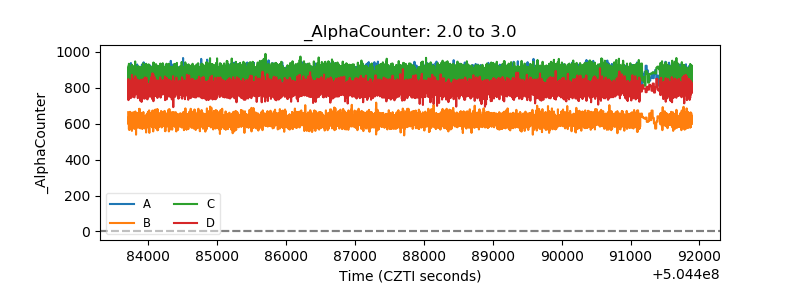 |
| _CPM_Rate | 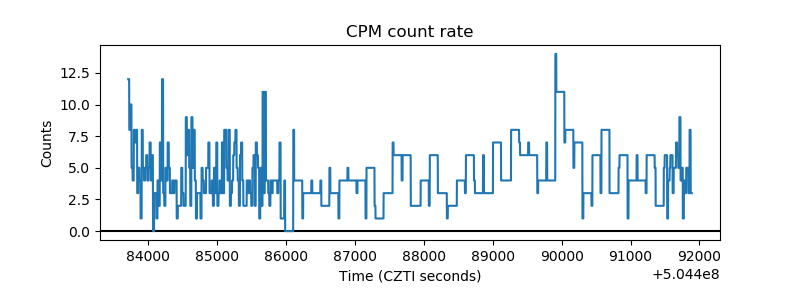 |
| CZT Counter | 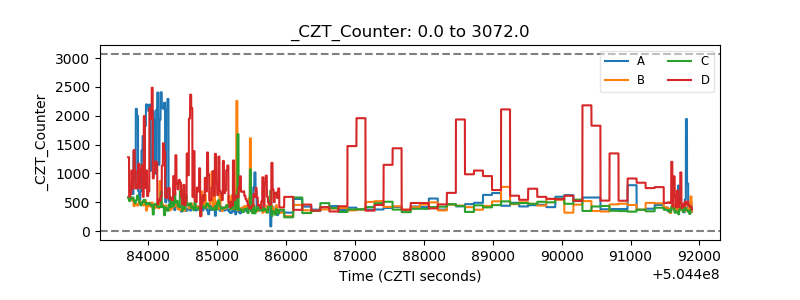 |
| +2.5 Volts monitor | 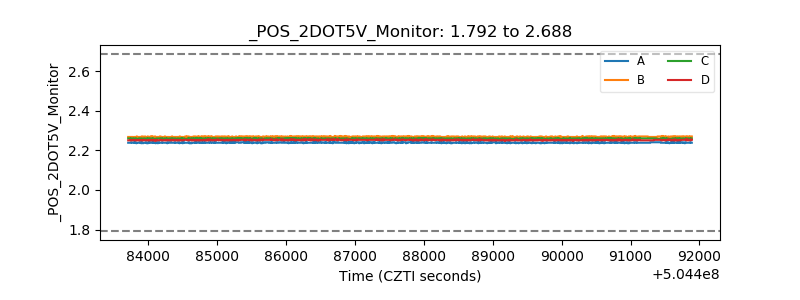 |
| +5 Volts monitor |  |
| _ROLL_ROT | 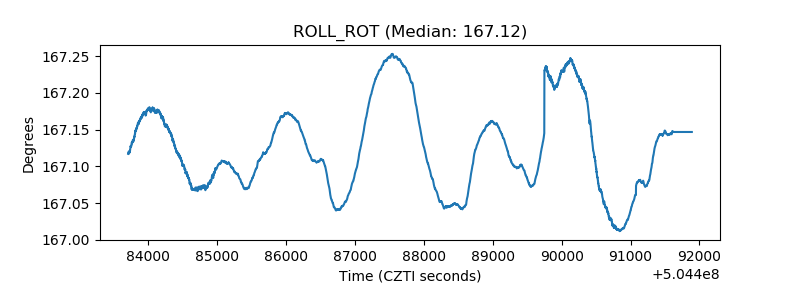 |
| _Roll_DEC | 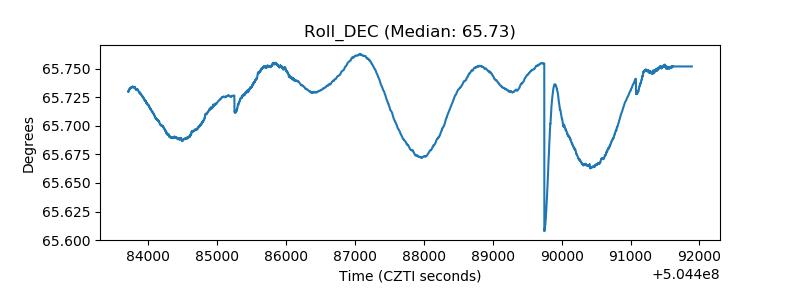 |
| _Roll_RA | 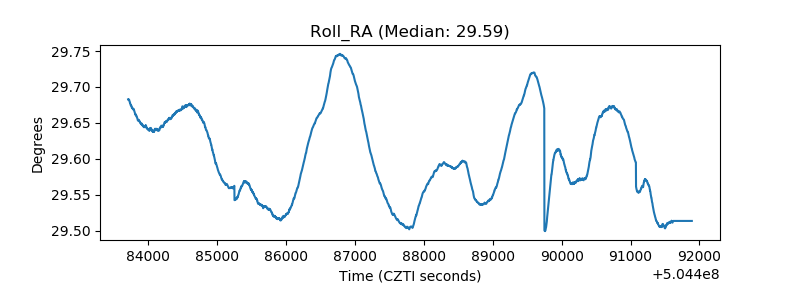 |
| Veto Counter | 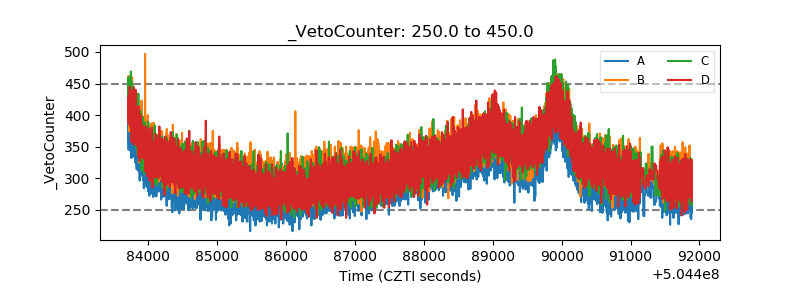 |