| Param | Original file | Final file |
|---|---|---|
| Filename | modeM0/AS1A14_099T01_9000006536_55440cztM0_level2.fits | modeM0/AS1A14_099T01_9000006536_55440cztM0_level2_quad_clean.evt |
| Size (bytes) | 1,142,107,200 | 229,996,800 |
| Size | 1.1 GB | 219.3 MB |
| Events in quadrant A | 9,008,836 | 1,492,467 |
| Events in quadrant B | 9,253,453 | 1,498,999 |
| Events in quadrant C | 9,522,637 | 1,412,703 |
| Events in quadrant D | 12,982,968 | 1,216,505 |
| Mode M9 | |||
|---|---|---|---|
| Quadrant | BADHDUFLAG | Total packets | Discarded packets |
| A | 0 | 10 | 0 |
| B | 0 | 10 | 0 |
| C | 0 | 10 | 0 |
| D | 0 | 10 | 0 |
| Mode SS | |||
|---|---|---|---|
| Quadrant | BADHDUFLAG | Total packets | Discarded packets |
| A | 0 | 394 | 0 |
| B | 0 | 394 | 0 |
| C | 0 | 394 | 0 |
| D | 0 | 394 | 0 |
| Mode M0 | |||
|---|---|---|---|
| Quadrant | BADHDUFLAG | Total packets | Discarded packets |
| A | 0 | 41582 | 6 |
| B | 0 | 42219 | 3 |
| C | 0 | 43307 | 3 |
| D | 0 | 52886 | 3 |
| Quadrant | Total seconds | Saturated seconds | Saturation percentage |
|---|---|---|---|
| A | 19471 | 186 | 0.955267% |
| B | 19471 | 368 | 1.889990% |
| C | 19472 | 326 | 1.674199% |
| D | 19472 | 914 | 4.693919% |
Noise dominated data is calculated using 1-second bins in cleaned event files. If a bin has >2000 counts, and if more than 50% of those come from <1% of pixels, then it is considered to be noise-dominated and hence unusable.
| Quadrant | # 1 sec bins | Bins with >0 counts | Bins with >2000 counts | High rate bins dominated by noise | Noise dominated (total time) | Noise dominated (detector-on time) | Marked lightcurve |
|---|---|---|---|---|---|---|---|
| A | 20801 | 19749 | 64 | 64 | 0.31% | 0.32% | 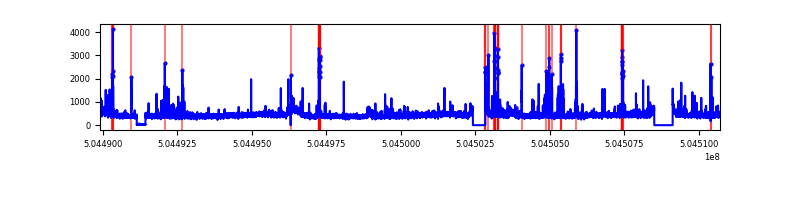 |
| B | 20801 | 19749 | 127 | 127 | 0.61% | 0.64% | 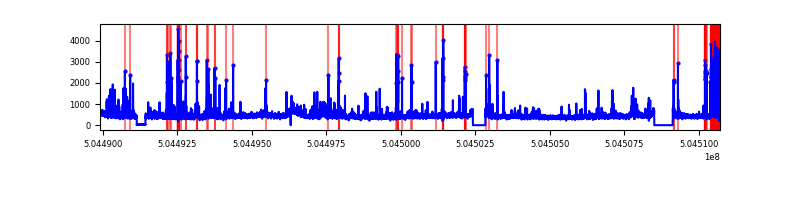 |
| C | 20802 | 19750 | 228 | 228 | 1.10% | 1.15% | 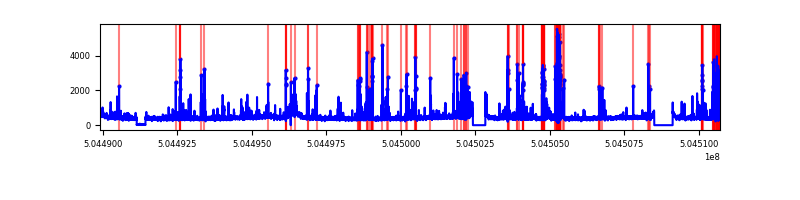 |
| D | 20802 | 19750 | 685 | 685 | 3.29% | 3.47% | 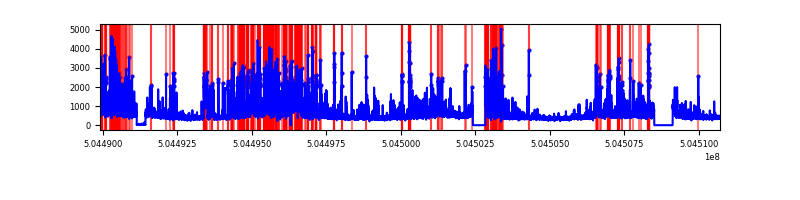 |
Top three noisy pixels from each quadrant. If the there are fewer than three noisy pixels in the level2.evt file, extra rows are filled as -1
| Pixel properties | Quadrant properties | ||||||
|---|---|---|---|---|---|---|---|
| Quadrant | DetID | PixID | Counts | Sigma | Mean | Median | Sigma |
| A | 3 | 78 | 401367 | 794.4 | 2042 | 1991 | 502.7 |
| A | 0 | 8 | 216212 | 426.11 | 2042 | 1991 | 502.7 |
| A | 4 | 159 | 215161 | 424.02 | 2042 | 1991 | 502.7 |
| B | 12 | 32 | 346510 | 808.18 | 2015 | 1937 | 426.4 |
| B | 10 | 247 | 197839 | 459.48 | 2015 | 1937 | 426.4 |
| B | 7 | 252 | 163827 | 379.71 | 2015 | 1937 | 426.4 |
| C | 13 | 3 | 1149392 | 2108.23 | 1987 | 1964 | 544.3 |
| C | 14 | 254 | 206447 | 375.71 | 1987 | 1964 | 544.3 |
| C | 9 | 38 | 99308 | 178.86 | 1987 | 1964 | 544.3 |
| D | 11 | 129 | 2194800 | 4001.29 | 1952 | 1866 | 548.1 |
| D | 8 | 48 | 1490567 | 2716.32 | 1952 | 1866 | 548.1 |
| D | 3 | 12 | 406063 | 737.51 | 1952 | 1866 | 548.1 |
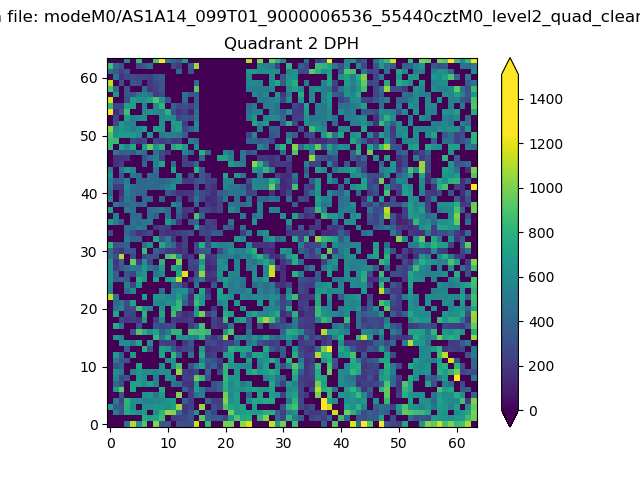
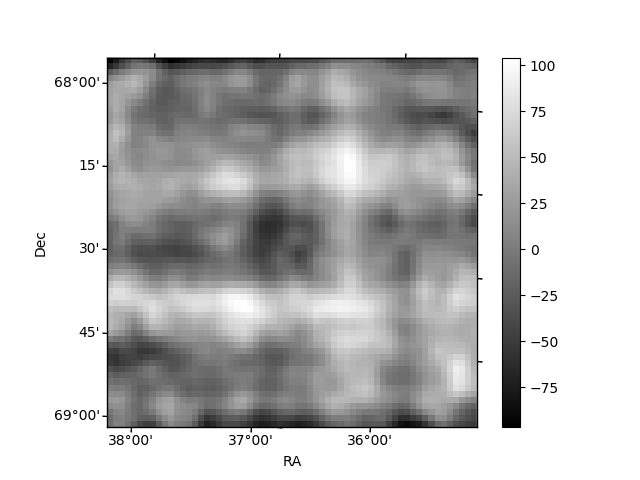
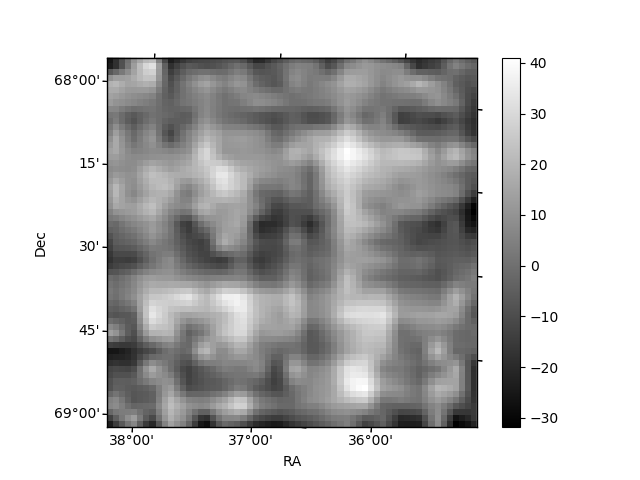
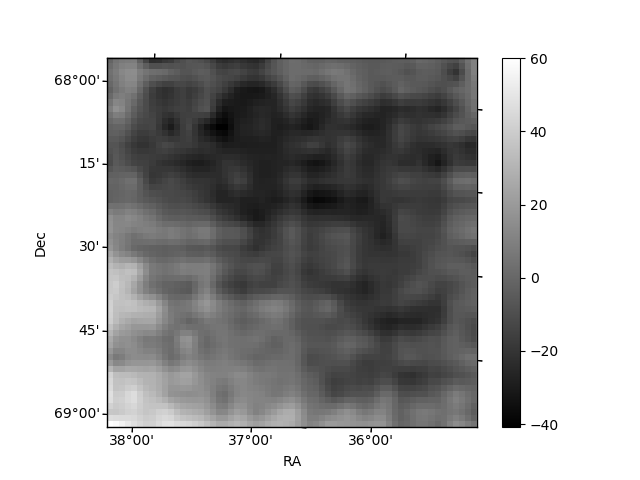
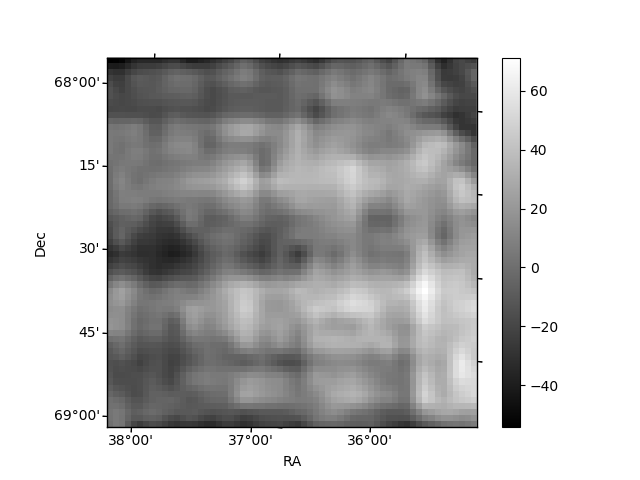
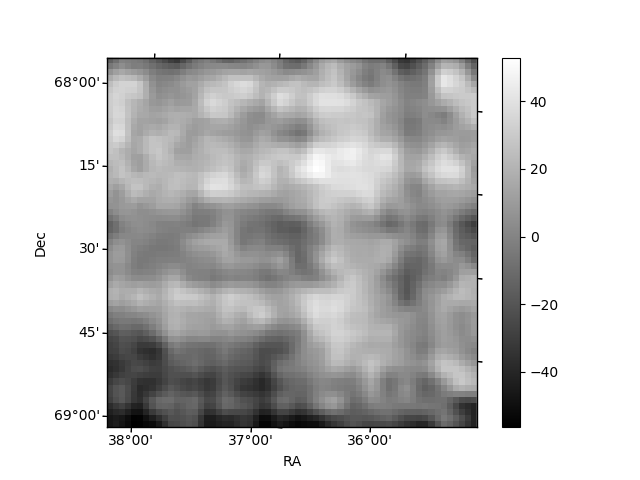
Histogram calculated using DETX and DETY for each event in the final _common_clean file
| Quadrant A | 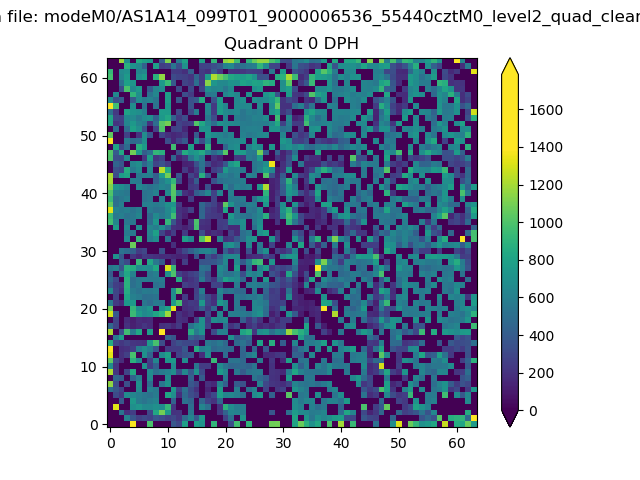 |
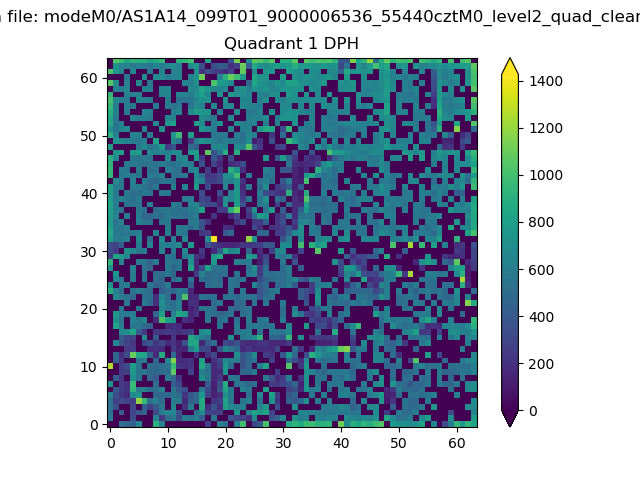 |
Quadrant B |
|---|---|---|---|
| Quadrant D | 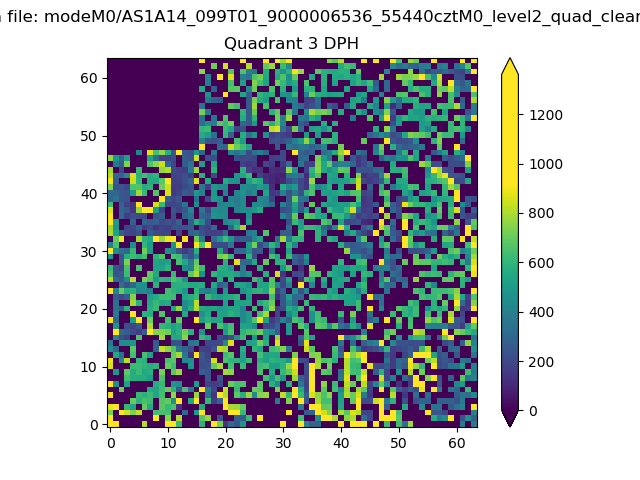 |
 |
Quadrant C |
| Plot type | Count rate plots | Images |
|---|---|---|
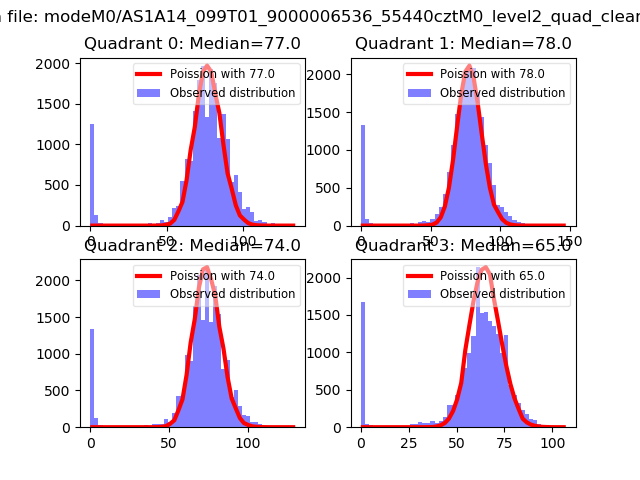
| Comparison with Poisson distribution Blue bars denote a histogram of data divided into 1 sec bins. Red curve is a Poisson curve with rate = median count rate of data. |
 |
 |
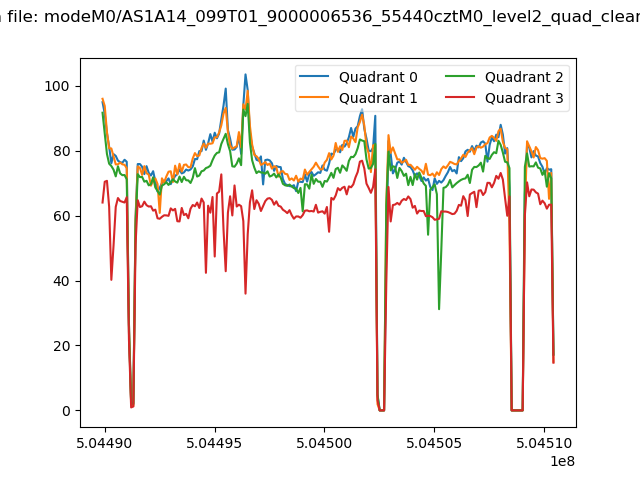
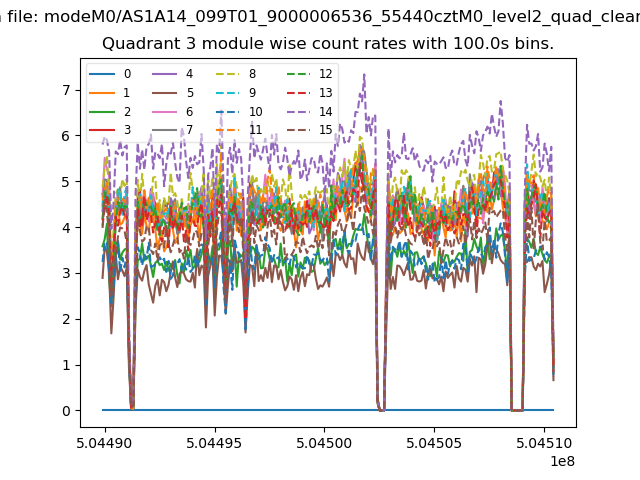
| Quadrant-wise count rates Data is divided into 100 sec bins |
 |
|
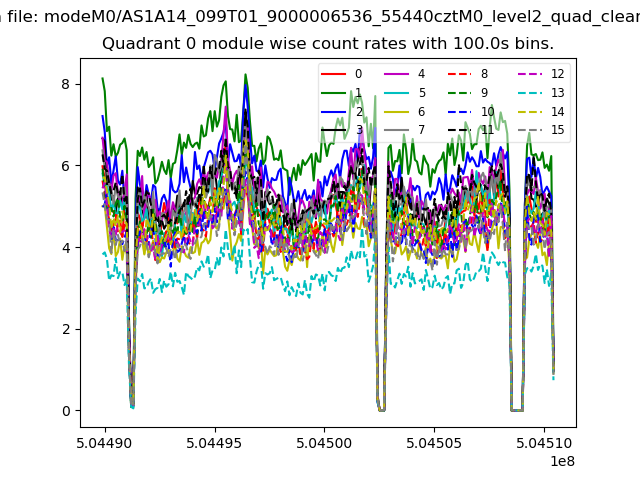
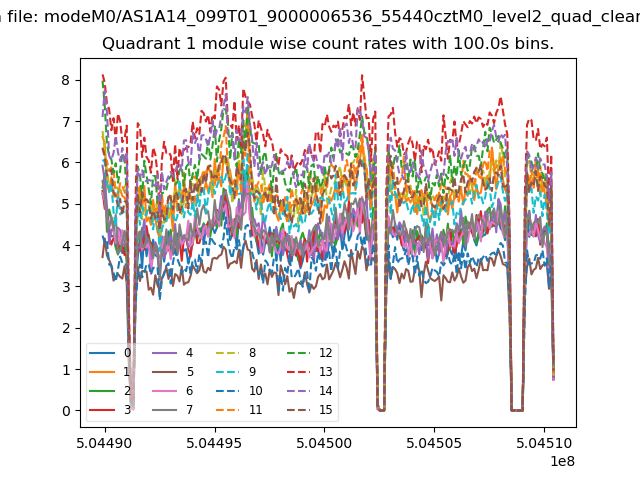
| Module-wise count rates for Quadrant A Data is divided into 100 sec bins |
 |
 |
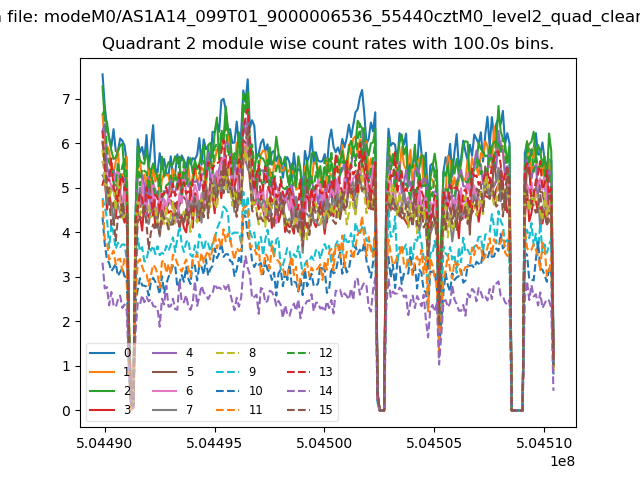
| Module-wise count rates for Quadrant B Data is divided into 100 sec bins |
 |
 |
| Module-wise count rates for Quadrant C Data is divided into 100 sec bins |
 |
 |
| Module-wise count rates for Quadrant D Data is divided into 100 sec bins |
 |
 |
| Parameter | Plot |
|---|---|
| CZT HV Monitor | 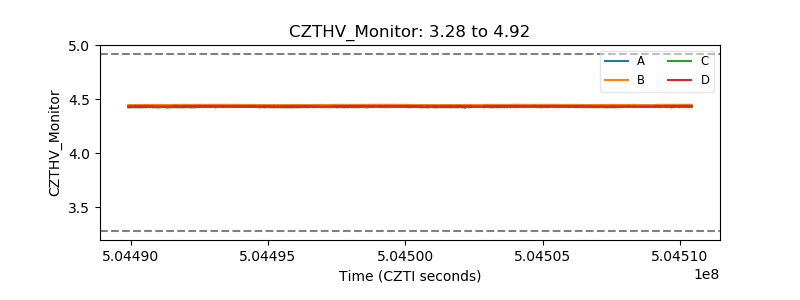 |
| D_VDD | 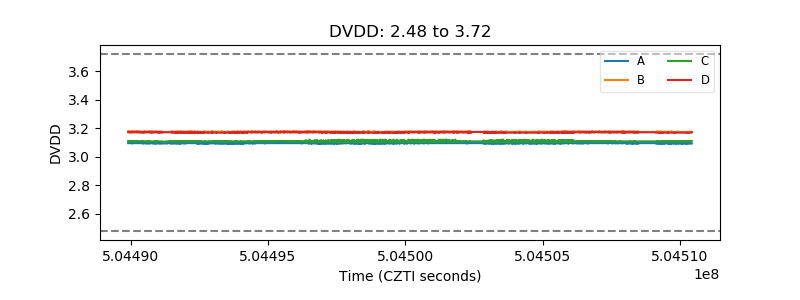 |
| Temperature 1 | 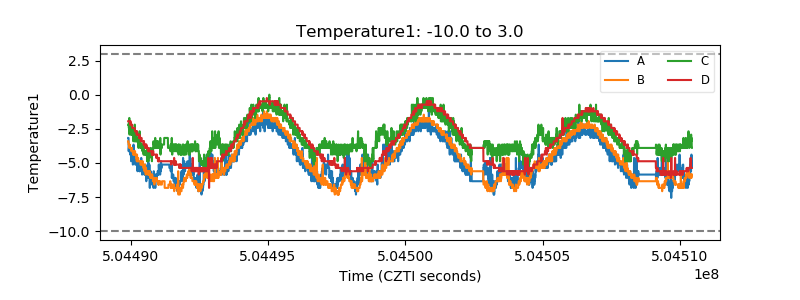 |
| Veto HV Monitor | 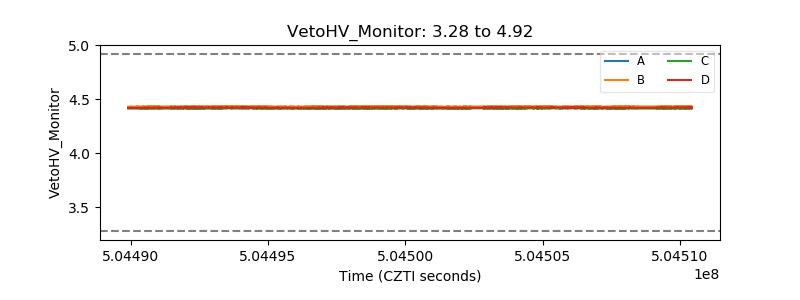 |
| Veto LLD | 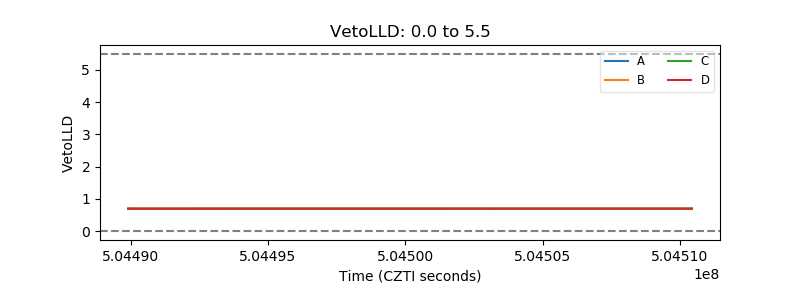 |
| Alpha Counter | 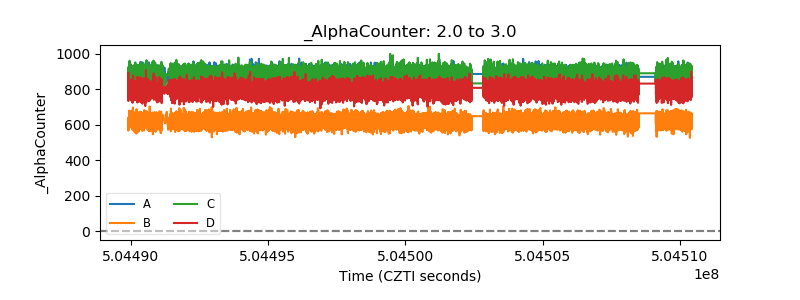 |
| _CPM_Rate | 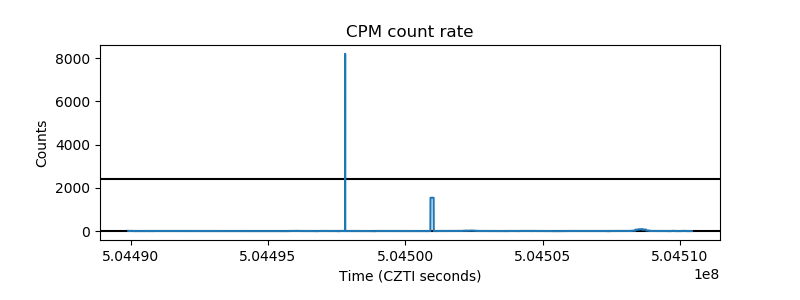 |
| CZT Counter | 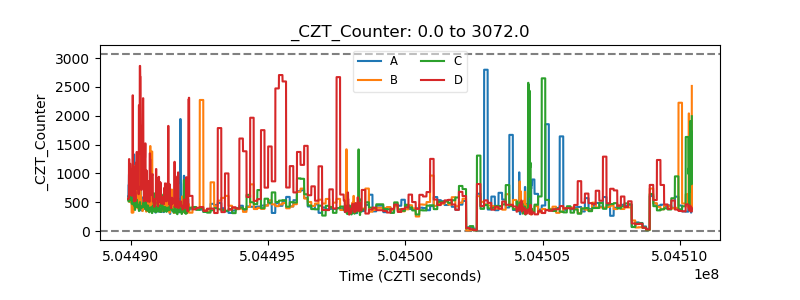 |
| +2.5 Volts monitor |  |
| +5 Volts monitor | 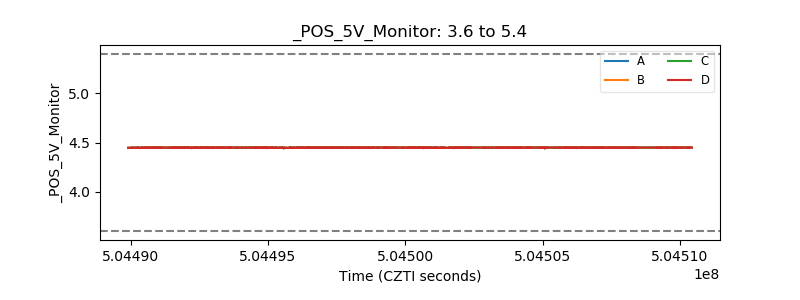 |
| _ROLL_ROT | 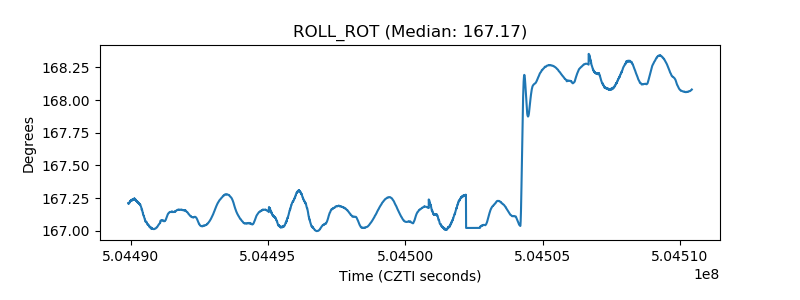 |
| _Roll_DEC | 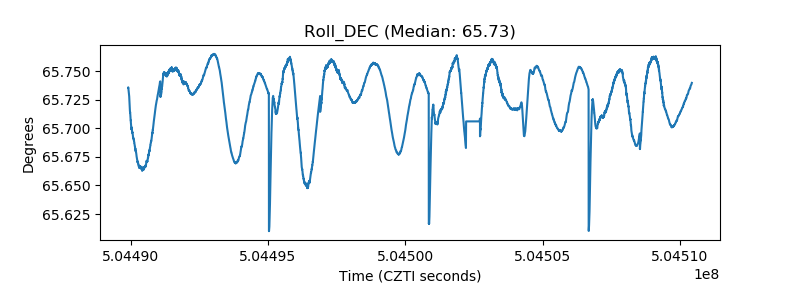 |
| _Roll_RA | 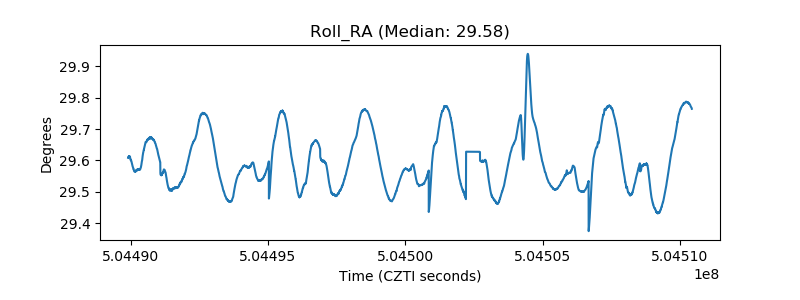 |
| Veto Counter | 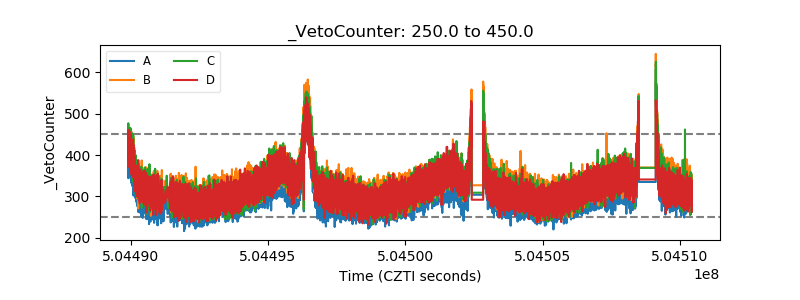 |