| Param | Original file | Final file |
|---|---|---|
| Filename | modeM0/AS1A14_099T01_9000006536_55443cztM0_level2.fits | modeM0/AS1A14_099T01_9000006536_55443cztM0_level2_quad_clean.evt |
| Size (bytes) | 392,402,880 | 98,527,680 |
| Size | 374.2 MB | 94.0 MB |
| Events in quadrant A | 3,348,949 | 641,432 |
| Events in quadrant B | 3,033,731 | 688,665 |
| Events in quadrant C | 4,086,707 | 596,770 |
| Events in quadrant D | 3,520,708 | 577,827 |
| Mode M9 | |||
|---|---|---|---|
| Quadrant | BADHDUFLAG | Total packets | Discarded packets |
| A | 0 | 18 | 0 |
| B | 0 | 18 | 0 |
| C | 0 | 18 | 0 |
| D | 0 | 18 | 0 |
| Mode SS | |||
|---|---|---|---|
| Quadrant | BADHDUFLAG | Total packets | Discarded packets |
| A | 0 | 142 | 2 |
| B | 0 | 142 | 2 |
| C | 0 | 142 | 0 |
| D | 0 | 142 | 0 |
| Mode M0 | |||
|---|---|---|---|
| Quadrant | BADHDUFLAG | Total packets | Discarded packets |
| A | 0 | 15144 | 113 |
| B | 0 | 14356 | 126 |
| C | 0 | 17405 | 190 |
| D | 0 | 15610 | 133 |
| Quadrant | Total seconds | Saturated seconds | Saturation percentage |
|---|---|---|---|
| A | 6873 | 132 | 1.920559% |
| B | 6871 | 132 | 1.921118% |
| C | 6872 | 290 | 4.220023% |
| D | 6874 | 124 | 1.803899% |
Noise dominated data is calculated using 1-second bins in cleaned event files. If a bin has >2000 counts, and if more than 50% of those come from <1% of pixels, then it is considered to be noise-dominated and hence unusable.
| Quadrant | # 1 sec bins | Bins with >0 counts | Bins with >2000 counts | High rate bins dominated by noise | Noise dominated (total time) | Noise dominated (detector-on time) | Marked lightcurve |
|---|---|---|---|---|---|---|---|
| A | 8690 | 6892 | 19 | 19 | 0.22% | 0.28% | 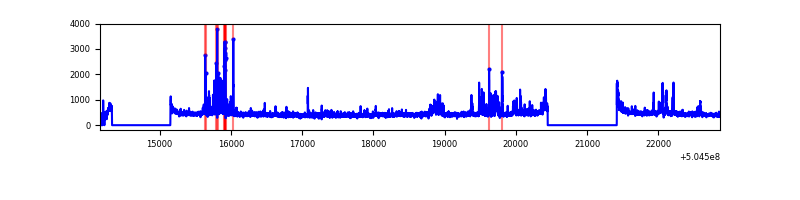 |
| B | 8701 | 6890 | 4 | 4 | 0.05% | 0.06% | 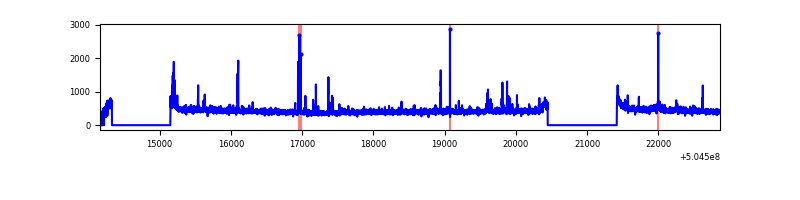 |
| C | 8699 | 6892 | 191 | 191 | 2.20% | 2.77% | 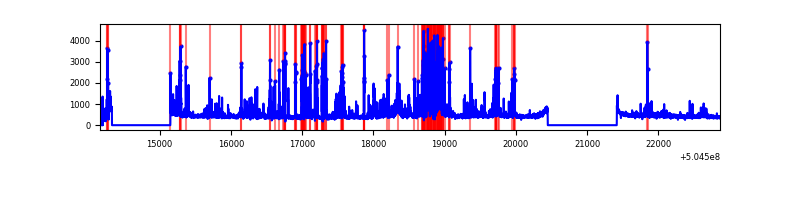 |
| D | 8689 | 6887 | 47 | 47 | 0.54% | 0.68% | 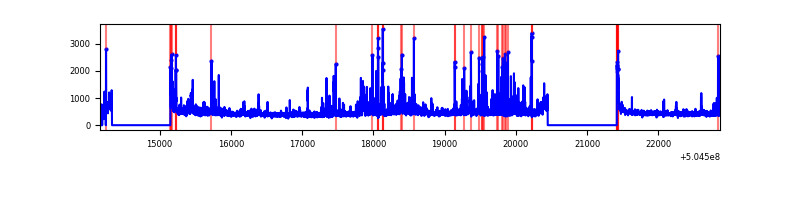 |
Top three noisy pixels from each quadrant. If the there are fewer than three noisy pixels in the level2.evt file, extra rows are filled as -1
| Pixel properties | Quadrant properties | ||||||
|---|---|---|---|---|---|---|---|
| Quadrant | DetID | PixID | Counts | Sigma | Mean | Median | Sigma |
| A | 3 | 78 | 356622 | 1947.58 | 738 | 717 | 182.7 |
| A | 0 | 8 | 52772 | 284.85 | 738 | 717 | 182.7 |
| A | 4 | 3 | 22860 | 121.17 | 738 | 717 | 182.7 |
| B | 0 | 171 | 29762 | 184.42 | 728 | 699 | 157.6 |
| B | 12 | 32 | 28355 | 175.5 | 728 | 699 | 157.6 |
| B | 10 | 247 | 20762 | 127.31 | 728 | 699 | 157.6 |
| C | 13 | 3 | 1138077 | 5890.02 | 703 | 693 | 193.1 |
| C | 12 | 252 | 99629 | 512.34 | 703 | 693 | 193.1 |
| C | 15 | 178 | 31858 | 161.39 | 703 | 693 | 193.1 |
| D | 11 | 129 | 373238 | 1859.1 | 710 | 679 | 200.4 |
| D | 8 | 48 | 177192 | 880.81 | 710 | 679 | 200.4 |
| D | 5 | 173 | 56766 | 279.88 | 710 | 679 | 200.4 |
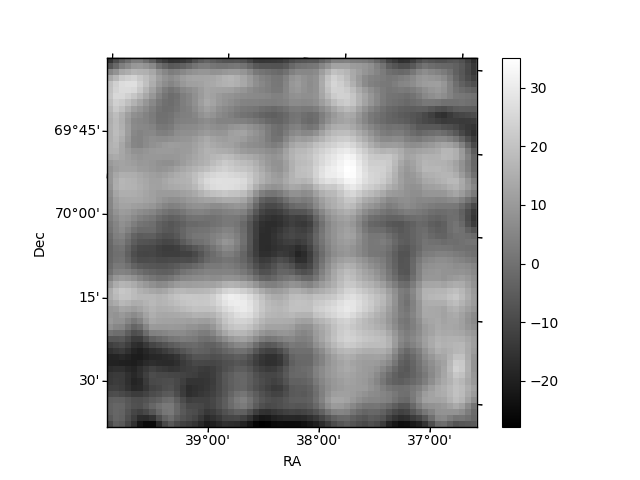
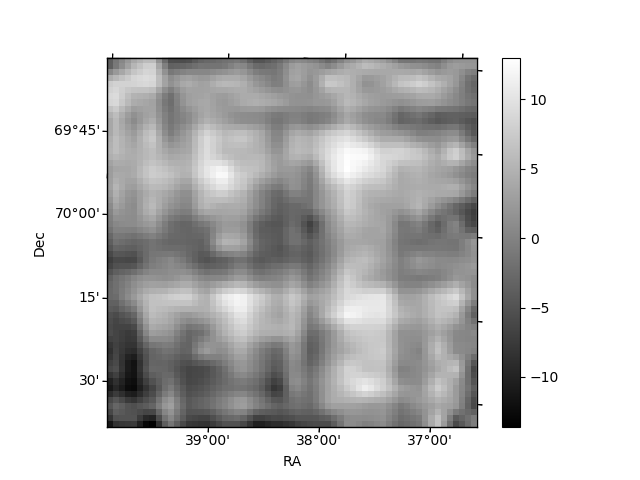
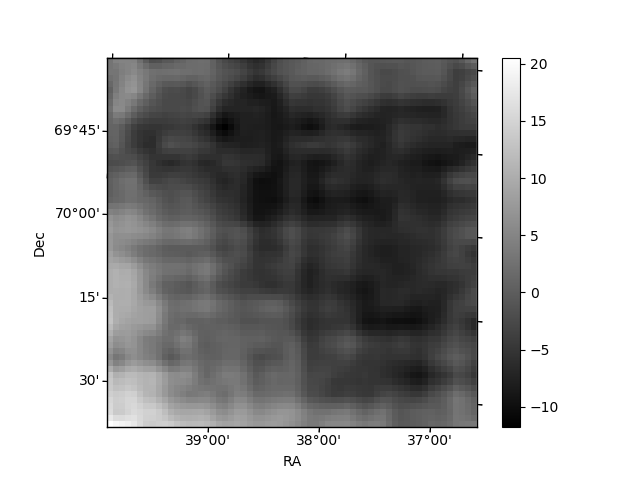
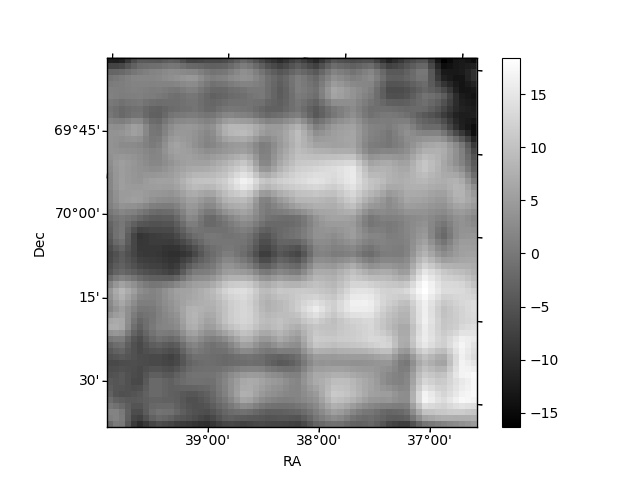
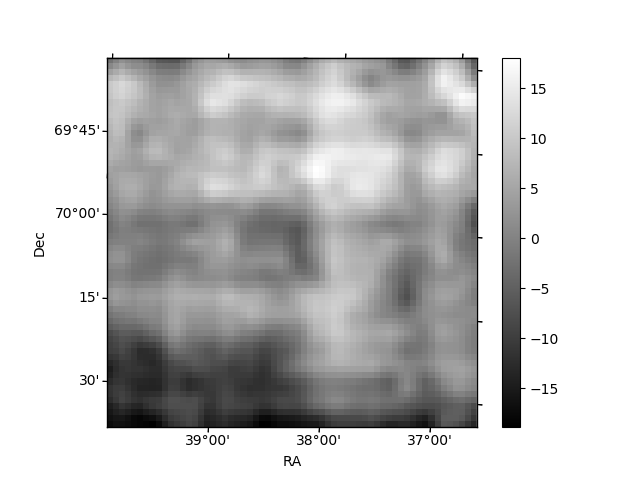
Histogram calculated using DETX and DETY for each event in the final _common_clean file
| Quadrant A | 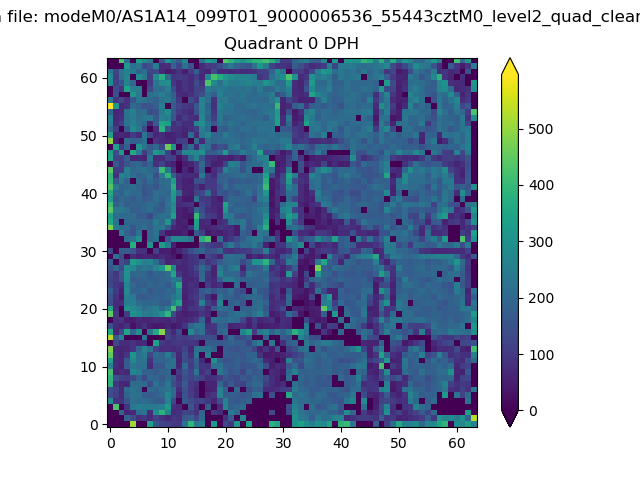 |
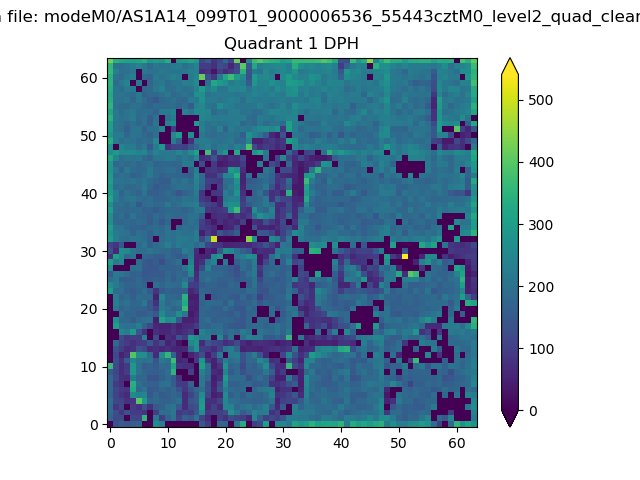 |
Quadrant B |
|---|---|---|---|
| Quadrant D | 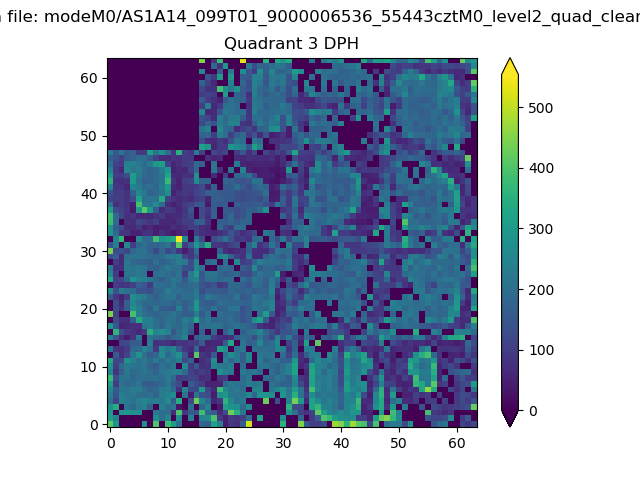 |
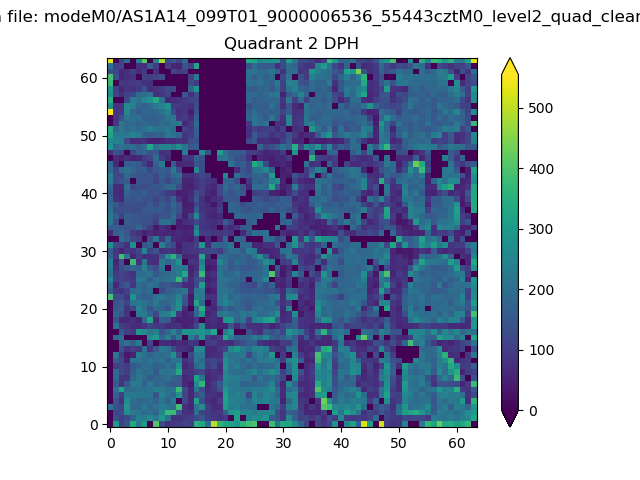 |
Quadrant C |
| Plot type | Count rate plots | Images |
|---|---|---|
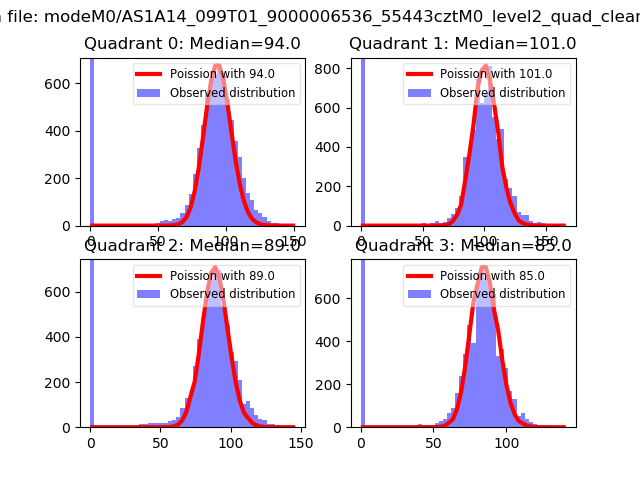
| Comparison with Poisson distribution Blue bars denote a histogram of data divided into 1 sec bins. Red curve is a Poisson curve with rate = median count rate of data. |
 |
 |
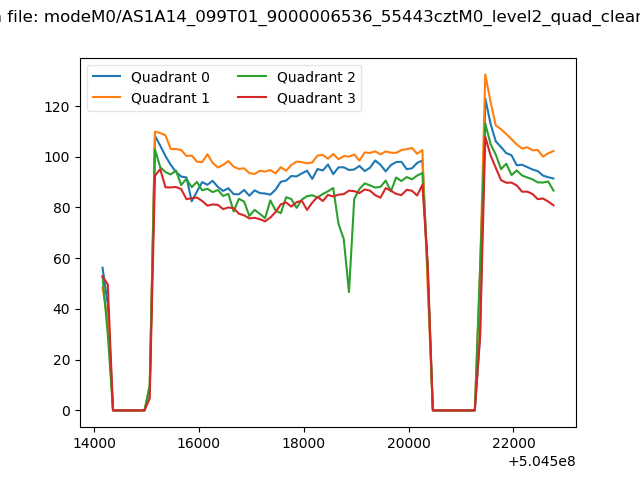
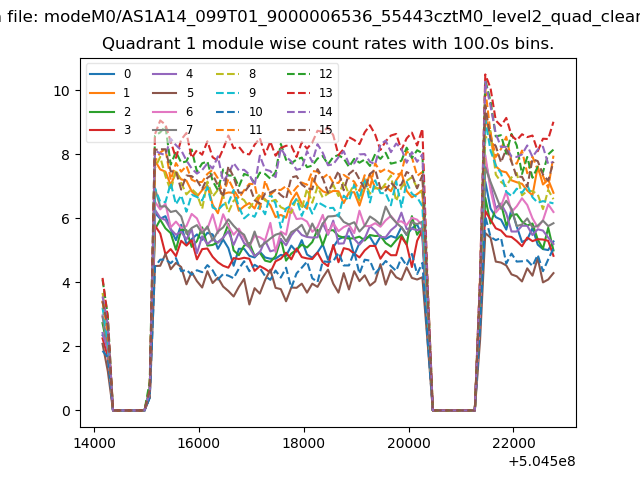
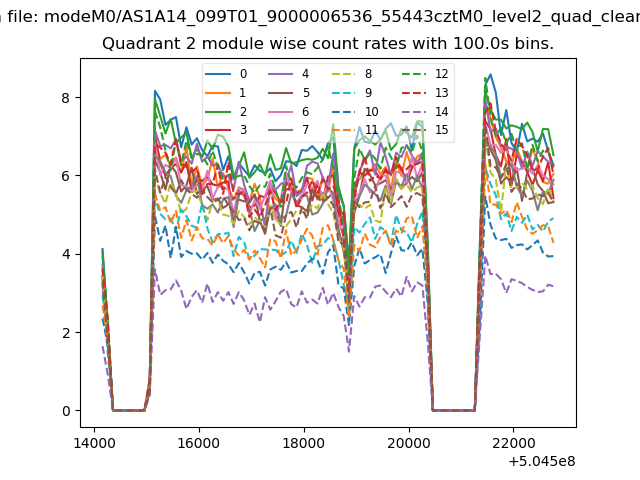
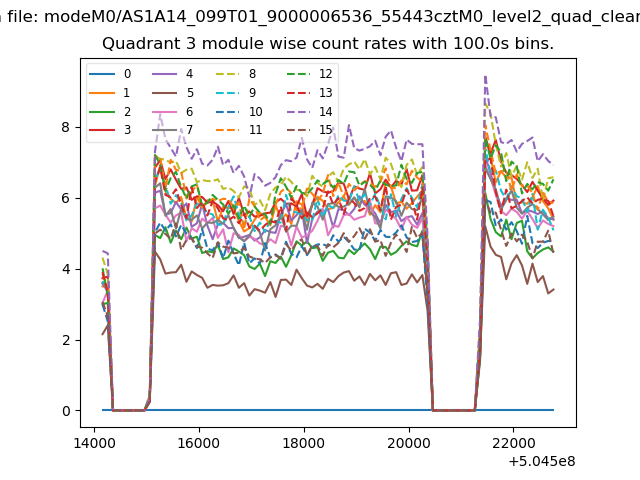
| Quadrant-wise count rates Data is divided into 100 sec bins |
 |
|
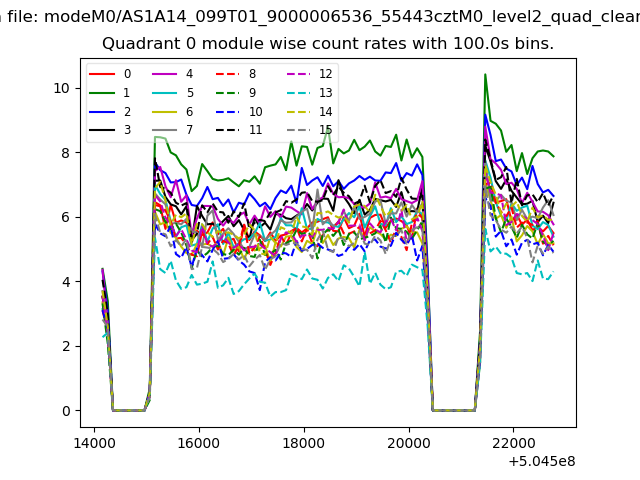
| Module-wise count rates for Quadrant A Data is divided into 100 sec bins |
 |
 |
| Module-wise count rates for Quadrant B Data is divided into 100 sec bins |
 |
 |
| Module-wise count rates for Quadrant C Data is divided into 100 sec bins |
 |
 |
| Module-wise count rates for Quadrant D Data is divided into 100 sec bins |
 |
 |
| Parameter | Plot |
|---|---|
| CZT HV Monitor | 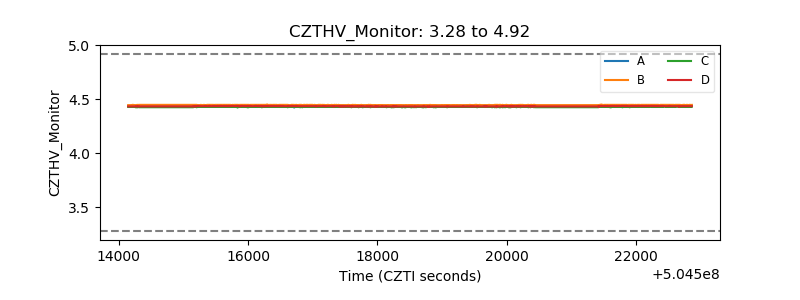 |
| D_VDD | 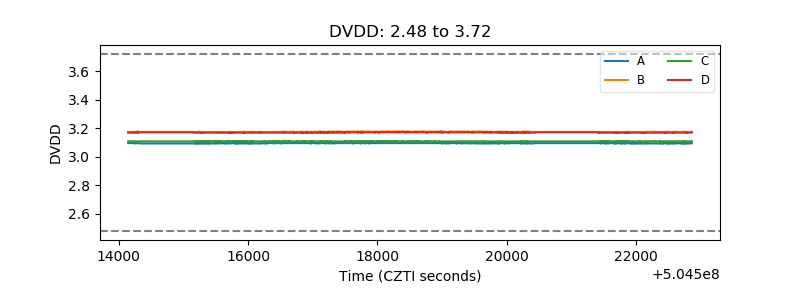 |
| Temperature 1 | 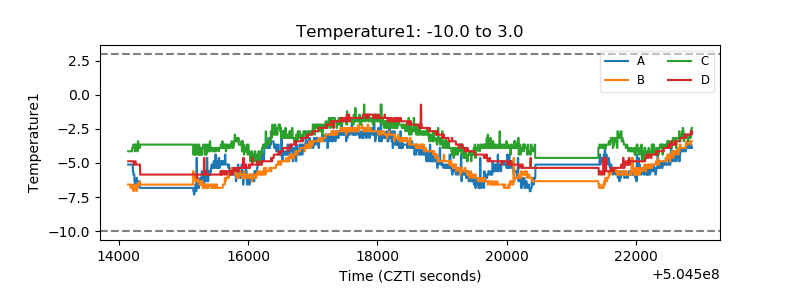 |
| Veto HV Monitor | 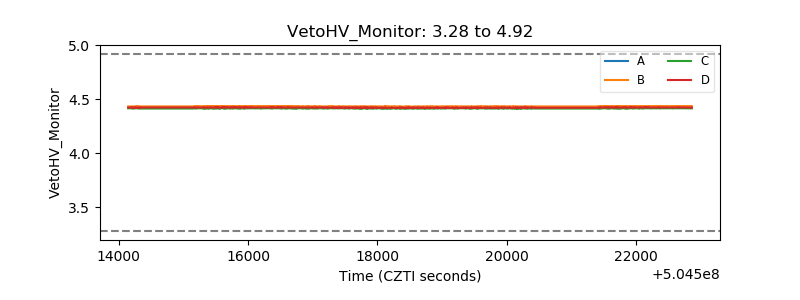 |
| Veto LLD | 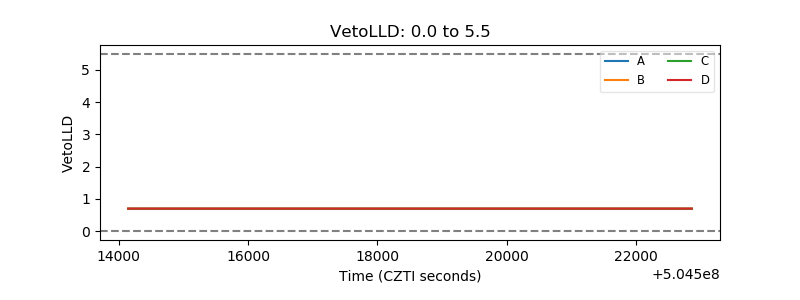 |
| Alpha Counter | 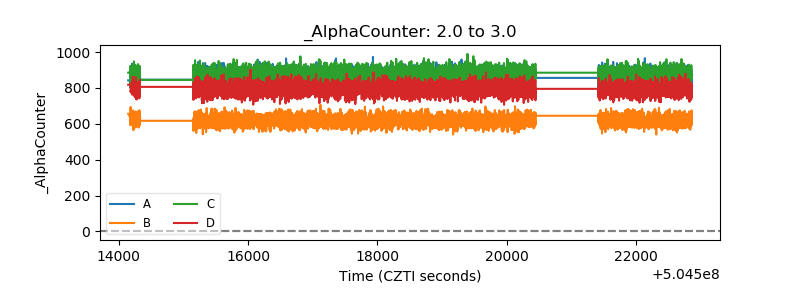 |
| _CPM_Rate | 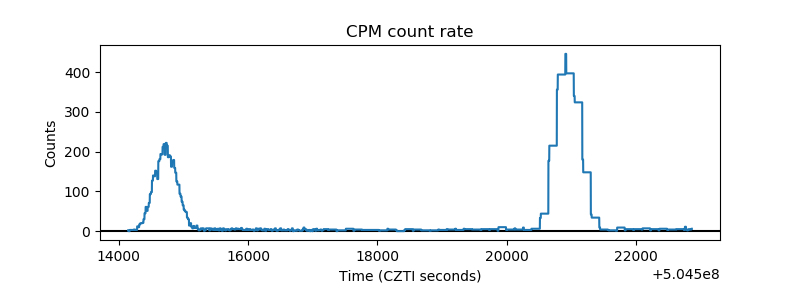 |
| CZT Counter | 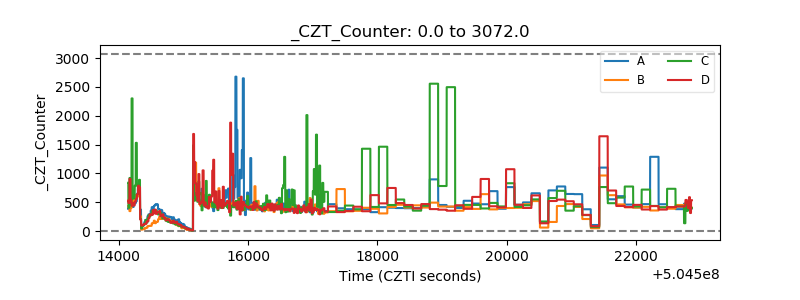 |
| +2.5 Volts monitor |  |
| +5 Volts monitor |  |
| _ROLL_ROT | 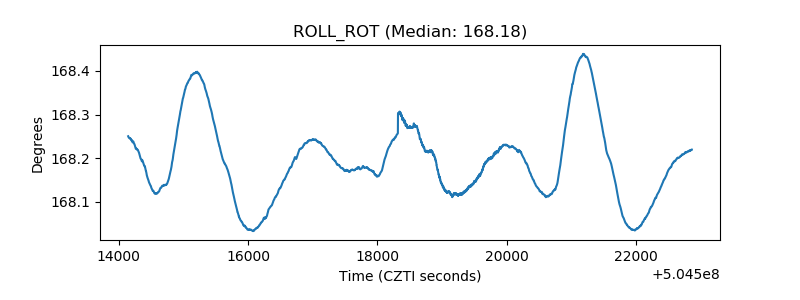 |
| _Roll_DEC | 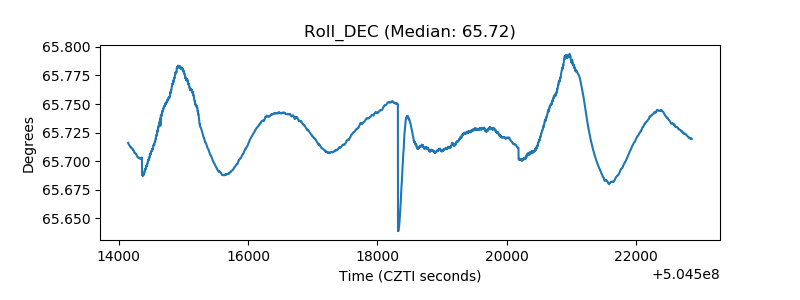 |
| _Roll_RA | 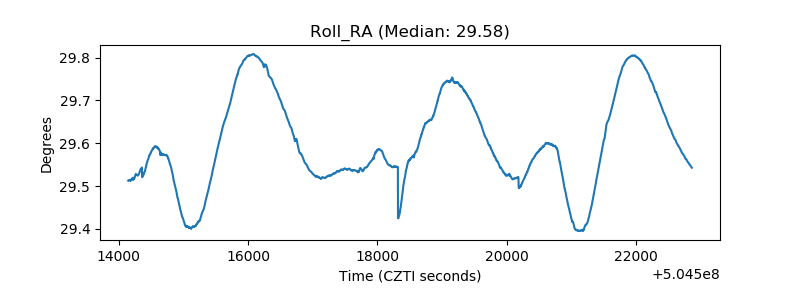 |
| Veto Counter | 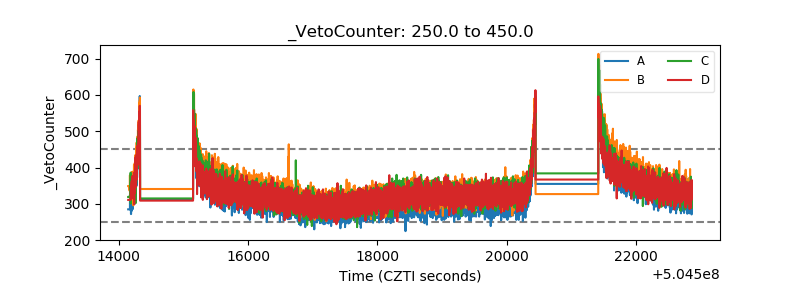 |