| Param | Original file | Final file |
|---|---|---|
| Filename | modeM0/AS1A14_099T01_9000006536_55444cztM0_level2.fits | modeM0/AS1A14_099T01_9000006536_55444cztM0_level2_quad_clean.evt |
| Size (bytes) | 394,850,880 | 96,491,520 |
| Size | 376.6 MB | 92.0 MB |
| Events in quadrant A | 3,536,805 | 639,225 |
| Events in quadrant B | 3,993,724 | 639,897 |
| Events in quadrant C | 2,904,366 | 611,566 |
| Events in quadrant D | 3,666,620 | 570,603 |
| Mode M9 | |||
|---|---|---|---|
| Quadrant | BADHDUFLAG | Total packets | Discarded packets |
| A | 0 | 14 | 0 |
| B | 0 | 14 | 0 |
| C | 0 | 14 | 0 |
| D | 0 | 15 | 0 |
| Mode SS | |||
|---|---|---|---|
| Quadrant | BADHDUFLAG | Total packets | Discarded packets |
| A | 0 | 134 | 0 |
| B | 0 | 134 | 0 |
| C | 0 | 134 | 0 |
| D | 0 | 134 | 0 |
| Mode M0 | |||
|---|---|---|---|
| Quadrant | BADHDUFLAG | Total packets | Discarded packets |
| A | 0 | 15233 | 2 |
| B | 0 | 16877 | 2 |
| C | 0 | 13742 | 2 |
| D | 0 | 15648 | 2 |
| Quadrant | Total seconds | Saturated seconds | Saturation percentage |
|---|---|---|---|
| A | 6605 | 197 | 2.982589% |
| B | 6605 | 607 | 9.190008% |
| C | 6605 | 75 | 1.135503% |
| D | 6605 | 203 | 3.073429% |
Noise dominated data is calculated using 1-second bins in cleaned event files. If a bin has >2000 counts, and if more than 50% of those come from <1% of pixels, then it is considered to be noise-dominated and hence unusable.
| Quadrant | # 1 sec bins | Bins with >0 counts | Bins with >2000 counts | High rate bins dominated by noise | Noise dominated (total time) | Noise dominated (detector-on time) | Marked lightcurve |
|---|---|---|---|---|---|---|---|
| A | 7650 | 6606 | 76 | 76 | 0.99% | 1.15% | 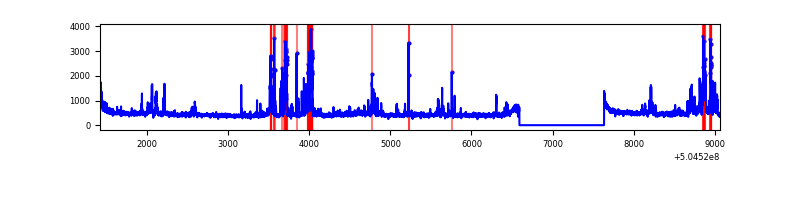 |
| B | 7650 | 6605 | 337 | 337 | 4.41% | 5.10% | 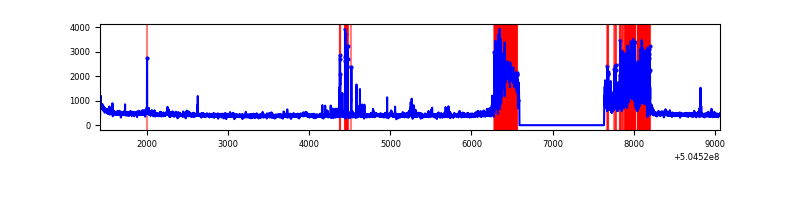 |
| C | 7650 | 6606 | 6 | 6 | 0.08% | 0.09% | 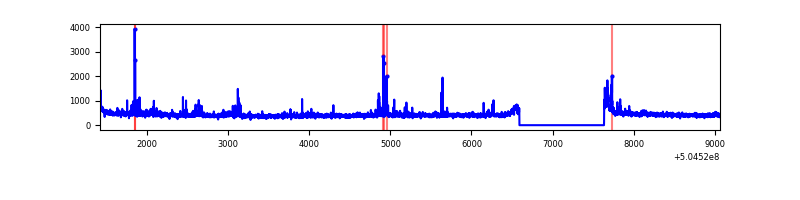 |
| D | 7650 | 6605 | 96 | 96 | 1.25% | 1.45% | 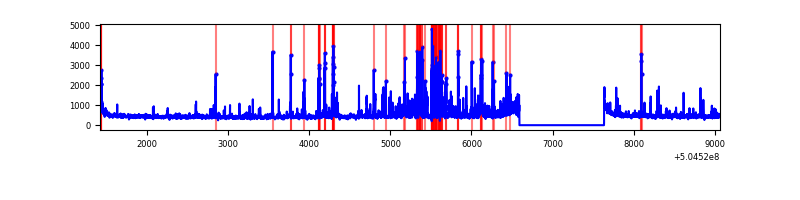 |
Top three noisy pixels from each quadrant. If the there are fewer than three noisy pixels in the level2.evt file, extra rows are filled as -1
| Pixel properties | Quadrant properties | ||||||
|---|---|---|---|---|---|---|---|
| Quadrant | DetID | PixID | Counts | Sigma | Mean | Median | Sigma |
| A | 3 | 78 | 628804 | 3555.29 | 719 | 701 | 176.7 |
| A | 12 | 115 | 40588 | 225.77 | 719 | 701 | 176.7 |
| A | 15 | 32 | 27398 | 151.11 | 719 | 701 | 176.7 |
| B | 12 | 32 | 1199627 | 8344.21 | 670 | 645 | 143.7 |
| B | 10 | 247 | 91338 | 631.17 | 670 | 645 | 143.7 |
| B | 12 | 111 | 16860 | 112.85 | 670 | 645 | 143.7 |
| C | 13 | 3 | 94925 | 491.51 | 694 | 685 | 191.7 |
| C | 12 | 252 | 45664 | 234.59 | 694 | 685 | 191.7 |
| C | 15 | 147 | 33334 | 170.28 | 694 | 685 | 191.7 |
| D | 11 | 129 | 602757 | 3130.82 | 687 | 658 | 192.3 |
| D | 2 | 249 | 93436 | 482.43 | 687 | 658 | 192.3 |
| D | 5 | 173 | 52549 | 269.82 | 687 | 658 | 192.3 |
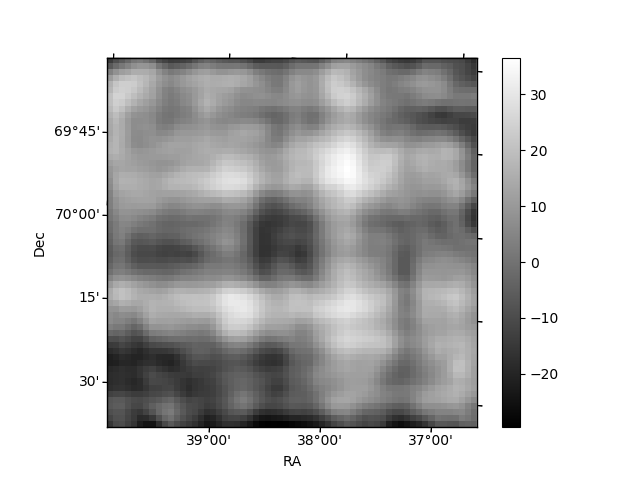
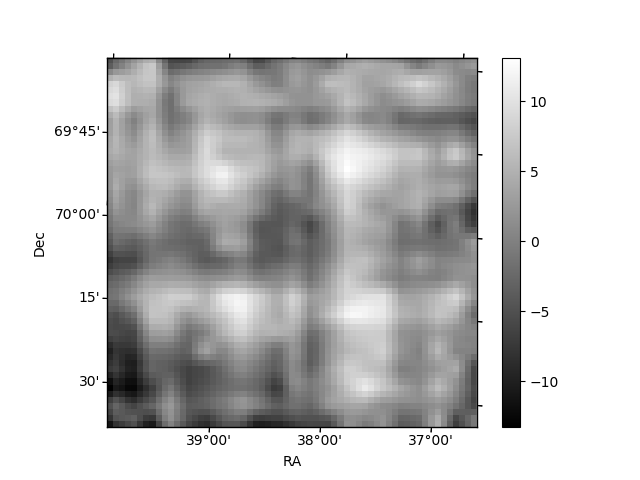
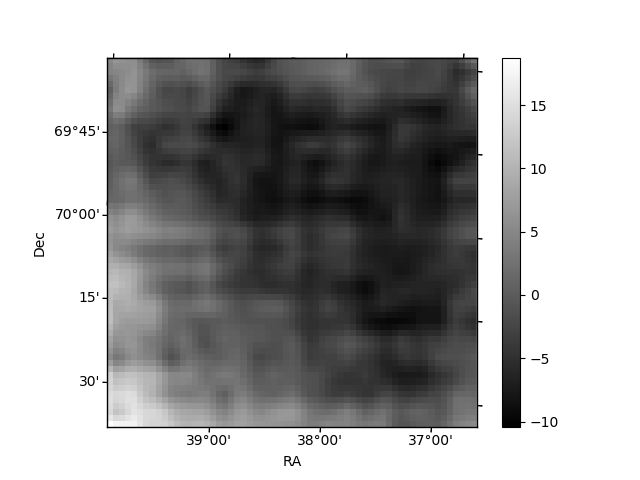
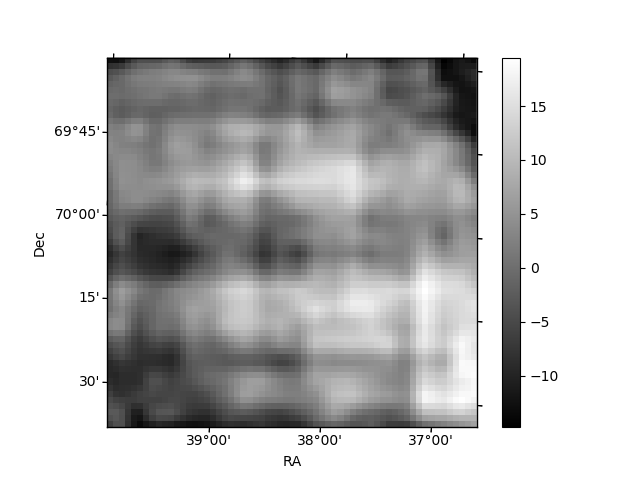
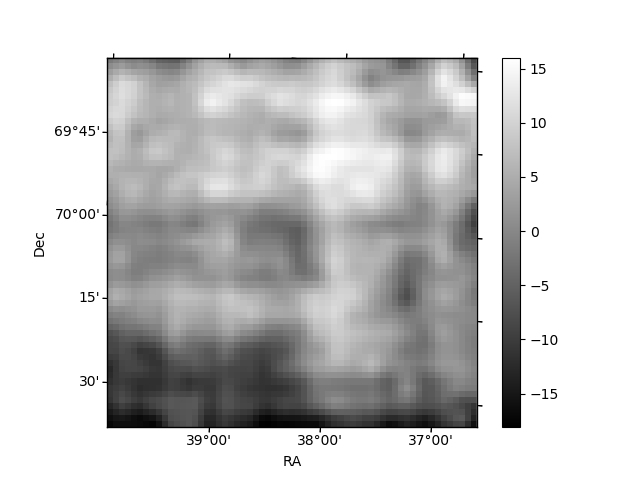
Histogram calculated using DETX and DETY for each event in the final _common_clean file
| Quadrant A | 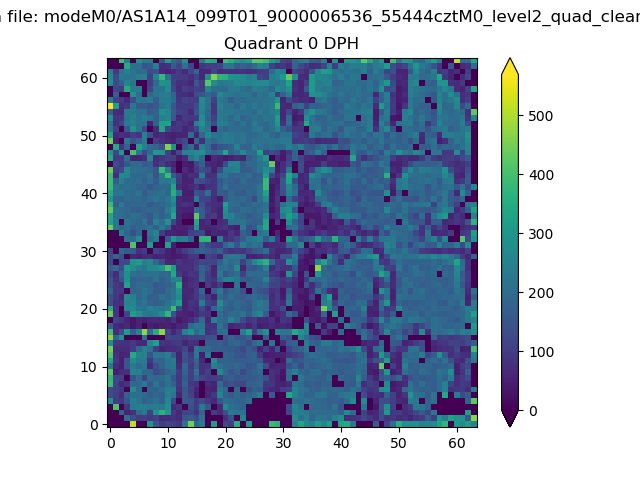 |
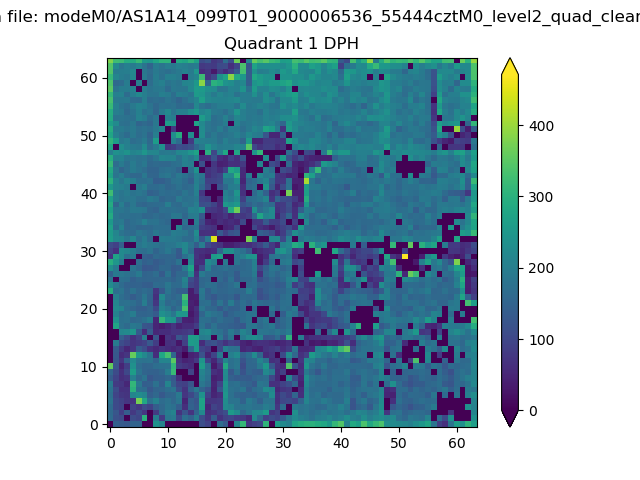 |
Quadrant B |
|---|---|---|---|
| Quadrant D | 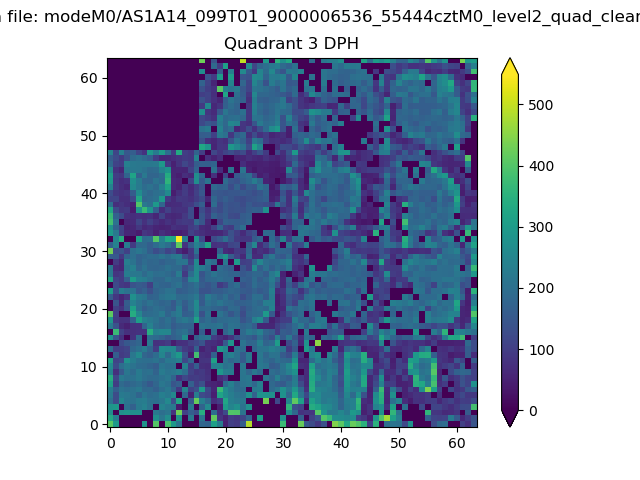 |
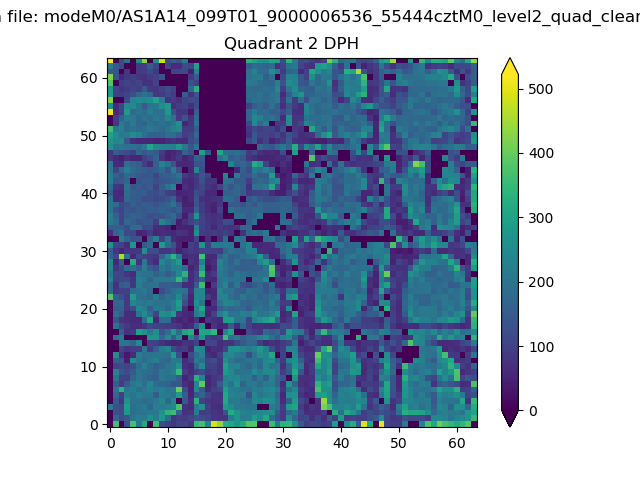 |
Quadrant C |
| Plot type | Count rate plots | Images |
|---|---|---|
| Comparison with Poisson distribution Blue bars denote a histogram of data divided into 1 sec bins. Red curve is a Poisson curve with rate = median count rate of data. |
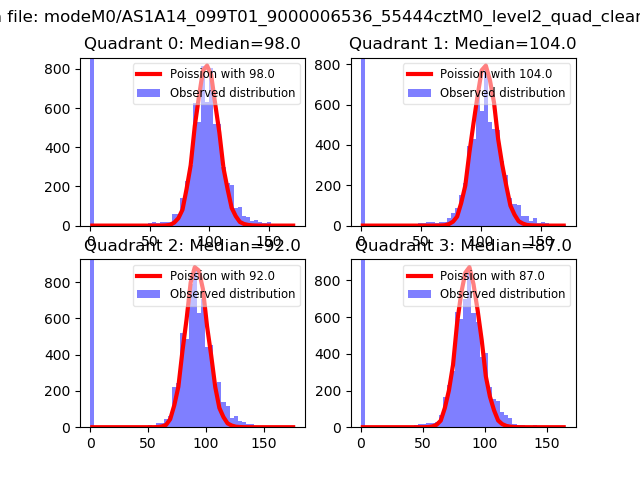 |
 |
| Quadrant-wise count rates Data is divided into 100 sec bins |
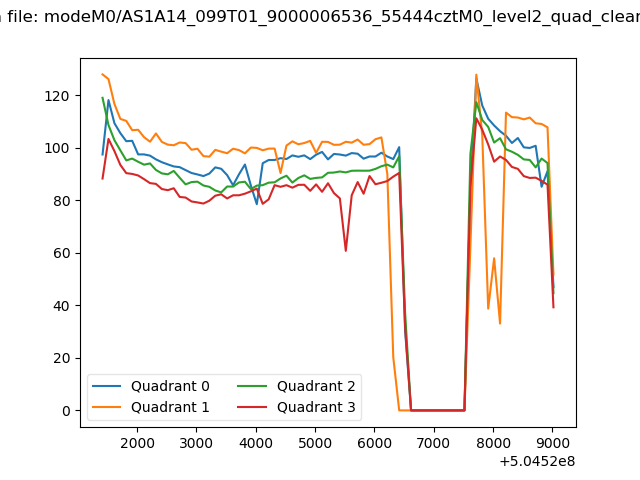 |
|
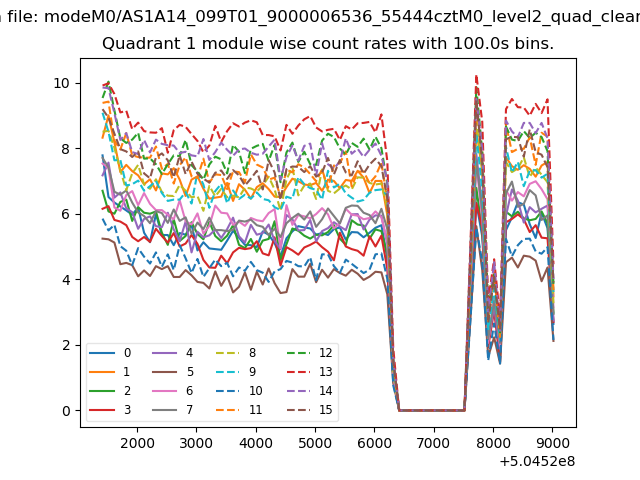
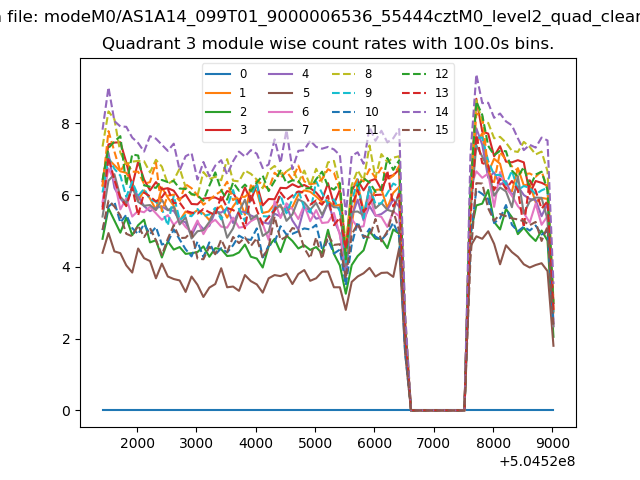
| Module-wise count rates for Quadrant A Data is divided into 100 sec bins |
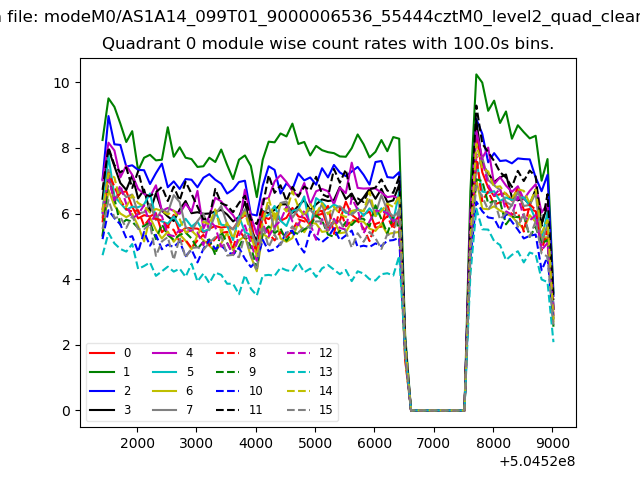 |
 |
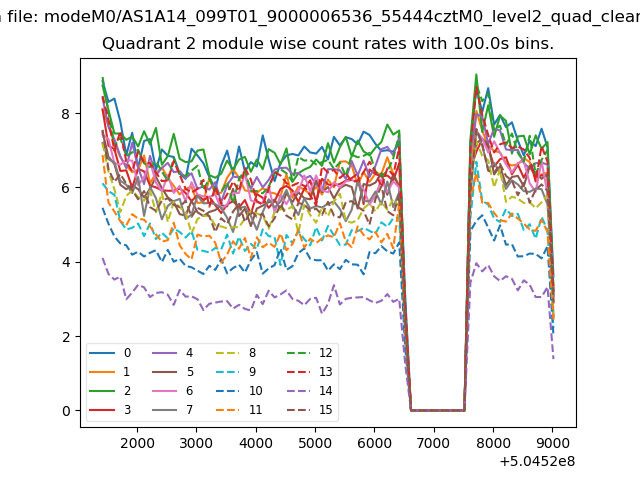
| Module-wise count rates for Quadrant B Data is divided into 100 sec bins |
 |
 |
| Module-wise count rates for Quadrant C Data is divided into 100 sec bins |
 |
 |
| Module-wise count rates for Quadrant D Data is divided into 100 sec bins |
 |
 |
| Parameter | Plot |
|---|---|
| CZT HV Monitor | 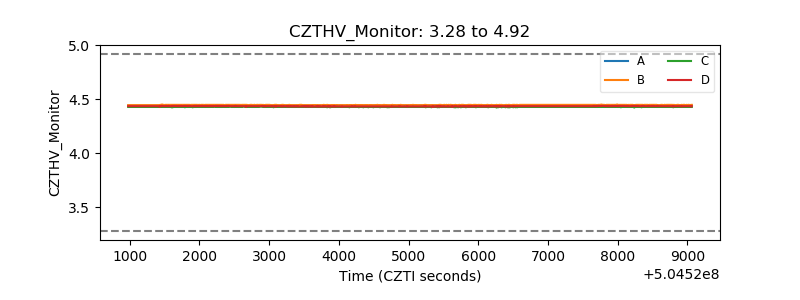 |
| D_VDD | 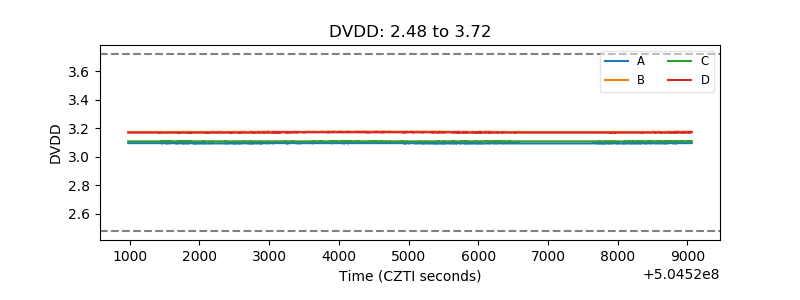 |
| Temperature 1 | 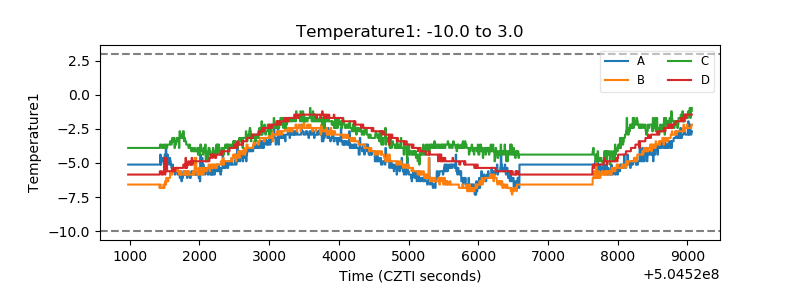 |
| Veto HV Monitor | 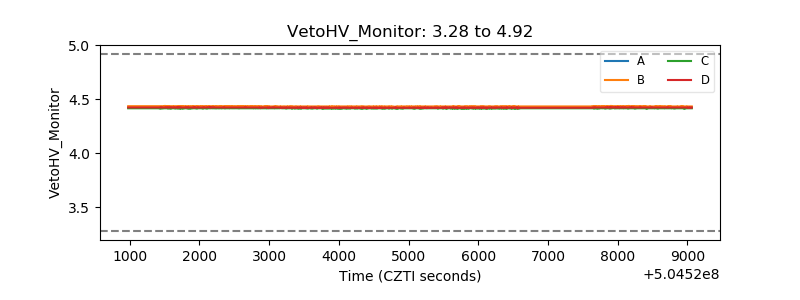 |
| Veto LLD | 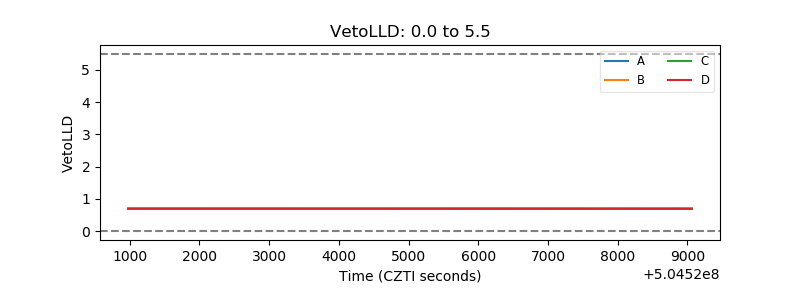 |
| Alpha Counter | 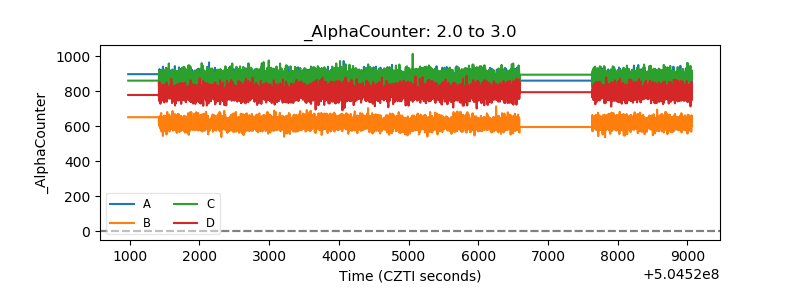 |
| _CPM_Rate | 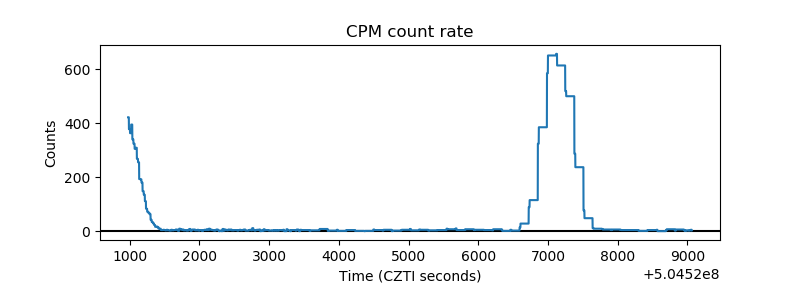 |
| CZT Counter | 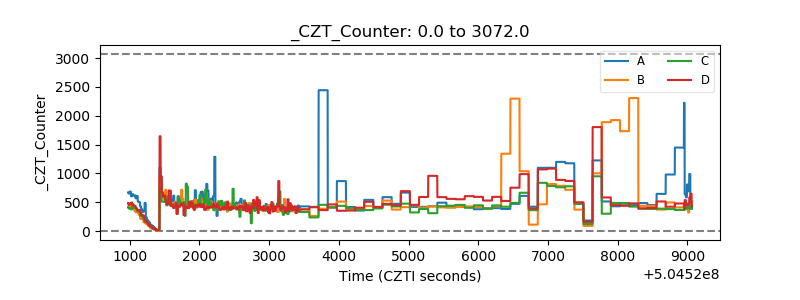 |
| +2.5 Volts monitor |  |
| +5 Volts monitor |  |
| _ROLL_ROT | 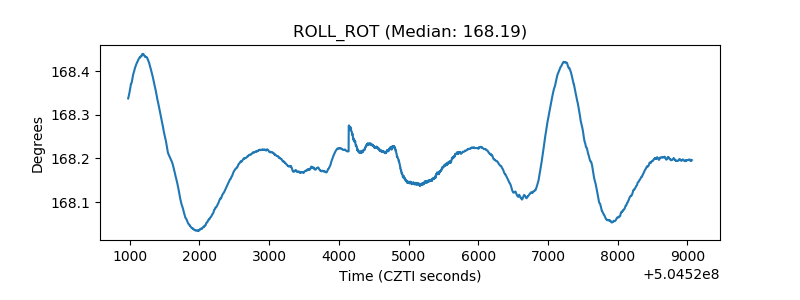 |
| _Roll_DEC | 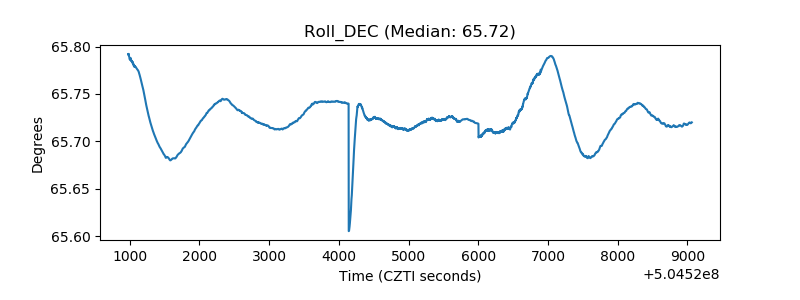 |
| _Roll_RA | 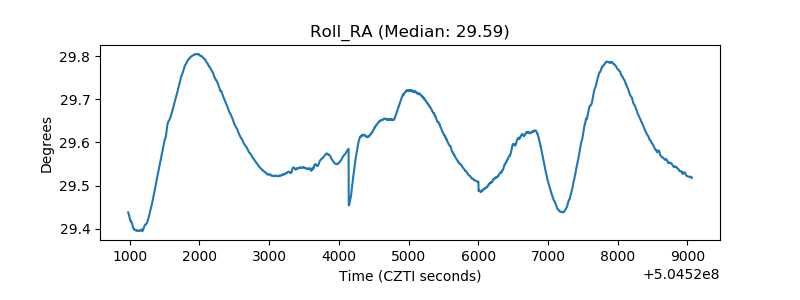 |
| Veto Counter | 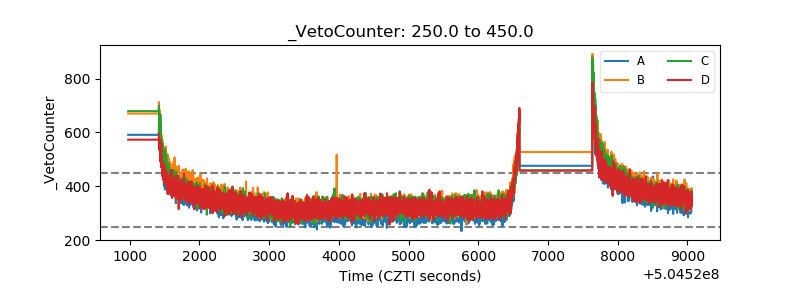 |