| Param | Original file | Final file |
|---|---|---|
| Filename | modeM0/AS1A14_099T01_9000006536_55445cztM0_level2.fits | modeM0/AS1A14_099T01_9000006536_55445cztM0_level2_quad_clean.evt |
| Size (bytes) | 304,830,720 | 70,407,360 |
| Size | 290.7 MB | 67.1 MB |
| Events in quadrant A | 2,562,674 | 467,326 |
| Events in quadrant B | 2,251,541 | 491,350 |
| Events in quadrant C | 2,730,011 | 433,838 |
| Events in quadrant D | 3,372,926 | 409,486 |
| Mode M9 | |||
|---|---|---|---|
| Quadrant | BADHDUFLAG | Total packets | Discarded packets |
| A | 0 | 11 | 0 |
| B | 0 | 11 | 0 |
| C | 0 | 11 | 0 |
| D | 0 | 11 | 0 |
| Mode SS | |||
|---|---|---|---|
| Quadrant | BADHDUFLAG | Total packets | Discarded packets |
| A | 0 | 98 | 2 |
| B | 0 | 97 | 1 |
| C | 0 | 98 | 2 |
| D | 0 | 98 | 2 |
| Mode M0 | |||
|---|---|---|---|
| Quadrant | BADHDUFLAG | Total packets | Discarded packets |
| A | 0 | 11101 | 221 |
| B | 0 | 10549 | 379 |
| C | 0 | 11877 | 173 |
| D | 0 | 13573 | 278 |
| Quadrant | Total seconds | Saturated seconds | Saturation percentage |
|---|---|---|---|
| A | 4694 | 134 | 2.854708% |
| B | 4688 | 179 | 3.818259% |
| C | 4706 | 217 | 4.611135% |
| D | 4695 | 240 | 5.111821% |
Noise dominated data is calculated using 1-second bins in cleaned event files. If a bin has >2000 counts, and if more than 50% of those come from <1% of pixels, then it is considered to be noise-dominated and hence unusable.
| Quadrant | # 1 sec bins | Bins with >0 counts | Bins with >2000 counts | High rate bins dominated by noise | Noise dominated (total time) | Noise dominated (detector-on time) | Marked lightcurve |
|---|---|---|---|---|---|---|---|
| A | 7130 | 4708 | 20 | 20 | 0.28% | 0.42% | 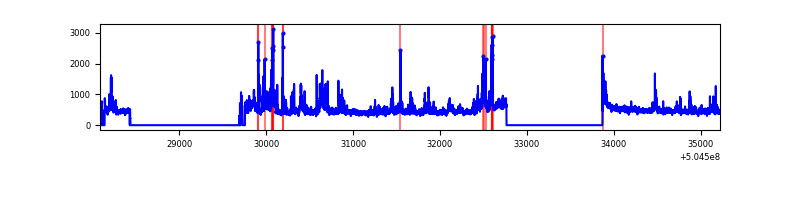 |
| B | 7118 | 4702 | 51 | 51 | 0.72% | 1.08% | 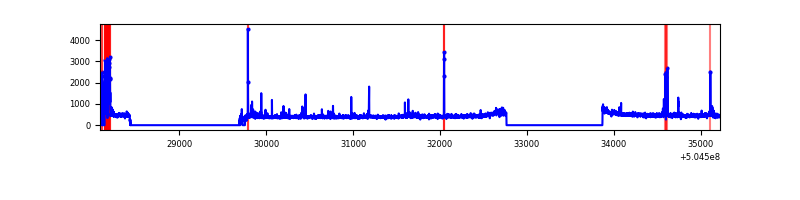 |
| C | 7138 | 4730 | 122 | 122 | 1.71% | 2.58% | 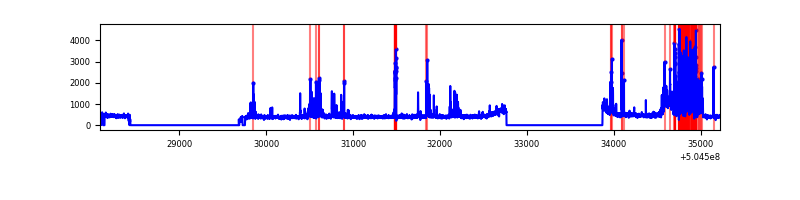 |
| D | 7134 | 4712 | 134 | 134 | 1.88% | 2.84% | 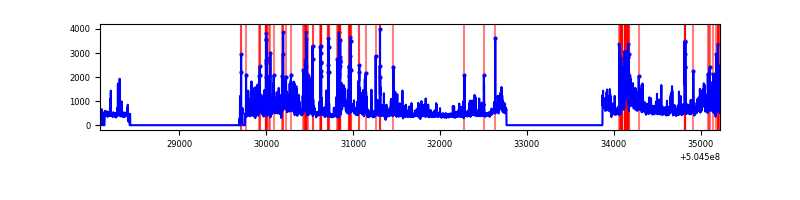 |
Top three noisy pixels from each quadrant. If the there are fewer than three noisy pixels in the level2.evt file, extra rows are filled as -1
| Pixel properties | Quadrant properties | ||||||
|---|---|---|---|---|---|---|---|
| Quadrant | DetID | PixID | Counts | Sigma | Mean | Median | Sigma |
| A | 4 | 159 | 334281 | 2604.3 | 516 | 502 | 128.2 |
| A | 3 | 78 | 146247 | 1137.17 | 516 | 502 | 128.2 |
| A | 12 | 115 | 59930 | 463.68 | 516 | 502 | 128.2 |
| B | 12 | 32 | 130802 | 1210.82 | 503 | 484 | 107.6 |
| B | 5 | 172 | 43008 | 395.1 | 503 | 484 | 107.6 |
| B | 10 | 247 | 22902 | 208.29 | 503 | 484 | 107.6 |
| C | 13 | 3 | 710157 | 5189.05 | 499 | 492 | 136.8 |
| C | 12 | 252 | 47209 | 341.59 | 499 | 492 | 136.8 |
| C | 14 | 254 | 15601 | 110.48 | 499 | 492 | 136.8 |
| D | 11 | 129 | 632373 | 4409.3 | 497 | 474 | 143.3 |
| D | 15 | 125 | 412180 | 2872.82 | 497 | 474 | 143.3 |
| D | 2 | 249 | 121587 | 845.11 | 497 | 474 | 143.3 |
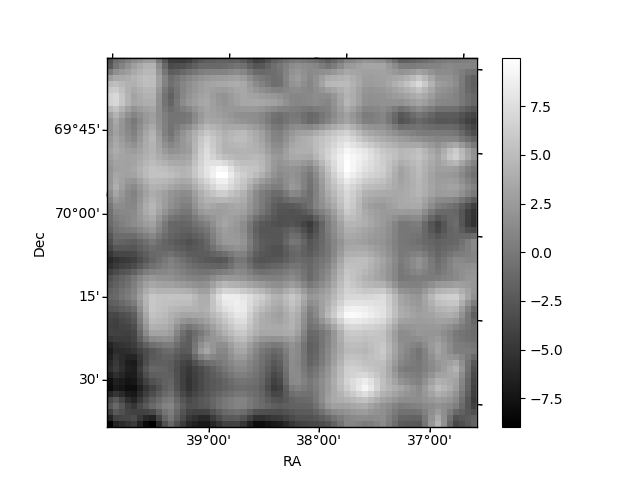
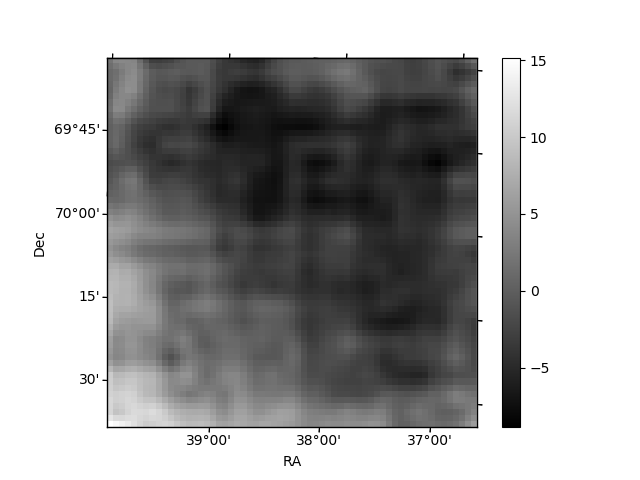
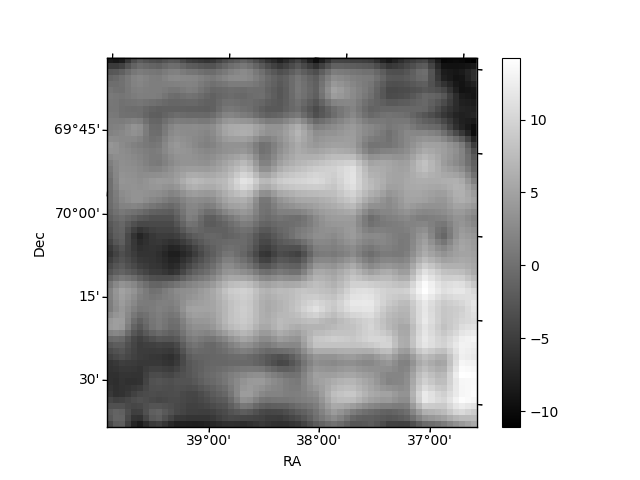
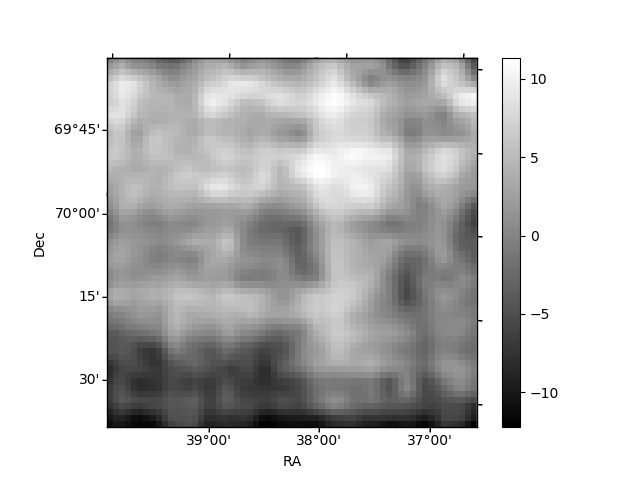
Histogram calculated using DETX and DETY for each event in the final _common_clean file
| Quadrant A | 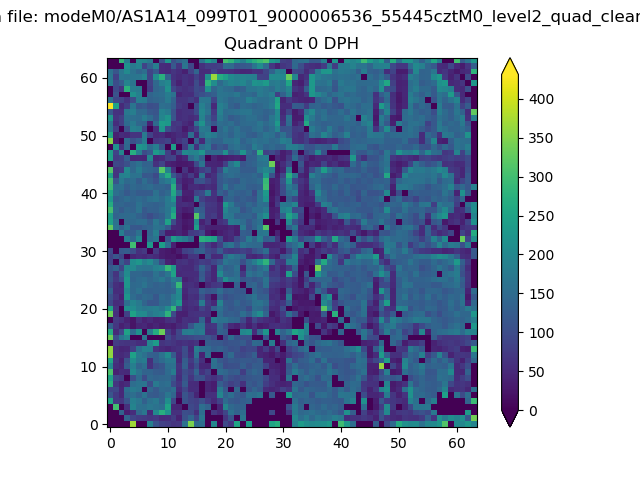 |
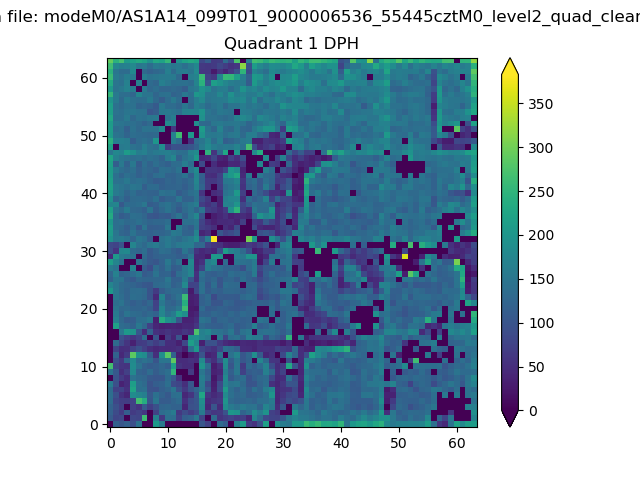 |
Quadrant B |
|---|---|---|---|
| Quadrant D | 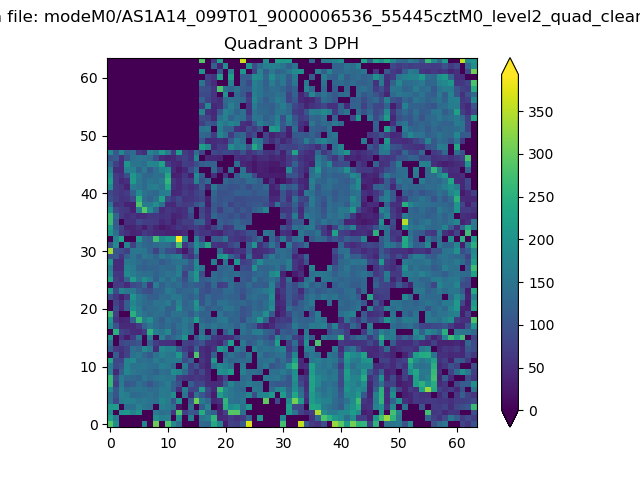 |
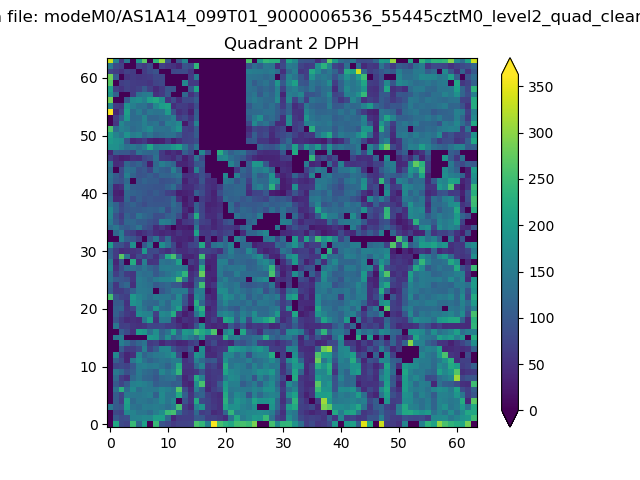 |
Quadrant C |
| Plot type | Count rate plots | Images |
|---|---|---|
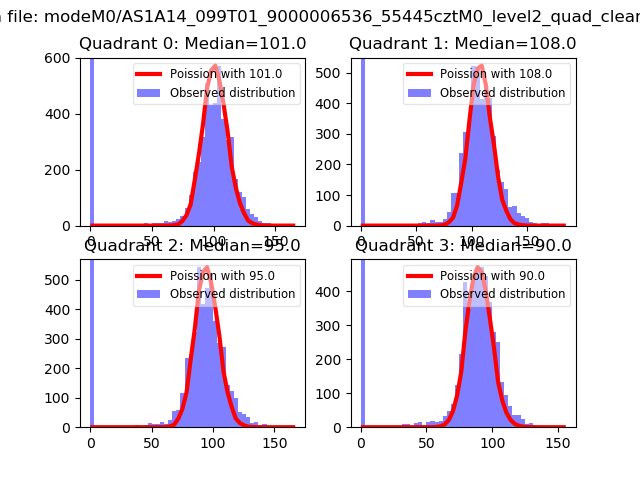
| Comparison with Poisson distribution Blue bars denote a histogram of data divided into 1 sec bins. Red curve is a Poisson curve with rate = median count rate of data. |
 |
 |
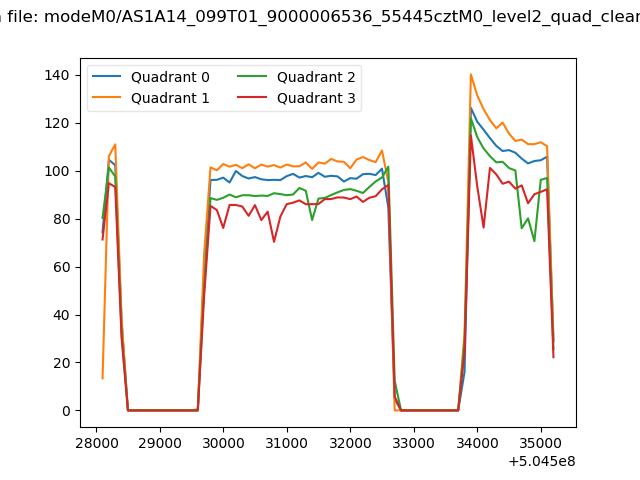
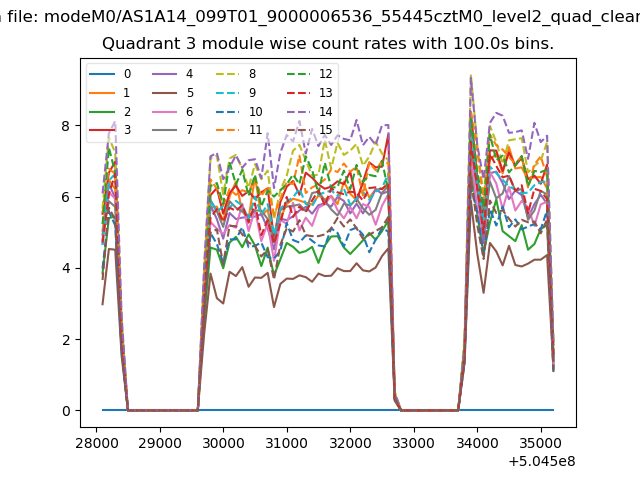
| Quadrant-wise count rates Data is divided into 100 sec bins |
 |
|
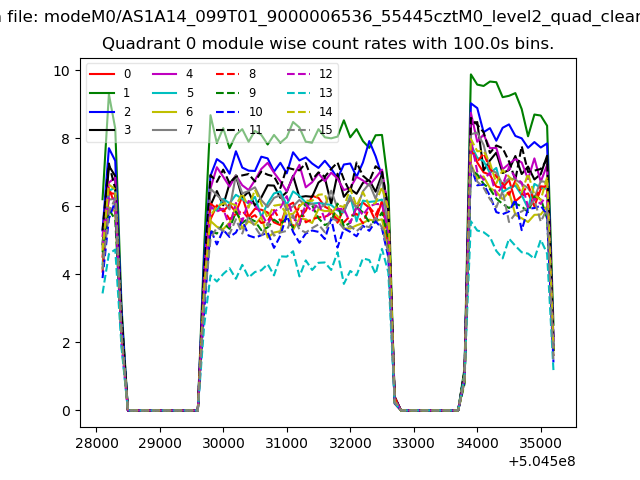
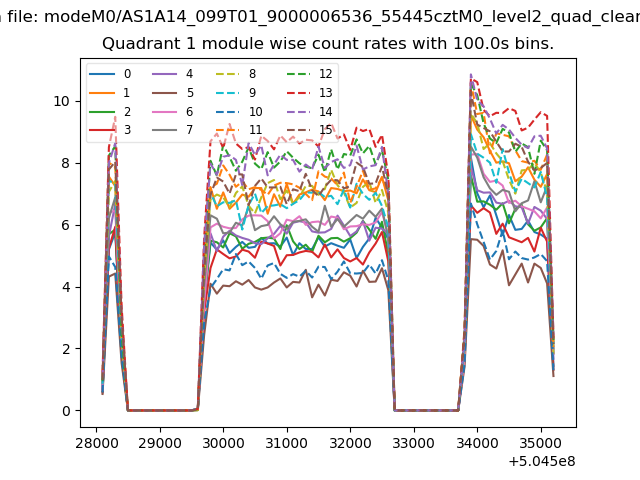
| Module-wise count rates for Quadrant A Data is divided into 100 sec bins |
 |
 |
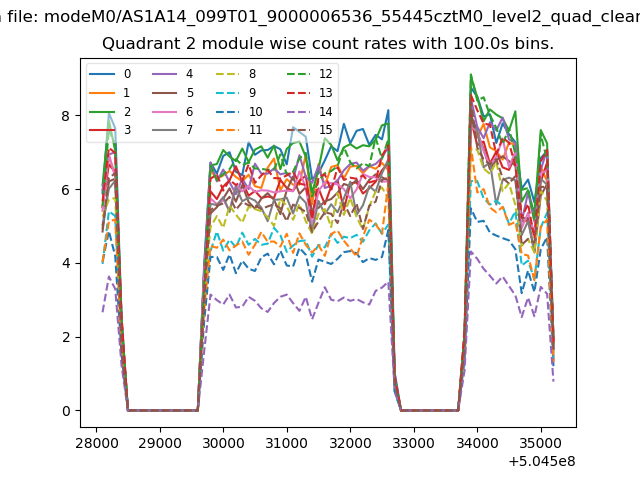
| Module-wise count rates for Quadrant B Data is divided into 100 sec bins |
 |
 |
| Module-wise count rates for Quadrant C Data is divided into 100 sec bins |
 |
 |
| Module-wise count rates for Quadrant D Data is divided into 100 sec bins |
 |
 |
| Parameter | Plot |
|---|---|
| CZT HV Monitor | 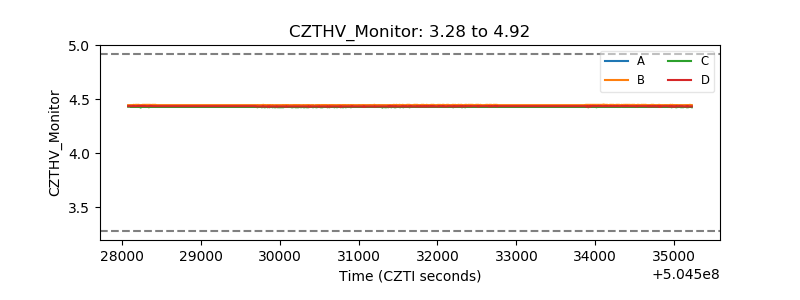 |
| D_VDD | 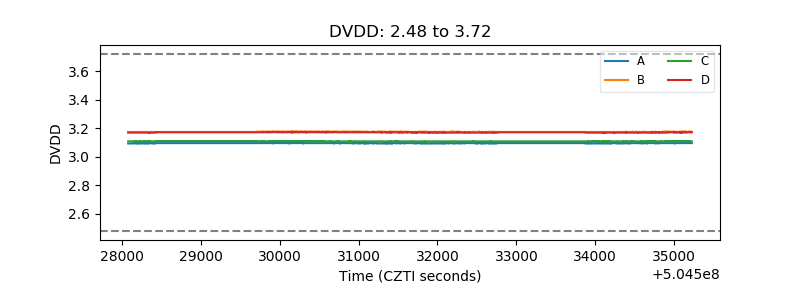 |
| Temperature 1 | 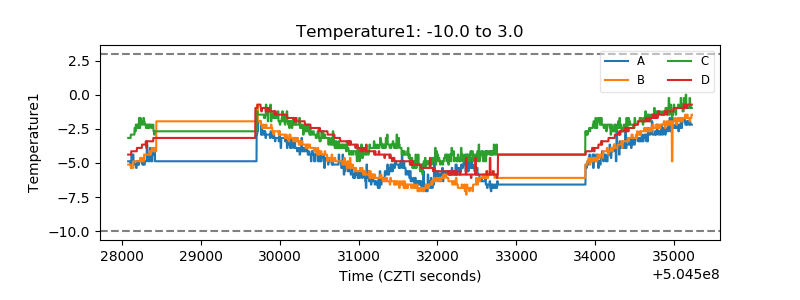 |
| Veto HV Monitor | 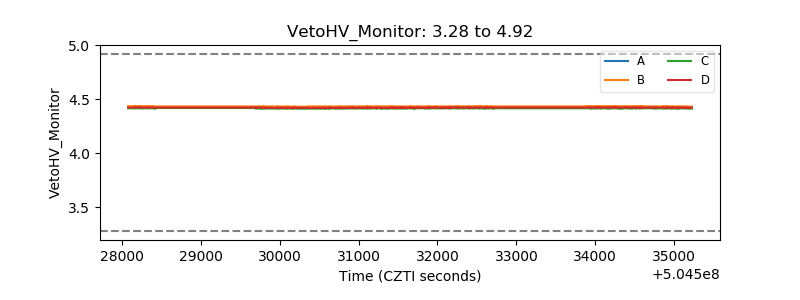 |
| Veto LLD | 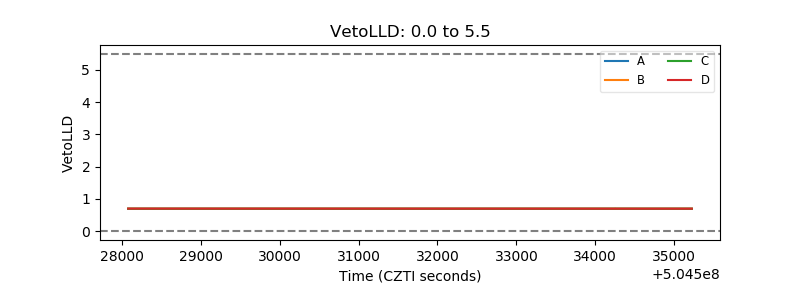 |
| Alpha Counter | 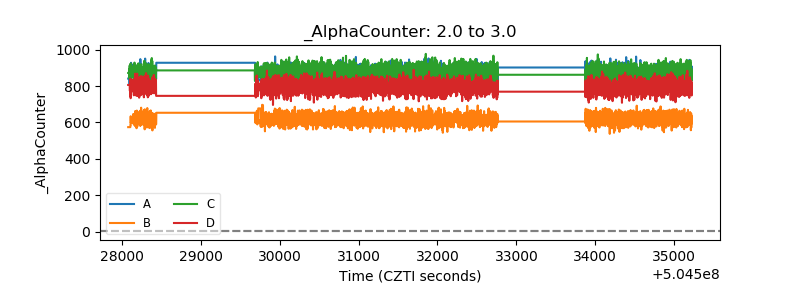 |
| _CPM_Rate | 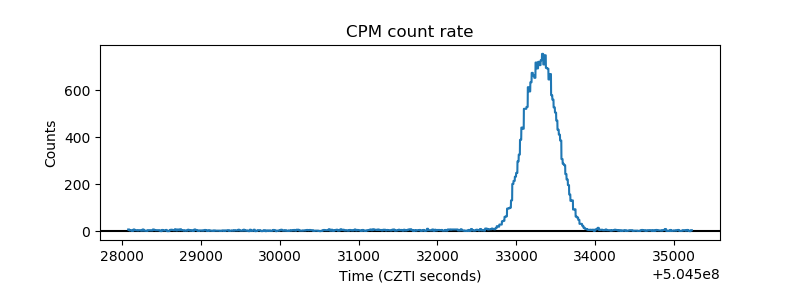 |
| CZT Counter | 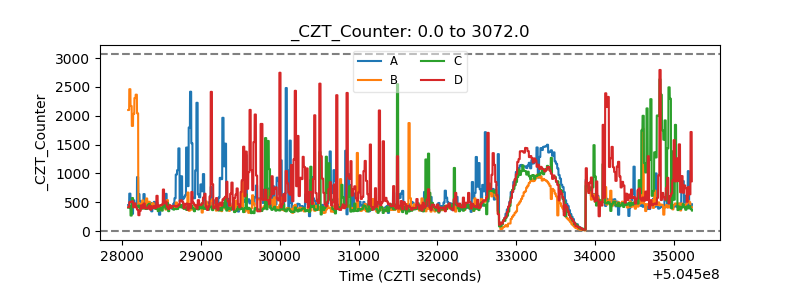 |
| +2.5 Volts monitor |  |
| +5 Volts monitor | 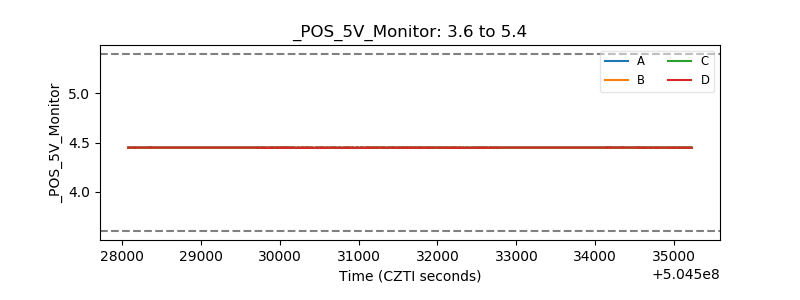 |
| _ROLL_ROT | 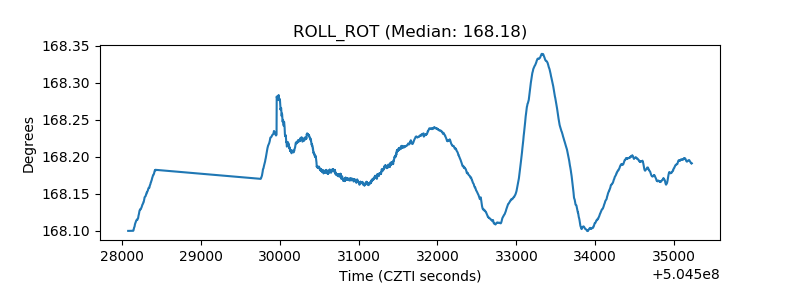 |
| _Roll_DEC | 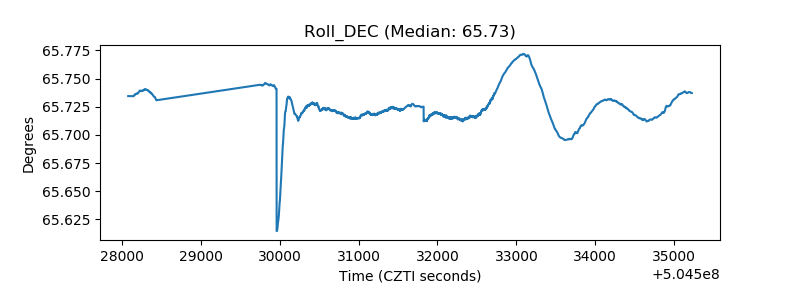 |
| _Roll_RA | 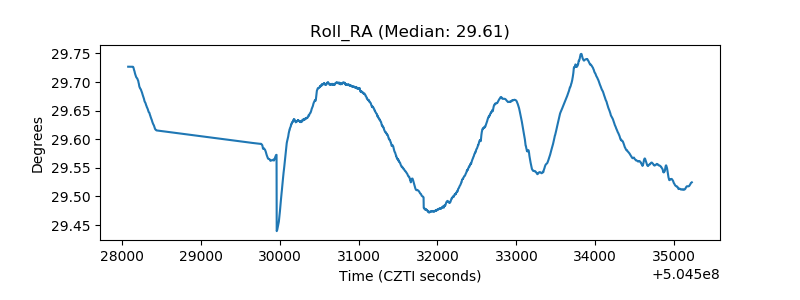 |
| Veto Counter |  |