| Param | Original file | Final file |
|---|---|---|
| Filename | modeM0/AS1A14_099T01_9000006536_55446cztM0_level2.fits | modeM0/AS1A14_099T01_9000006536_55446cztM0_level2_quad_clean.evt |
| Size (bytes) | 433,229,760 | 95,181,120 |
| Size | 413.2 MB | 90.8 MB |
| Events in quadrant A | 4,234,383 | 621,706 |
| Events in quadrant B | 2,957,466 | 677,696 |
| Events in quadrant C | 3,418,968 | 595,478 |
| Events in quadrant D | 4,931,272 | 543,826 |
| Mode M9 | |||
|---|---|---|---|
| Quadrant | BADHDUFLAG | Total packets | Discarded packets |
| A | 0 | 12 | 0 |
| B | 0 | 12 | 0 |
| C | 0 | 12 | 0 |
| D | 0 | 12 | 0 |
| Mode SS | |||
|---|---|---|---|
| Quadrant | BADHDUFLAG | Total packets | Discarded packets |
| A | 0 | 128 | 0 |
| B | 0 | 128 | 0 |
| C | 0 | 128 | 0 |
| D | 0 | 128 | 0 |
| Mode M0 | |||
|---|---|---|---|
| Quadrant | BADHDUFLAG | Total packets | Discarded packets |
| A | 0 | 17025 | 13 |
| B | 0 | 13457 | 14 |
| C | 0 | 14924 | 11 |
| D | 0 | 19065 | 51 |
| Quadrant | Total seconds | Saturated seconds | Saturation percentage |
|---|---|---|---|
| A | 6359 | 346 | 5.441107% |
| B | 6358 | 142 | 2.233407% |
| C | 6359 | 206 | 3.239503% |
| D | 6351 | 494 | 7.778303% |
Noise dominated data is calculated using 1-second bins in cleaned event files. If a bin has >2000 counts, and if more than 50% of those come from <1% of pixels, then it is considered to be noise-dominated and hence unusable.
| Quadrant | # 1 sec bins | Bins with >0 counts | Bins with >2000 counts | High rate bins dominated by noise | Noise dominated (total time) | Noise dominated (detector-on time) | Marked lightcurve |
|---|---|---|---|---|---|---|---|
| A | 7499 | 6364 | 244 | 244 | 3.25% | 3.83% | 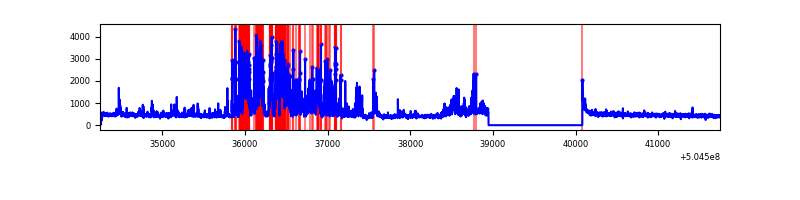 |
| B | 7499 | 6364 | 12 | 12 | 0.16% | 0.19% | 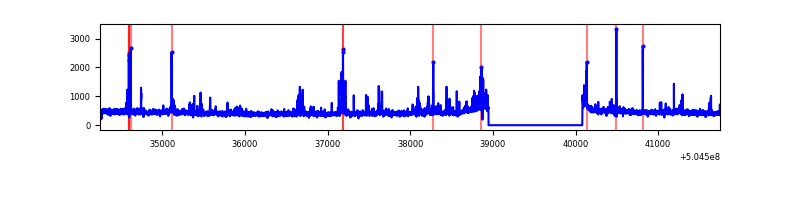 |
| C | 7499 | 6365 | 127 | 127 | 1.69% | 2.00% | 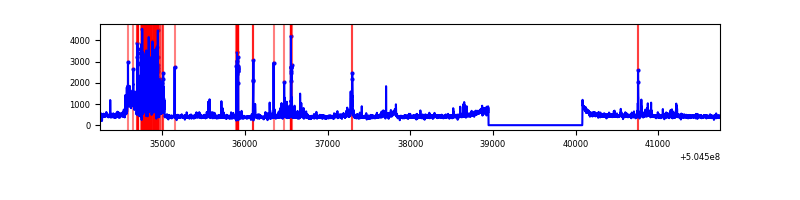 |
| D | 7494 | 6355 | 395 | 395 | 5.27% | 6.22% | 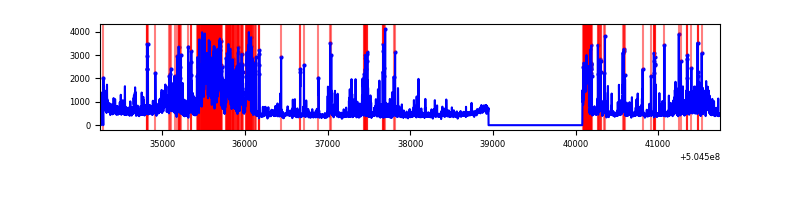 |
Top three noisy pixels from each quadrant. If the there are fewer than three noisy pixels in the level2.evt file, extra rows are filled as -1
| Pixel properties | Quadrant properties | ||||||
|---|---|---|---|---|---|---|---|
| Quadrant | DetID | PixID | Counts | Sigma | Mean | Median | Sigma |
| A | 3 | 78 | 1285414 | 7545.02 | 688 | 669 | 170.3 |
| A | 4 | 159 | 252732 | 1480.31 | 688 | 669 | 170.3 |
| A | 4 | 3 | 14402 | 80.65 | 688 | 669 | 170.3 |
| B | 12 | 32 | 54235 | 370.47 | 682 | 656 | 144.6 |
| B | 7 | 252 | 54006 | 368.89 | 682 | 656 | 144.6 |
| B | 5 | 172 | 44930 | 306.13 | 682 | 656 | 144.6 |
| C | 13 | 3 | 697621 | 3812.88 | 669 | 661 | 182.8 |
| C | 15 | 147 | 51422 | 277.7 | 669 | 661 | 182.8 |
| C | 9 | 38 | 23380 | 124.29 | 669 | 661 | 182.8 |
| D | 15 | 125 | 1098562 | 5949.55 | 656 | 630 | 184.5 |
| D | 11 | 129 | 269422 | 1456.55 | 656 | 630 | 184.5 |
| D | 2 | 249 | 257155 | 1390.07 | 656 | 630 | 184.5 |
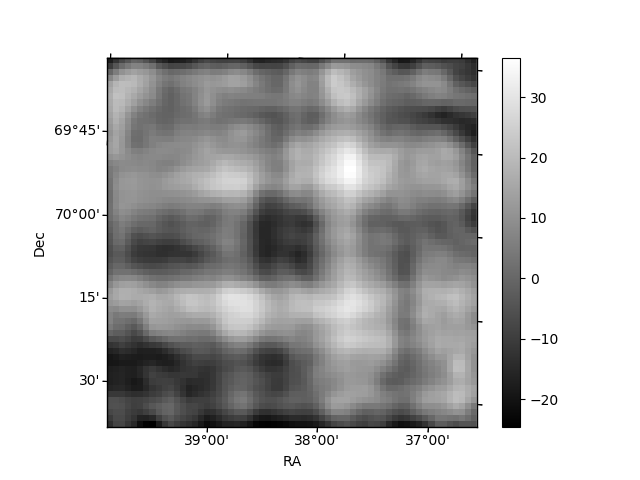
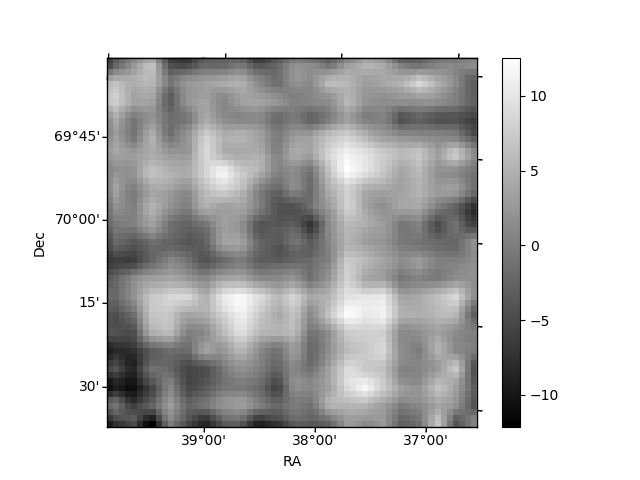
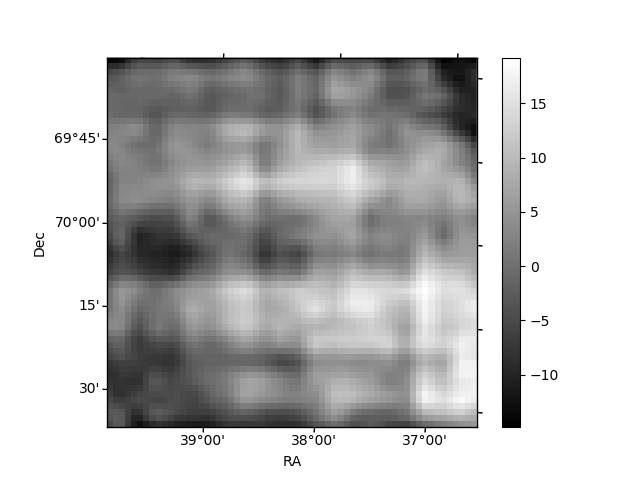
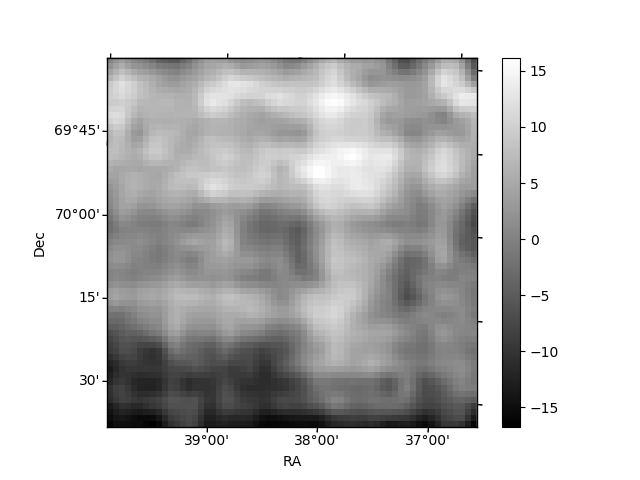
Histogram calculated using DETX and DETY for each event in the final _common_clean file
| Quadrant A | 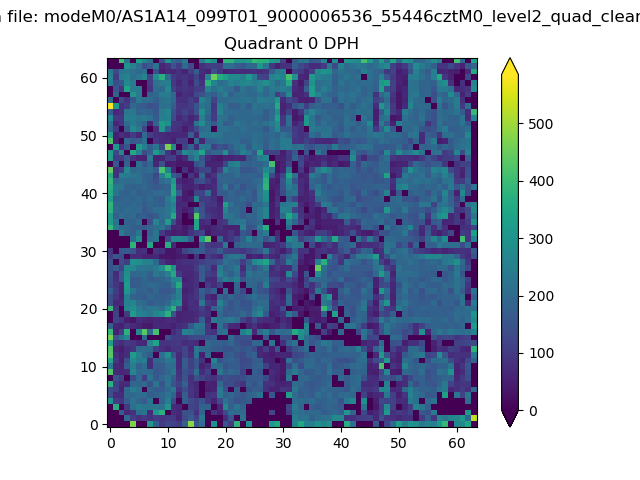 |
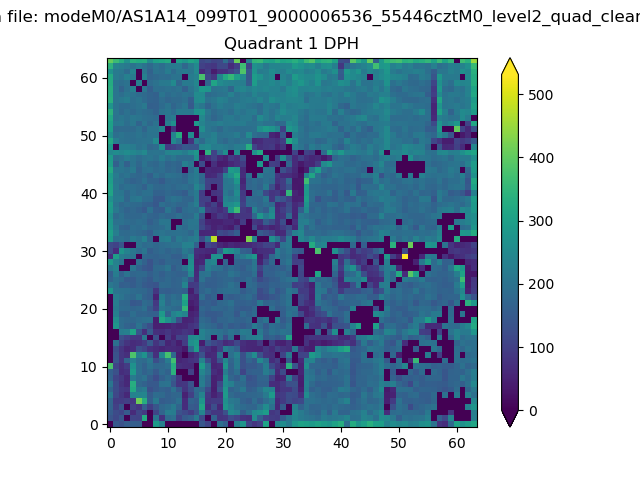 |
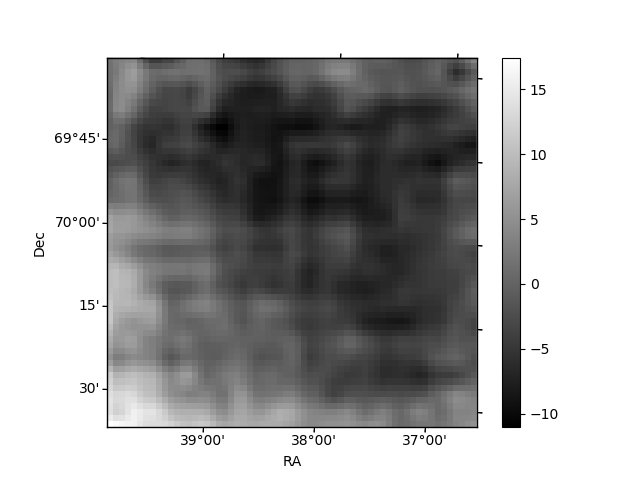
Quadrant B |
|---|---|---|---|
| Quadrant D | 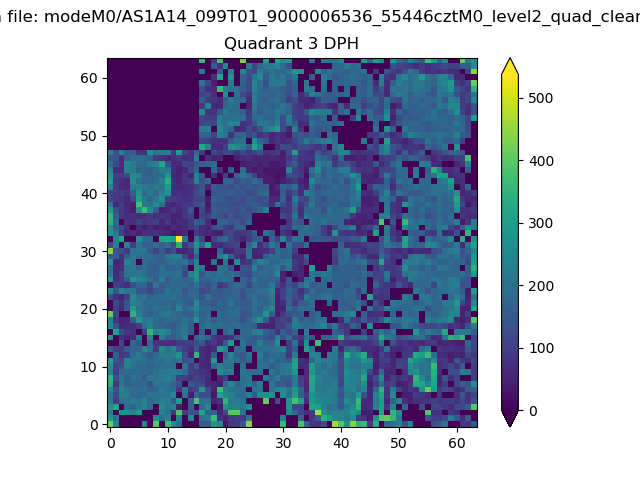 |
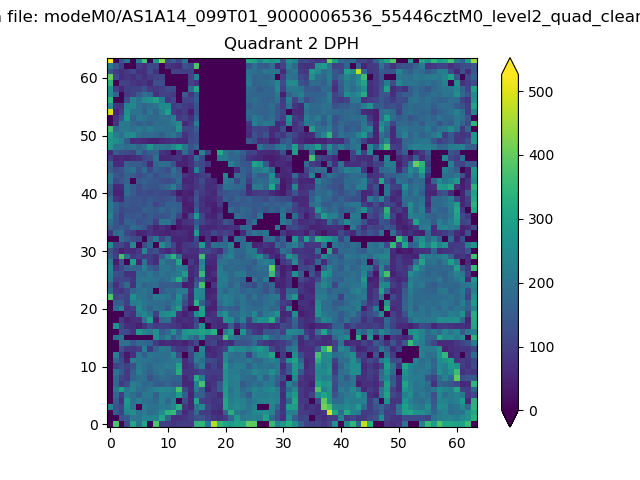 |
Quadrant C |
| Plot type | Count rate plots | Images |
|---|---|---|
| Comparison with Poisson distribution Blue bars denote a histogram of data divided into 1 sec bins. Red curve is a Poisson curve with rate = median count rate of data. |
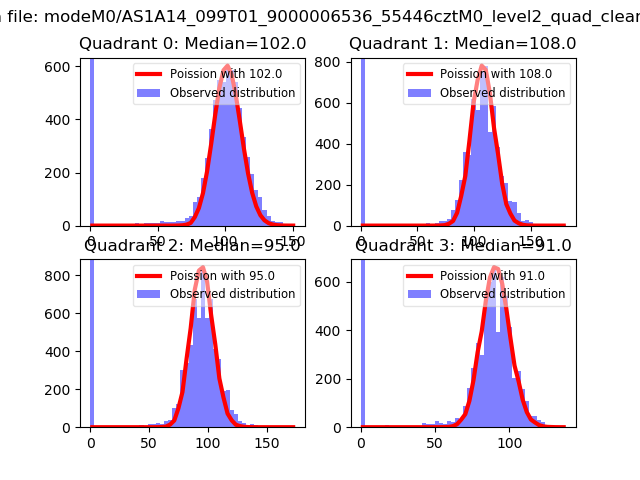 |
 |
| Quadrant-wise count rates Data is divided into 100 sec bins |
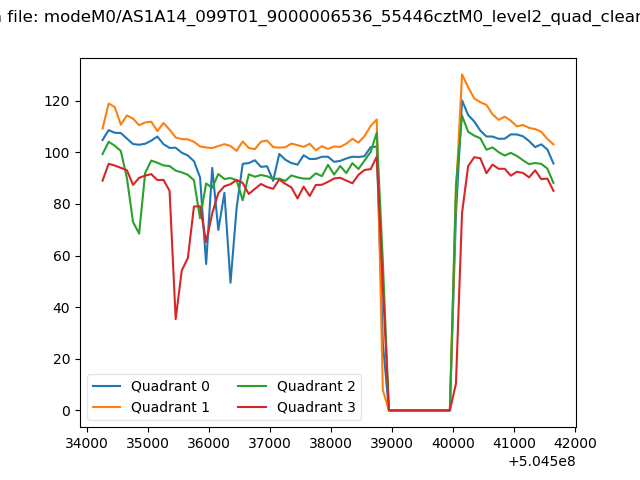 |
|
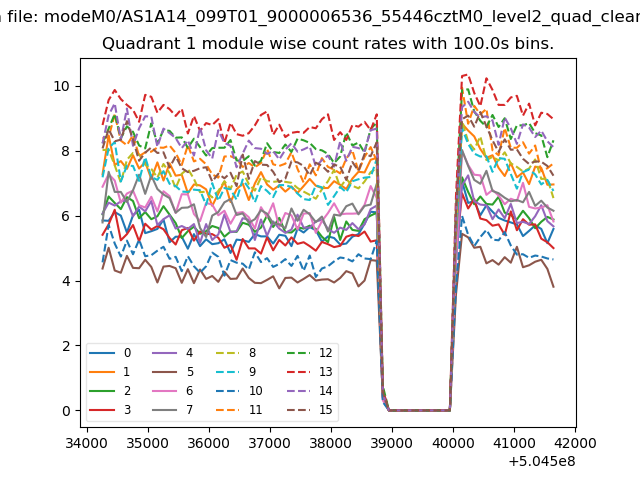
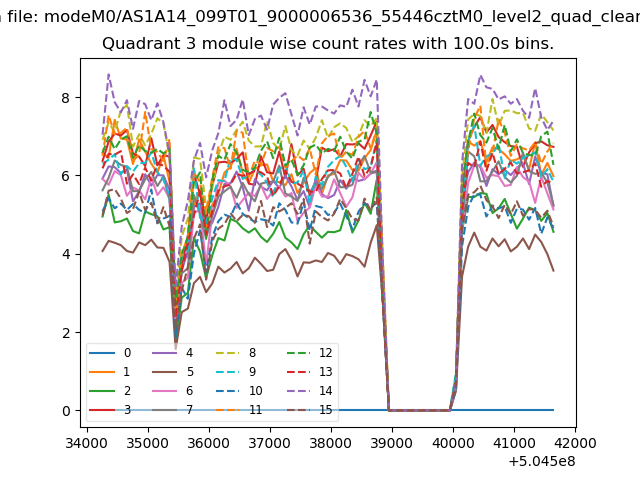
| Module-wise count rates for Quadrant A Data is divided into 100 sec bins |
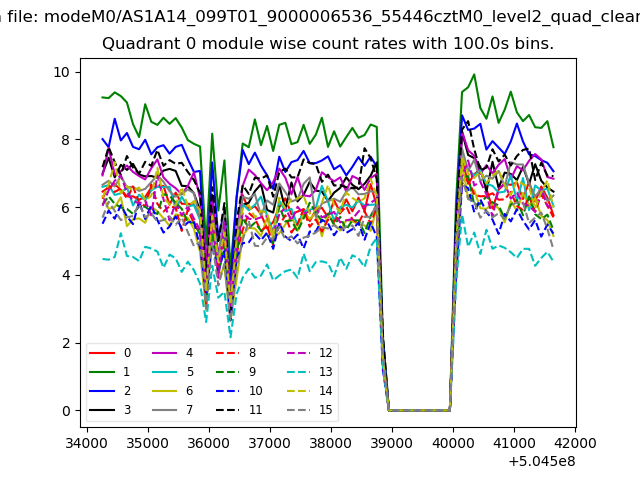 |
 |
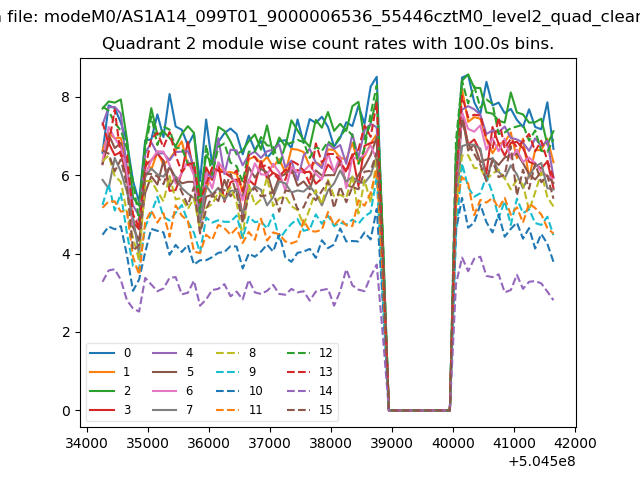
| Module-wise count rates for Quadrant B Data is divided into 100 sec bins |
 |
 |
| Module-wise count rates for Quadrant C Data is divided into 100 sec bins |
 |
 |
| Module-wise count rates for Quadrant D Data is divided into 100 sec bins |
 |
 |
| Parameter | Plot |
|---|---|
| CZT HV Monitor | 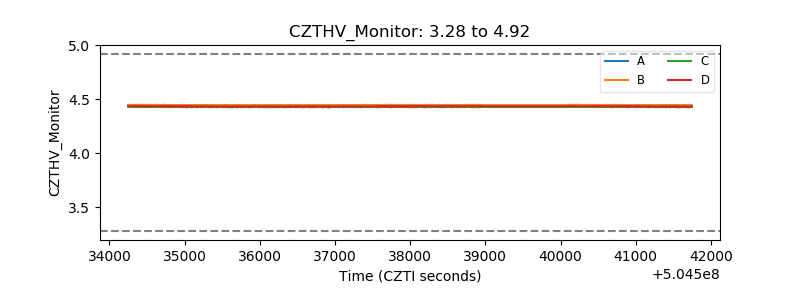 |
| D_VDD | 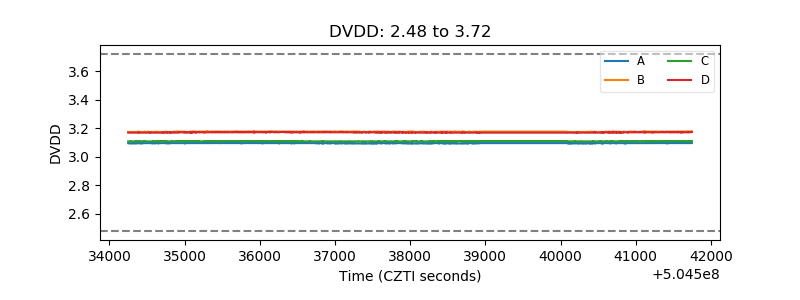 |
| Temperature 1 | 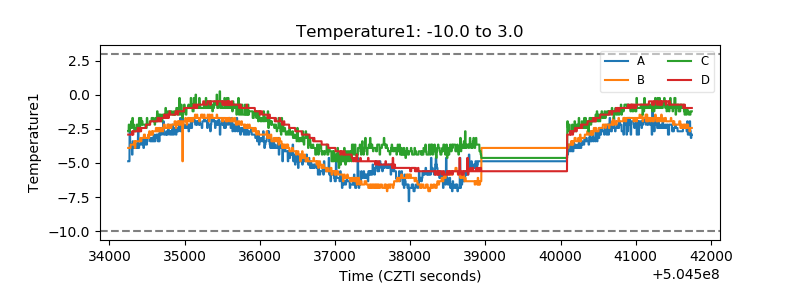 |
| Veto HV Monitor | 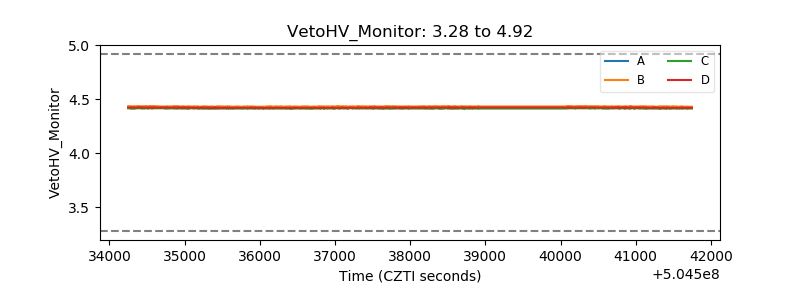 |
| Veto LLD | 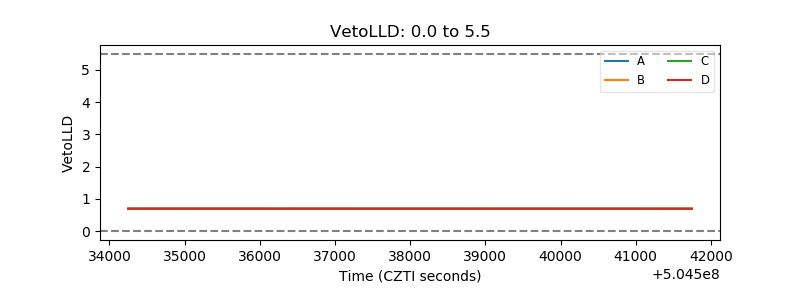 |
| Alpha Counter | 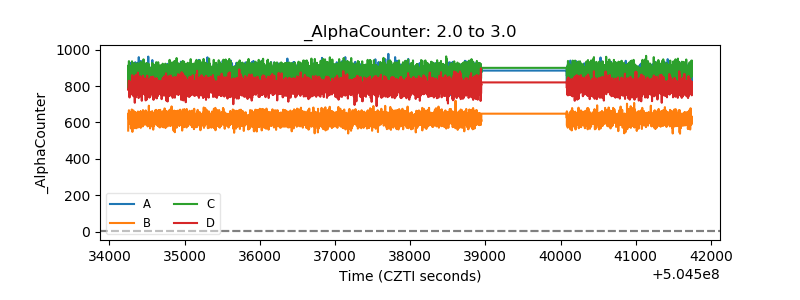 |
| _CPM_Rate | 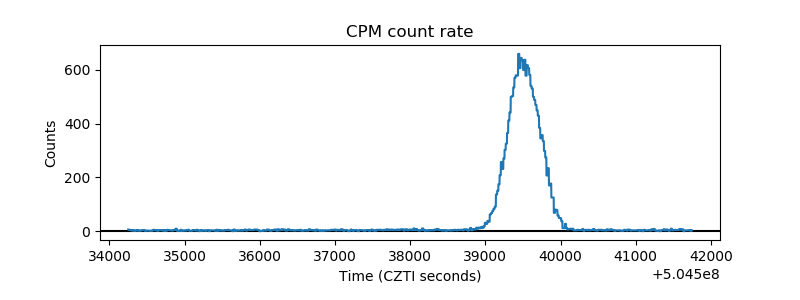 |
| CZT Counter | 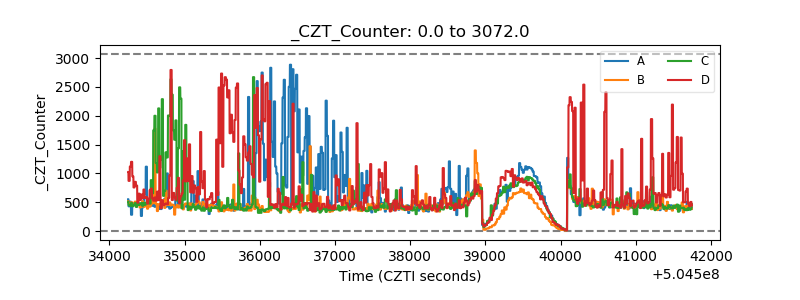 |
| +2.5 Volts monitor | 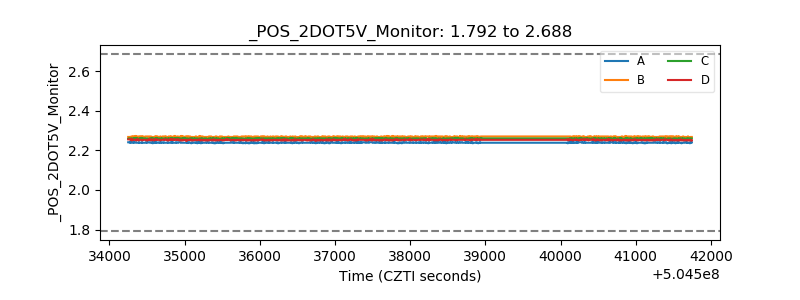 |
| +5 Volts monitor |  |
| _ROLL_ROT | 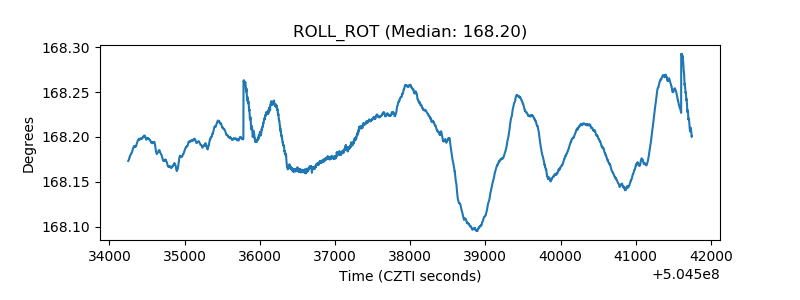 |
| _Roll_DEC | 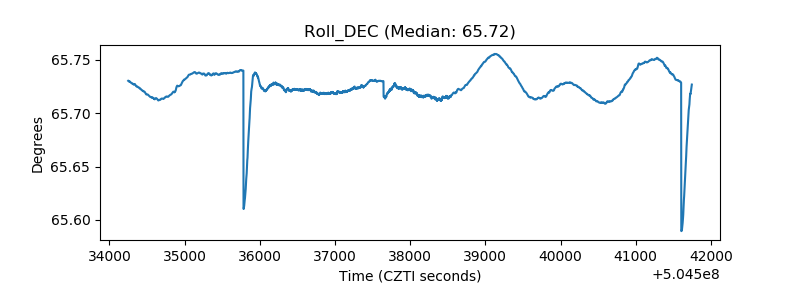 |
| _Roll_RA | 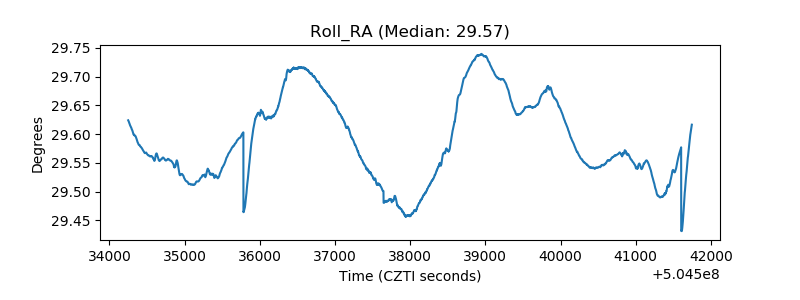 |
| Veto Counter | 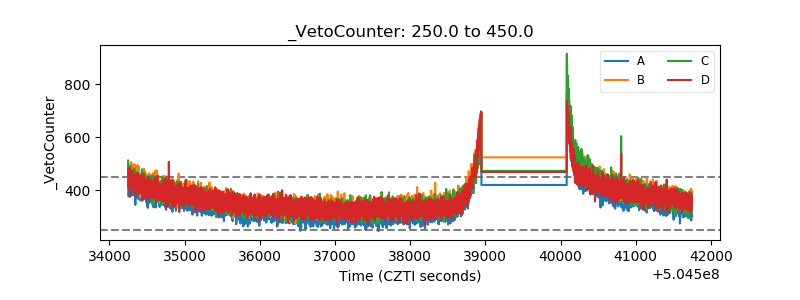 |