| Param | Original file | Final file |
|---|---|---|
| Filename | modeM0/AS1A14_099T01_9000006536_55447cztM0_level2.fits | modeM0/AS1A14_099T01_9000006536_55447cztM0_level2_quad_clean.evt |
| Size (bytes) | 371,871,360 | 92,802,240 |
| Size | 354.6 MB | 88.5 MB |
| Events in quadrant A | 3,017,265 | 616,097 |
| Events in quadrant B | 2,941,400 | 653,353 |
| Events in quadrant C | 2,786,720 | 581,029 |
| Events in quadrant D | 4,537,667 | 527,161 |
| Mode M9 | |||
|---|---|---|---|
| Quadrant | BADHDUFLAG | Total packets | Discarded packets |
| A | 0 | 11 | 0 |
| B | 0 | 11 | 0 |
| C | 0 | 11 | 0 |
| D | 0 | 11 | 0 |
| Mode SS | |||
|---|---|---|---|
| Quadrant | BADHDUFLAG | Total packets | Discarded packets |
| A | 0 | 126 | 0 |
| B | 0 | 126 | 0 |
| C | 0 | 126 | 0 |
| D | 0 | 126 | 0 |
| Mode M0 | |||
|---|---|---|---|
| Quadrant | BADHDUFLAG | Total packets | Discarded packets |
| A | 0 | 13559 | 1 |
| B | 0 | 13401 | 1 |
| C | 0 | 13125 | 1 |
| D | 0 | 17884 | 1 |
| Quadrant | Total seconds | Saturated seconds | Saturation percentage |
|---|---|---|---|
| A | 6193 | 118 | 1.905377% |
| B | 6193 | 129 | 2.082997% |
| C | 6194 | 71 | 1.146271% |
| D | 6194 | 414 | 6.683888% |
Noise dominated data is calculated using 1-second bins in cleaned event files. If a bin has >2000 counts, and if more than 50% of those come from <1% of pixels, then it is considered to be noise-dominated and hence unusable.
| Quadrant | # 1 sec bins | Bins with >0 counts | Bins with >2000 counts | High rate bins dominated by noise | Noise dominated (total time) | Noise dominated (detector-on time) | Marked lightcurve |
|---|---|---|---|---|---|---|---|
| A | 7308 | 6194 | 35 | 35 | 0.48% | 0.57% | 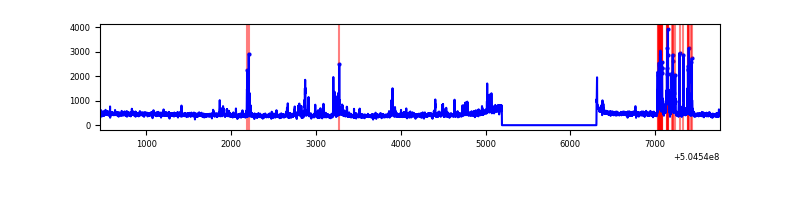 |
| B | 7308 | 6194 | 45 | 45 | 0.62% | 0.73% | 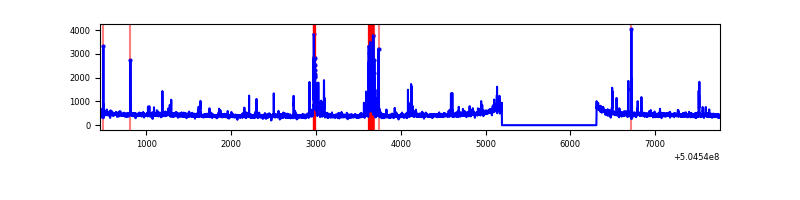 |
| C | 7309 | 6195 | 29 | 29 | 0.40% | 0.47% | 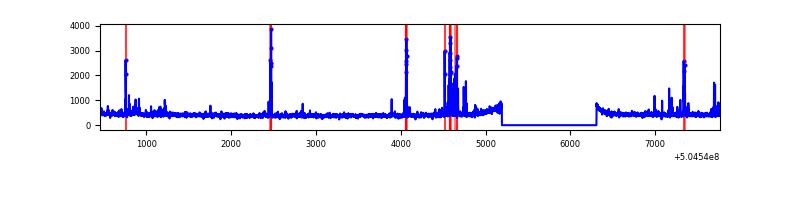 |
| D | 7308 | 6194 | 331 | 331 | 4.53% | 5.34% | 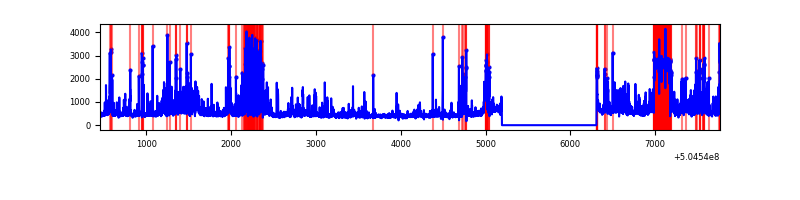 |
Top three noisy pixels from each quadrant. If the there are fewer than three noisy pixels in the level2.evt file, extra rows are filled as -1
| Pixel properties | Quadrant properties | ||||||
|---|---|---|---|---|---|---|---|
| Quadrant | DetID | PixID | Counts | Sigma | Mean | Median | Sigma |
| A | 3 | 78 | 174362 | 1049.55 | 668 | 652 | 165.5 |
| A | 0 | 8 | 130209 | 782.78 | 668 | 652 | 165.5 |
| A | 4 | 159 | 71583 | 428.56 | 668 | 652 | 165.5 |
| B | 12 | 32 | 135561 | 966.34 | 653 | 629 | 139.6 |
| B | 5 | 185 | 77861 | 553.11 | 653 | 629 | 139.6 |
| B | 10 | 247 | 31141 | 218.52 | 653 | 629 | 139.6 |
| C | 13 | 3 | 195031 | 1080.94 | 651 | 644 | 179.8 |
| C | 9 | 38 | 23716 | 128.3 | 651 | 644 | 179.8 |
| C | 12 | 252 | 10538 | 55.02 | 651 | 644 | 179.8 |
| D | 2 | 62 | 751258 | 4210.35 | 631 | 605 | 178.3 |
| D | 6 | 239 | 332409 | 1861.06 | 631 | 605 | 178.3 |
| D | 11 | 129 | 245285 | 1372.39 | 631 | 605 | 178.3 |
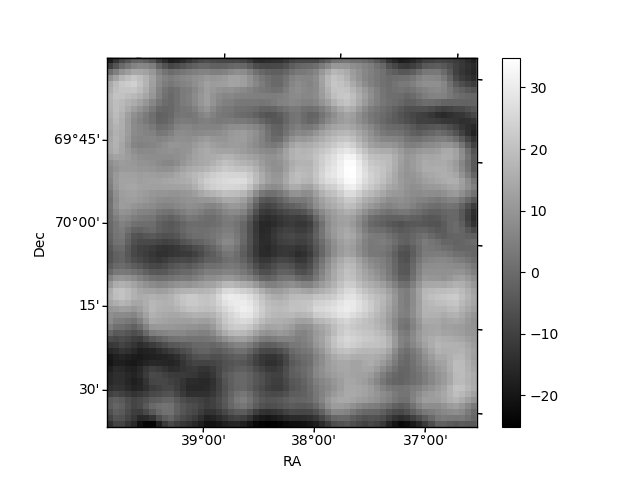
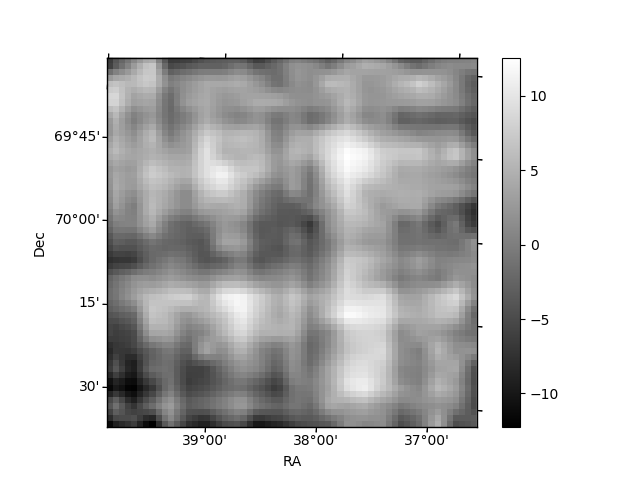
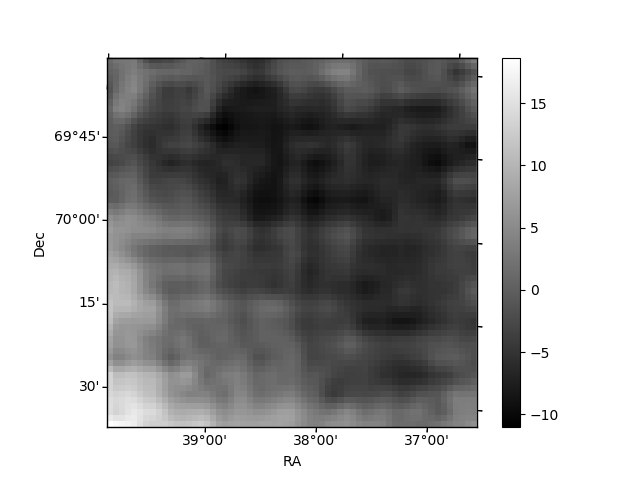
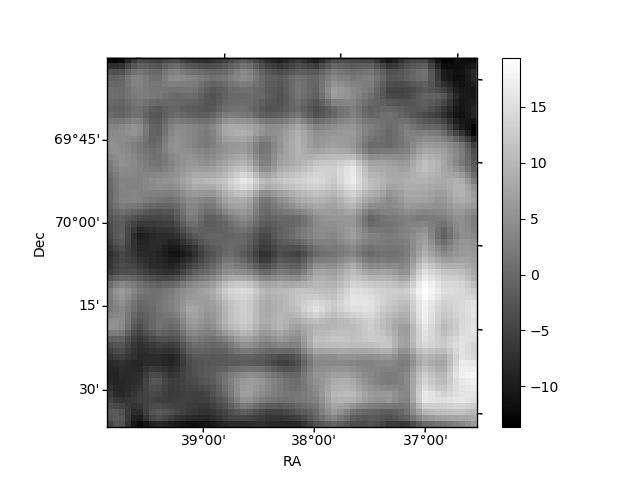
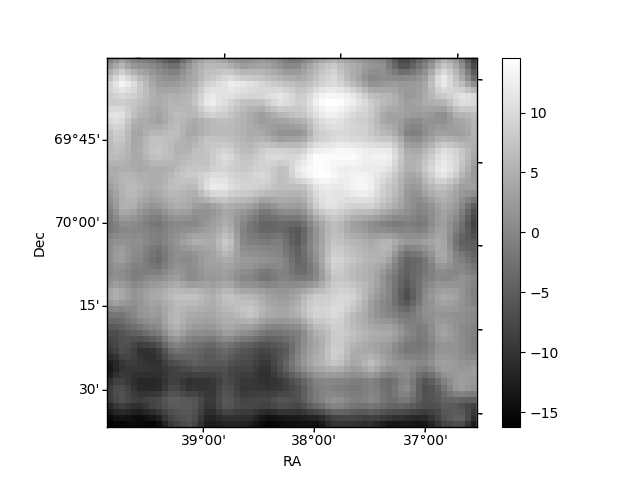
Histogram calculated using DETX and DETY for each event in the final _common_clean file
| Quadrant A | 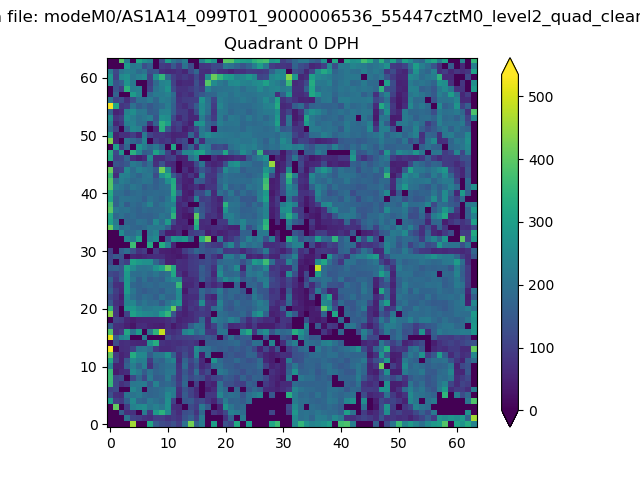 |
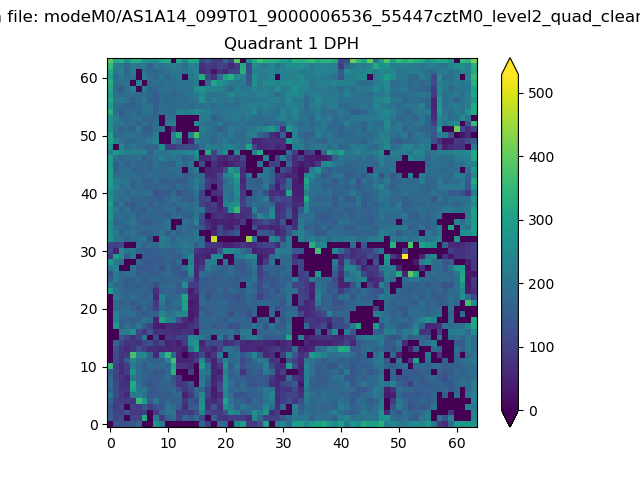 |
Quadrant B |
|---|---|---|---|
| Quadrant D | 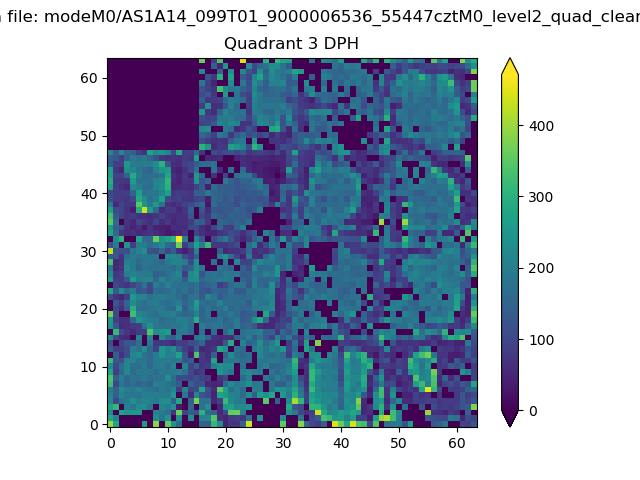 |
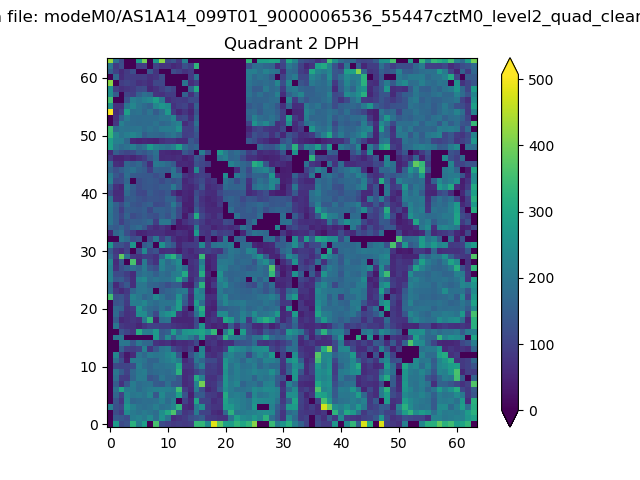 |
Quadrant C |
| Plot type | Count rate plots | Images |
|---|---|---|
| Comparison with Poisson distribution Blue bars denote a histogram of data divided into 1 sec bins. Red curve is a Poisson curve with rate = median count rate of data. |
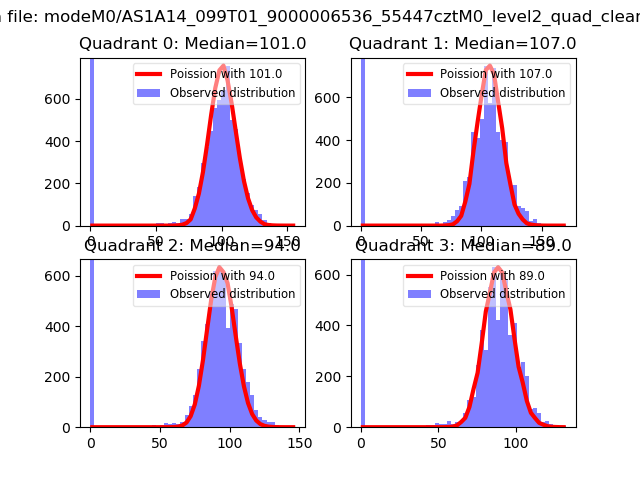 |
 |
| Quadrant-wise count rates Data is divided into 100 sec bins |
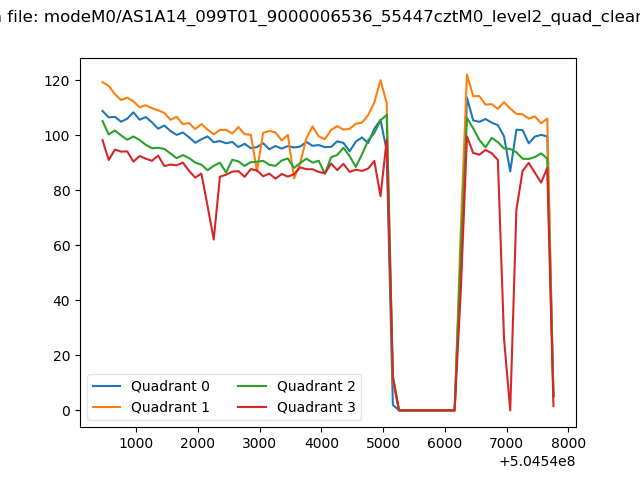 |
|
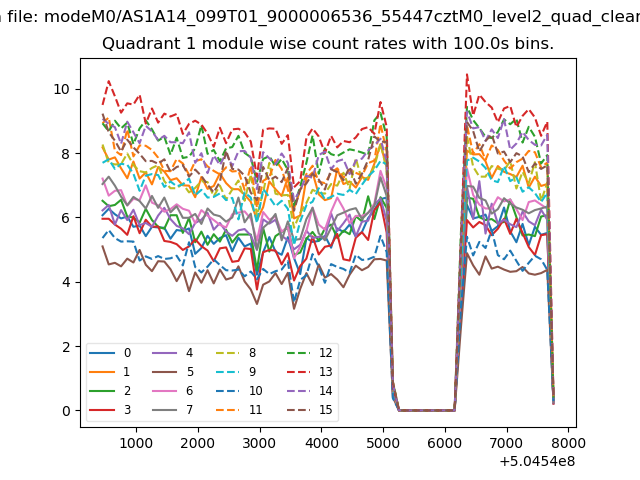
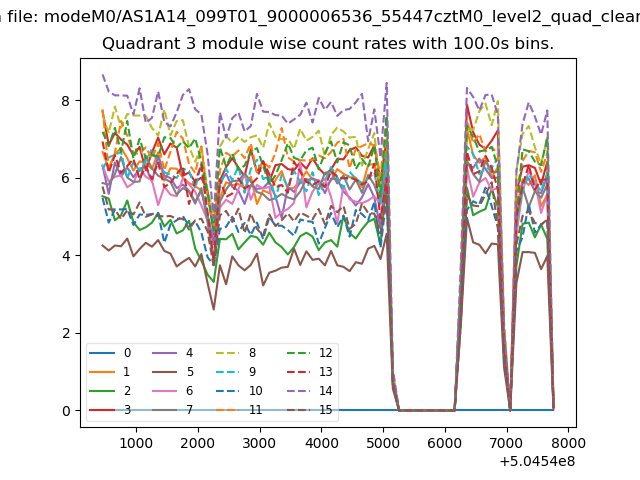
| Module-wise count rates for Quadrant A Data is divided into 100 sec bins |
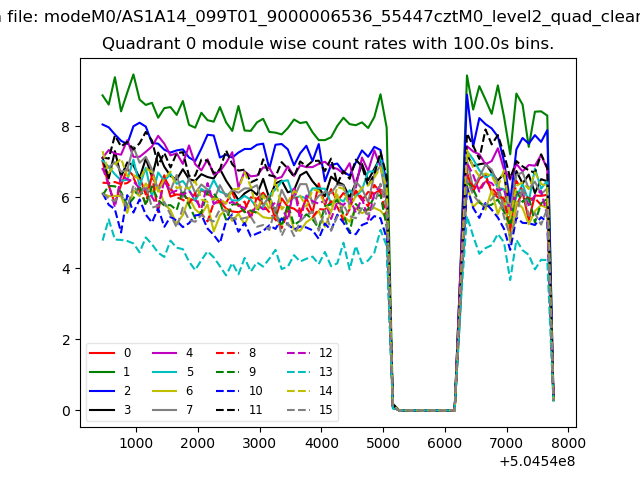 |
 |
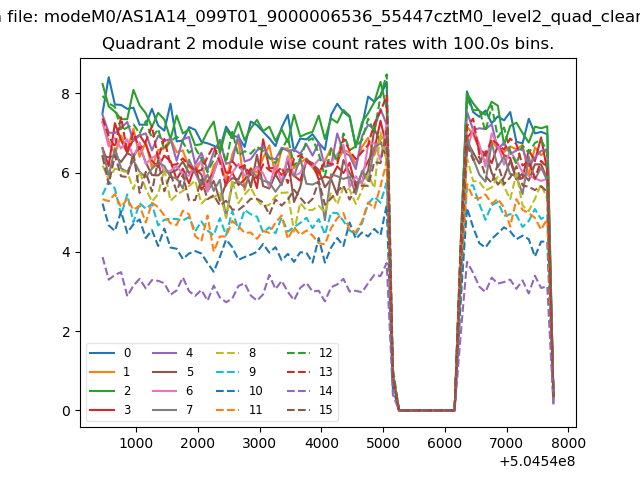
| Module-wise count rates for Quadrant B Data is divided into 100 sec bins |
 |
 |
| Module-wise count rates for Quadrant C Data is divided into 100 sec bins |
 |
 |
| Module-wise count rates for Quadrant D Data is divided into 100 sec bins |
 |
 |
| Parameter | Plot |
|---|---|
| CZT HV Monitor | 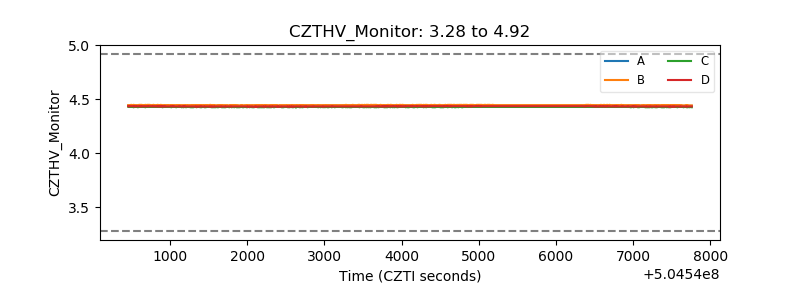 |
| D_VDD | 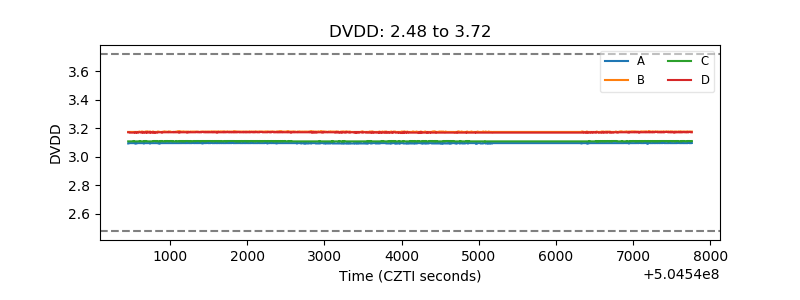 |
| Temperature 1 | 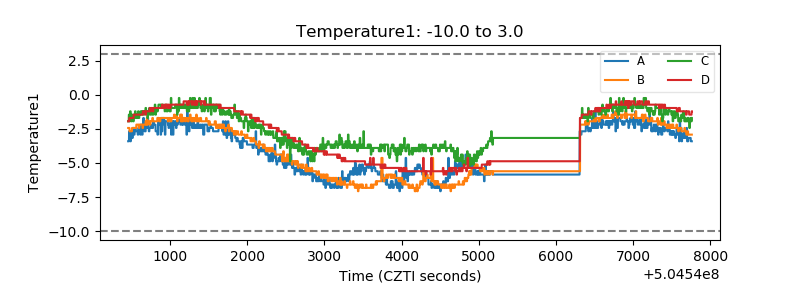 |
| Veto HV Monitor | 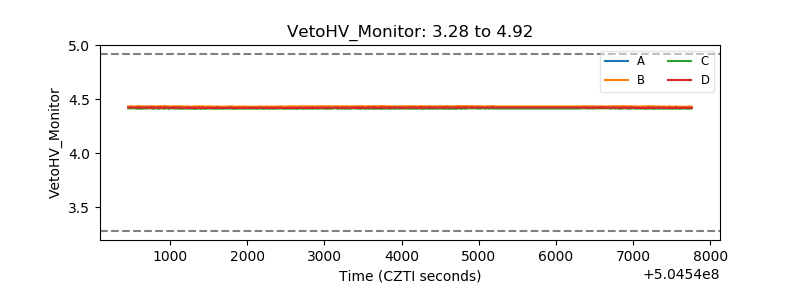 |
| Veto LLD | 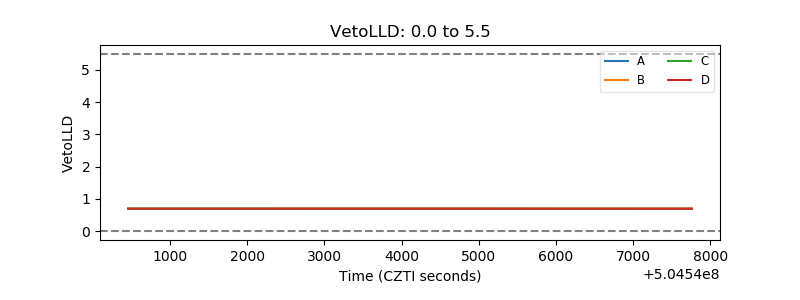 |
| Alpha Counter | 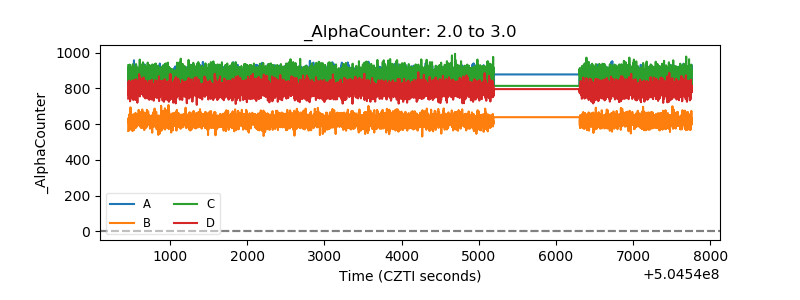 |
| _CPM_Rate | 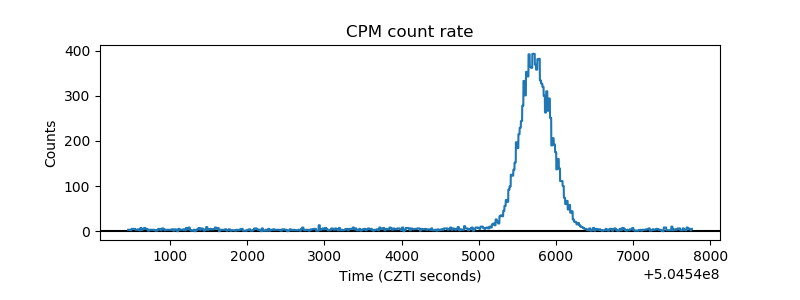 |
| CZT Counter | 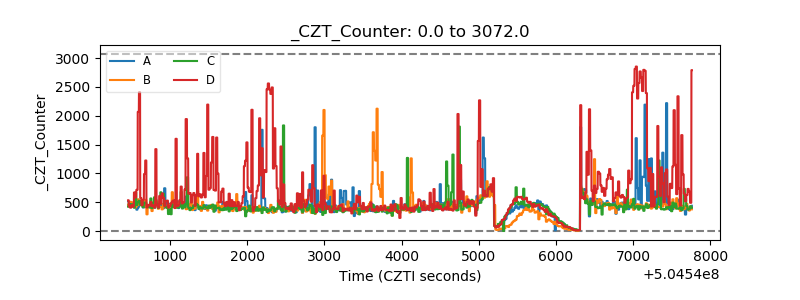 |
| +2.5 Volts monitor |  |
| +5 Volts monitor |  |
| _ROLL_ROT | 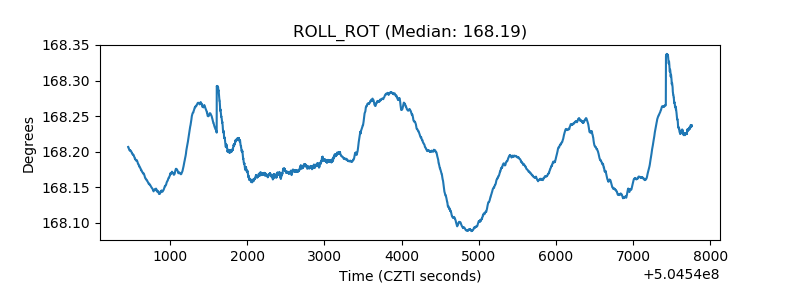 |
| _Roll_DEC | 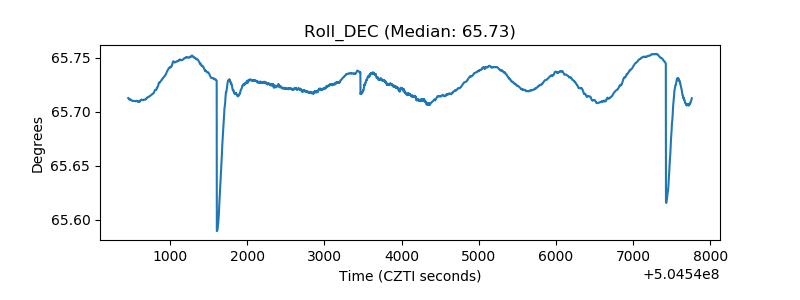 |
| _Roll_RA | 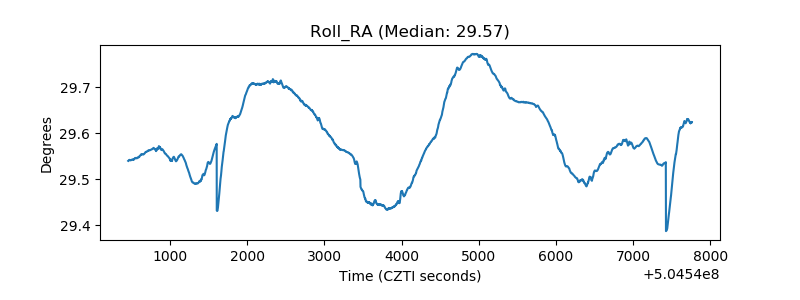 |
| Veto Counter | 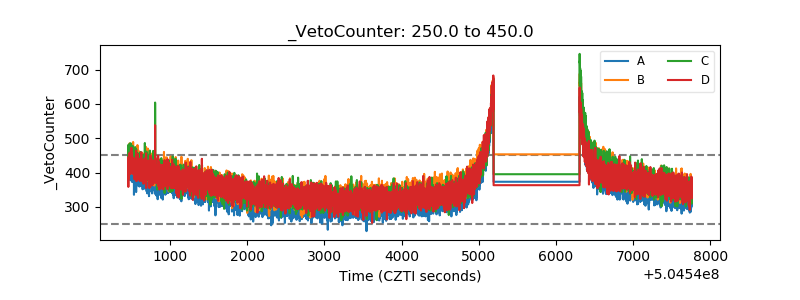 |