| Param | Original file | Final file |
|---|---|---|
| Filename | modeM0/AS1A14_099T01_9000006536_55448cztM0_level2.fits | modeM0/AS1A14_099T01_9000006536_55448cztM0_level2_quad_clean.evt |
| Size (bytes) | 450,339,840 | 98,363,520 |
| Size | 429.5 MB | 93.8 MB |
| Events in quadrant A | 3,713,473 | 652,601 |
| Events in quadrant B | 3,383,061 | 692,811 |
| Events in quadrant C | 3,190,977 | 621,250 |
| Events in quadrant D | 5,854,535 | 539,103 |
| Mode M9 | |||
|---|---|---|---|
| Quadrant | BADHDUFLAG | Total packets | Discarded packets |
| A | 0 | 13 | 0 |
| B | 0 | 13 | 0 |
| C | 0 | 13 | 0 |
| D | 0 | 14 | 0 |
| Mode SS | |||
|---|---|---|---|
| Quadrant | BADHDUFLAG | Total packets | Discarded packets |
| A | 0 | 136 | 0 |
| B | 0 | 136 | 0 |
| C | 0 | 136 | 0 |
| D | 0 | 136 | 0 |
| Mode M0 | |||
|---|---|---|---|
| Quadrant | BADHDUFLAG | Total packets | Discarded packets |
| A | 0 | 16061 | 2 |
| B | 0 | 15248 | 2 |
| C | 0 | 14834 | 2 |
| D | 0 | 22063 | 2 |
| Quadrant | Total seconds | Saturated seconds | Saturation percentage |
|---|---|---|---|
| A | 6786 | 191 | 2.814618% |
| B | 6786 | 234 | 3.448276% |
| C | 6785 | 120 | 1.768607% |
| D | 6785 | 769 | 11.333825% |
Noise dominated data is calculated using 1-second bins in cleaned event files. If a bin has >2000 counts, and if more than 50% of those come from <1% of pixels, then it is considered to be noise-dominated and hence unusable.
| Quadrant | # 1 sec bins | Bins with >0 counts | Bins with >2000 counts | High rate bins dominated by noise | Noise dominated (total time) | Noise dominated (detector-on time) | Marked lightcurve |
|---|---|---|---|---|---|---|---|
| A | 7706 | 6787 | 104 | 104 | 1.35% | 1.53% | 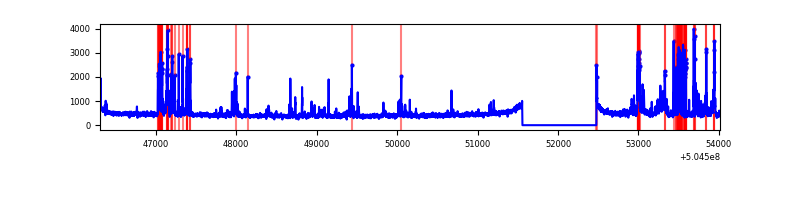 |
| B | 7706 | 6787 | 129 | 129 | 1.67% | 1.90% | 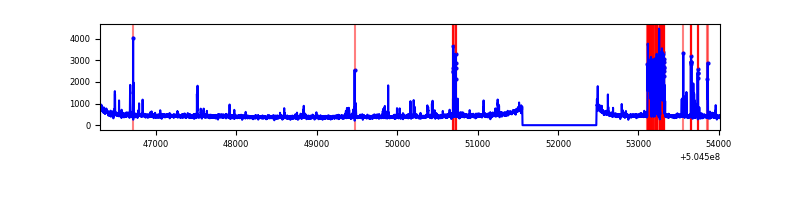 |
| C | 7705 | 6786 | 71 | 71 | 0.92% | 1.05% | 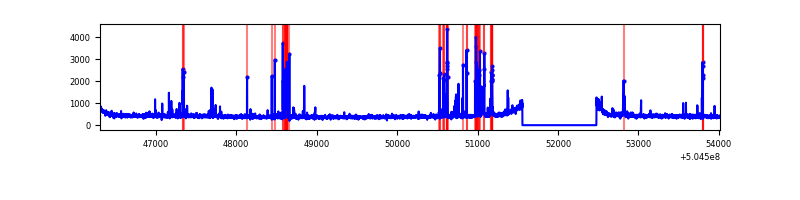 |
| D | 7705 | 6786 | 630 | 630 | 8.18% | 9.28% | 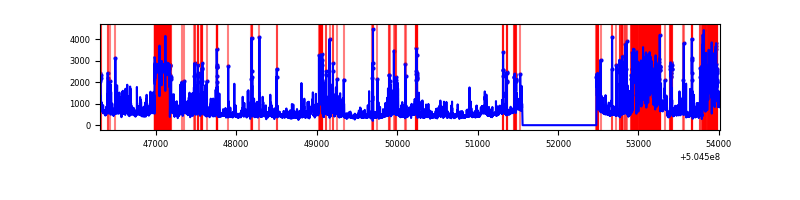 |
Top three noisy pixels from each quadrant. If the there are fewer than three noisy pixels in the level2.evt file, extra rows are filled as -1
| Pixel properties | Quadrant properties | ||||||
|---|---|---|---|---|---|---|---|
| Quadrant | DetID | PixID | Counts | Sigma | Mean | Median | Sigma |
| A | 3 | 78 | 524324 | 2906.99 | 727 | 711 | 180.1 |
| A | 0 | 8 | 324211 | 1796.01 | 727 | 711 | 180.1 |
| A | 4 | 3 | 15033 | 79.51 | 727 | 711 | 180.1 |
| B | 0 | 171 | 361009 | 2343.34 | 715 | 687 | 153.8 |
| B | 10 | 247 | 89740 | 579.15 | 715 | 687 | 153.8 |
| B | 7 | 252 | 44597 | 285.57 | 715 | 687 | 153.8 |
| C | 13 | 3 | 277106 | 1407.37 | 714 | 705 | 196.4 |
| C | 10 | 64 | 51164 | 256.93 | 714 | 705 | 196.4 |
| C | 12 | 252 | 25821 | 127.88 | 714 | 705 | 196.4 |
| D | 2 | 62 | 1325835 | 7046.23 | 676 | 648 | 188.1 |
| D | 3 | 12 | 303426 | 1609.92 | 676 | 648 | 188.1 |
| D | 11 | 129 | 298610 | 1584.31 | 676 | 648 | 188.1 |
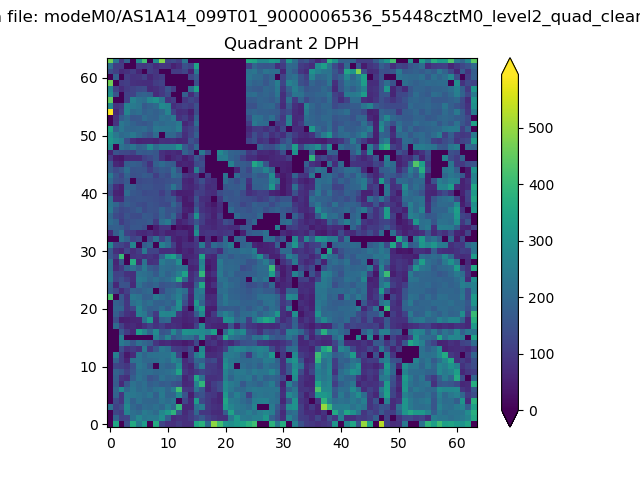
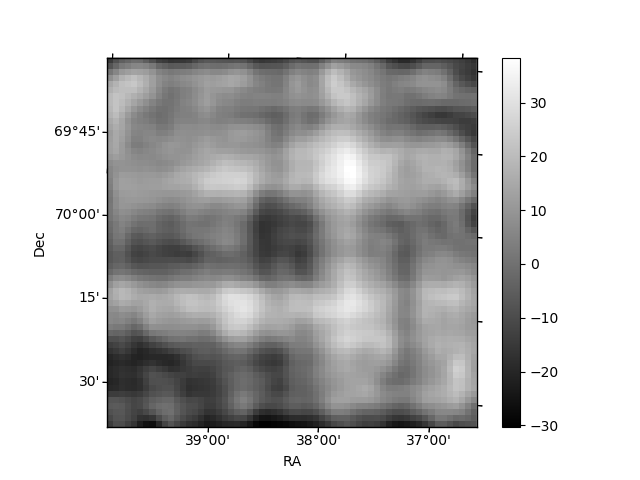
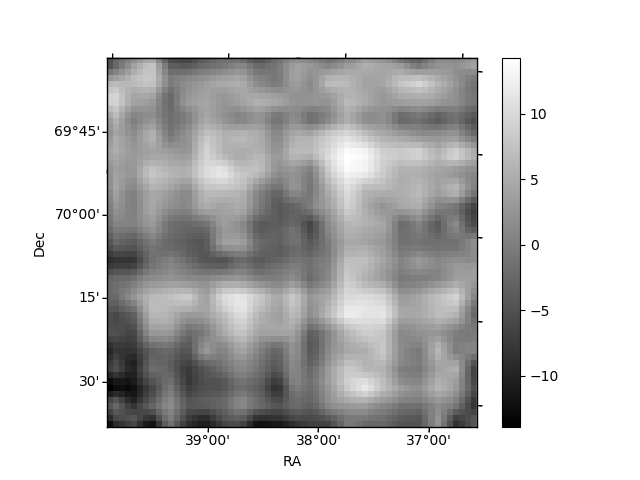
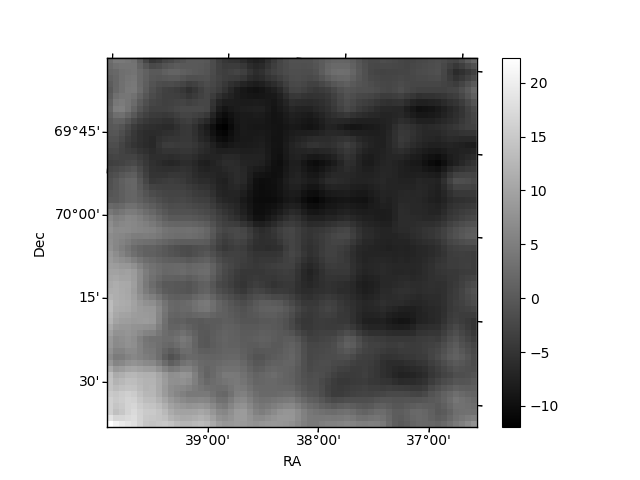
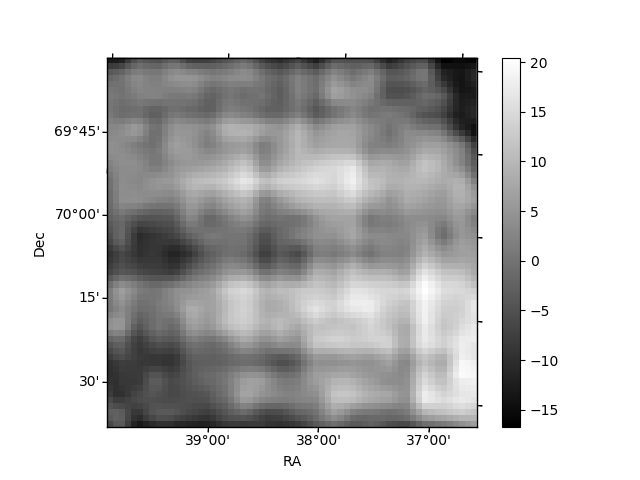
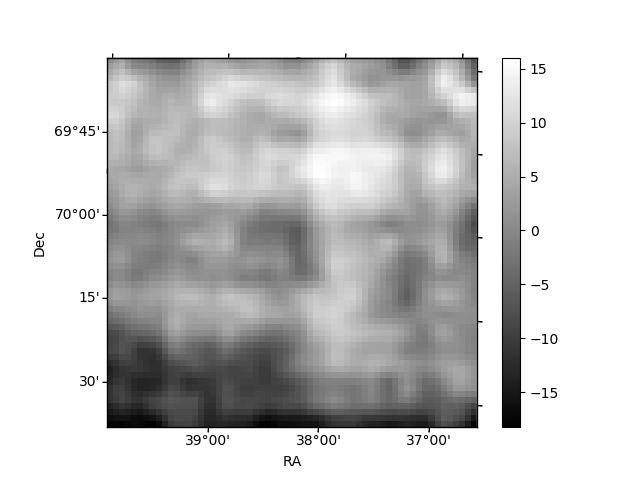
Histogram calculated using DETX and DETY for each event in the final _common_clean file
| Quadrant A | 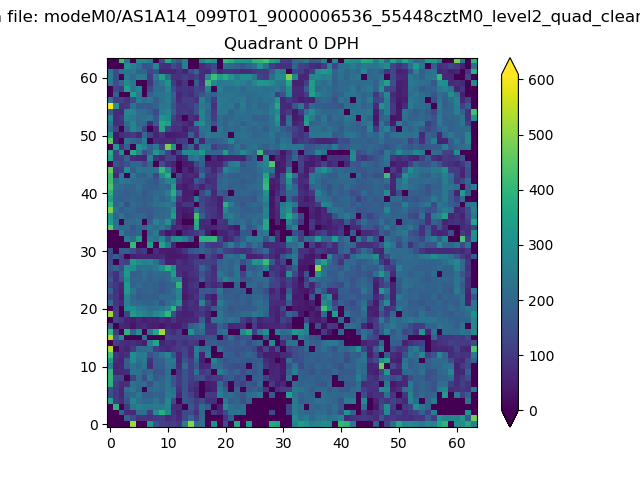 |
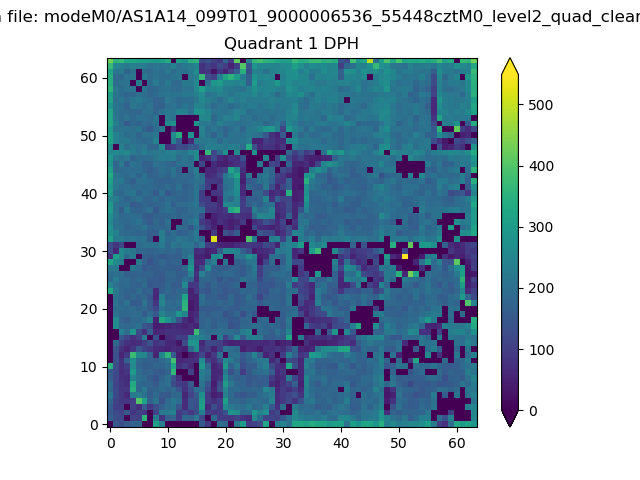 |
Quadrant B |
|---|---|---|---|
| Quadrant D | 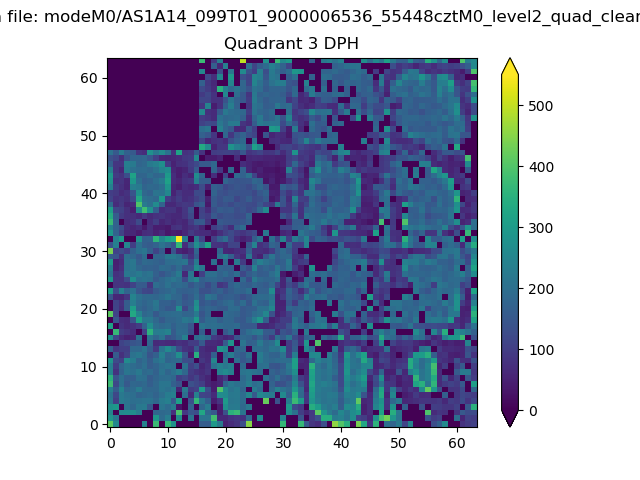 |
 |
Quadrant C |
| Plot type | Count rate plots | Images |
|---|---|---|
| Comparison with Poisson distribution Blue bars denote a histogram of data divided into 1 sec bins. Red curve is a Poisson curve with rate = median count rate of data. |
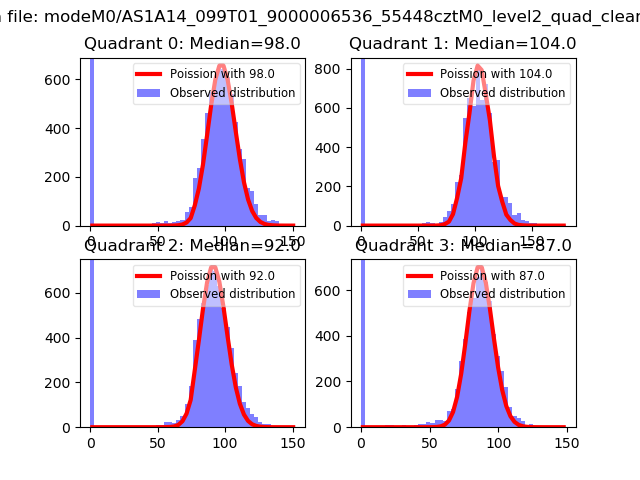 |
 |
| Quadrant-wise count rates Data is divided into 100 sec bins |
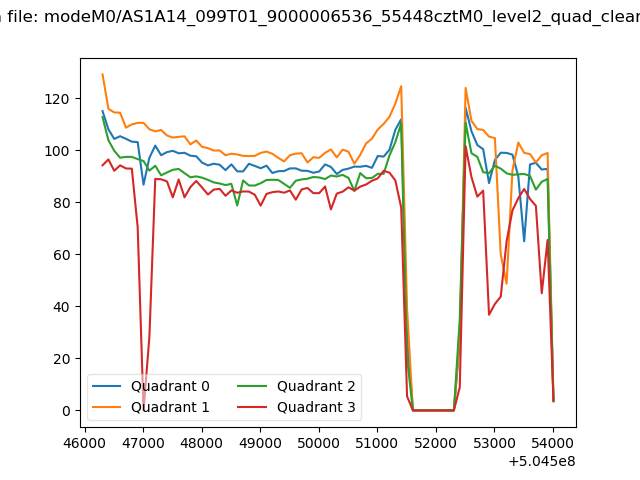 |
|
| Module-wise count rates for Quadrant A Data is divided into 100 sec bins |
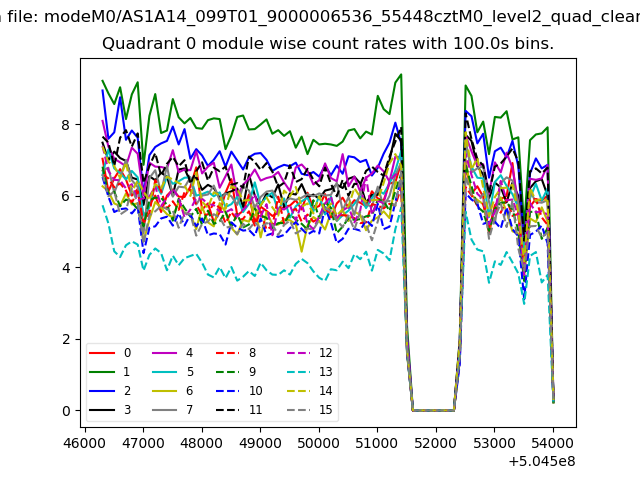 |
 |
| Module-wise count rates for Quadrant B Data is divided into 100 sec bins |
 |
 |
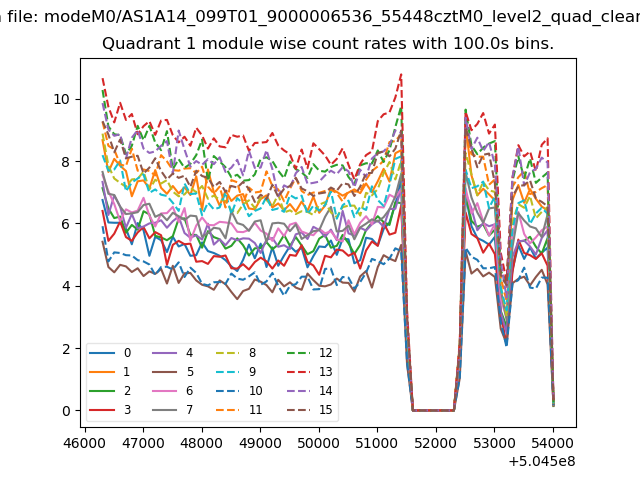
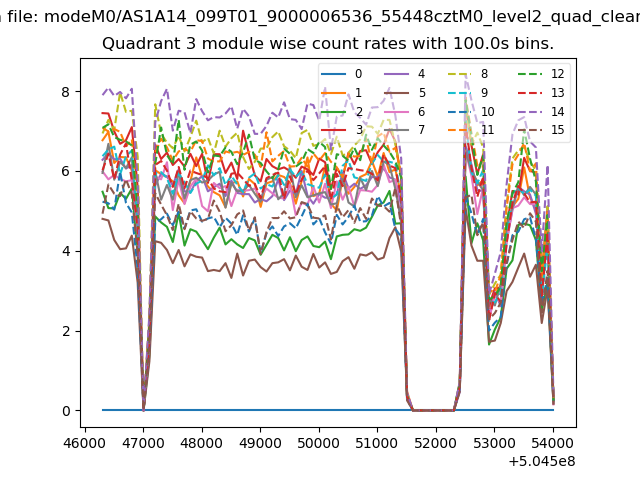
| Module-wise count rates for Quadrant C Data is divided into 100 sec bins |
 |
 |
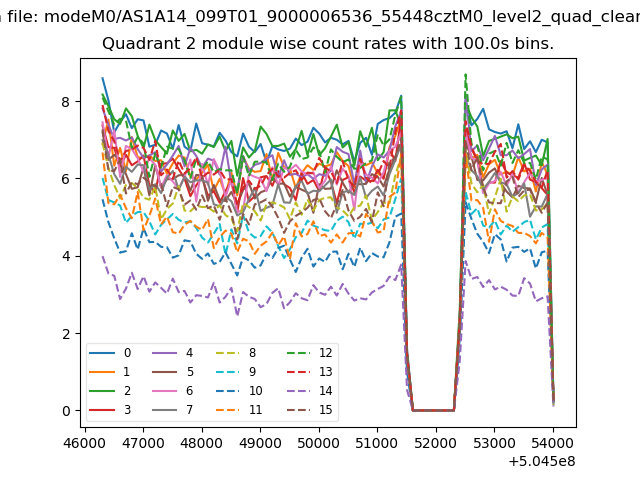
| Module-wise count rates for Quadrant D Data is divided into 100 sec bins |
 |
 |
| Parameter | Plot |
|---|---|
| CZT HV Monitor | 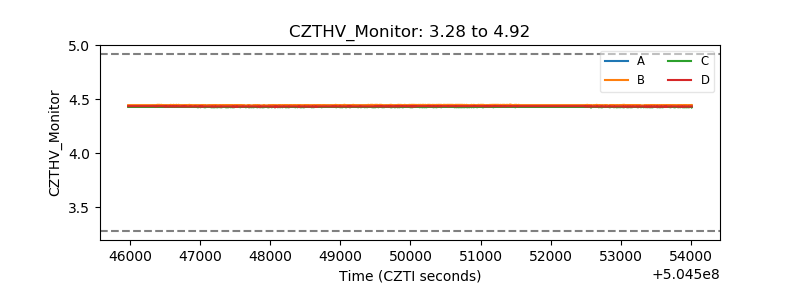 |
| D_VDD | 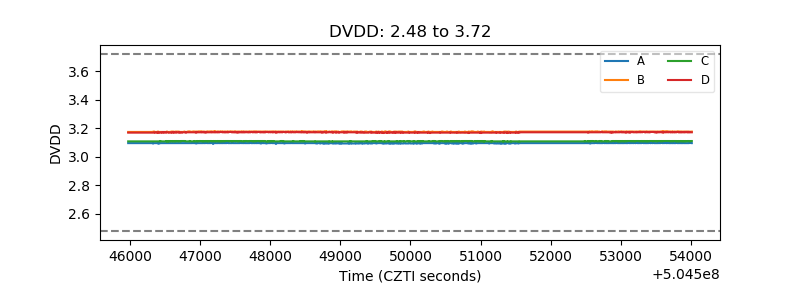 |
| Temperature 1 | 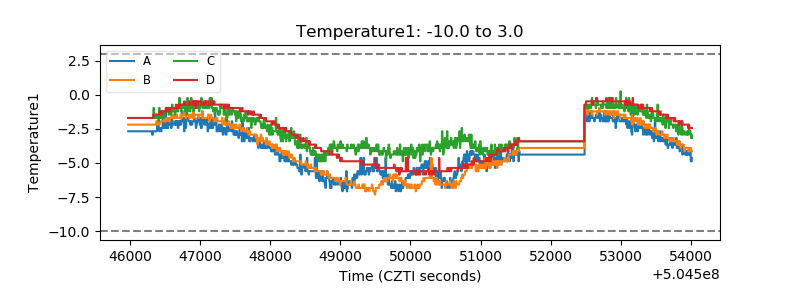 |
| Veto HV Monitor | 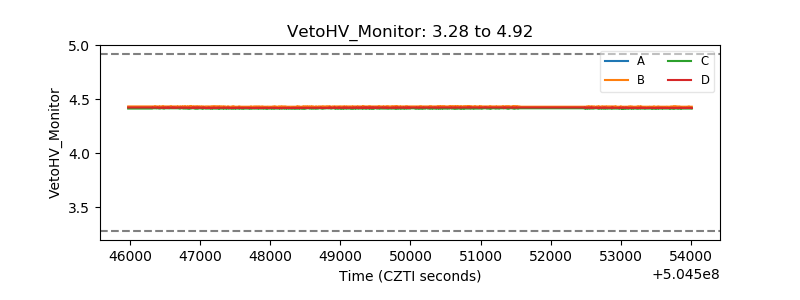 |
| Veto LLD | 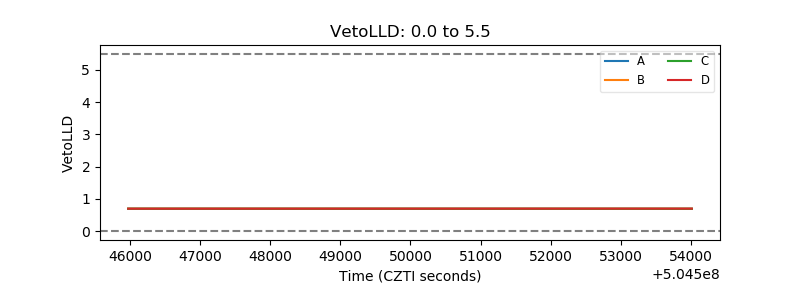 |
| Alpha Counter | 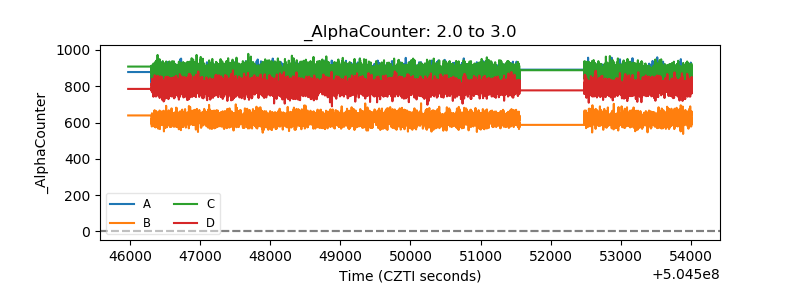 |
| _CPM_Rate | 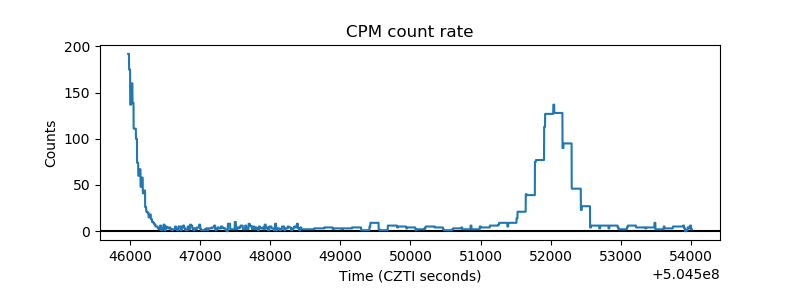 |
| CZT Counter | 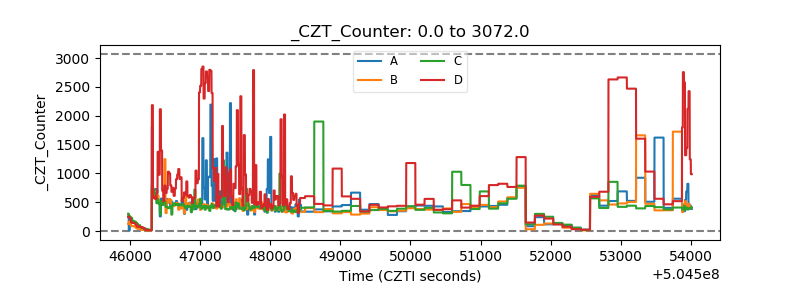 |
| +2.5 Volts monitor | 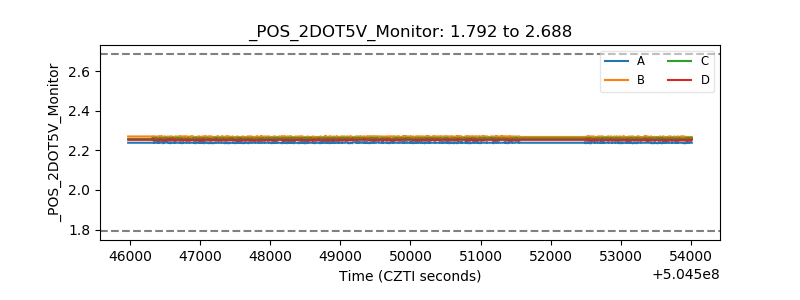 |
| +5 Volts monitor | 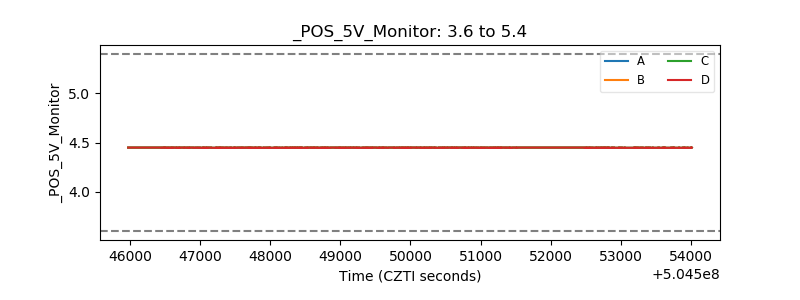 |
| _ROLL_ROT | 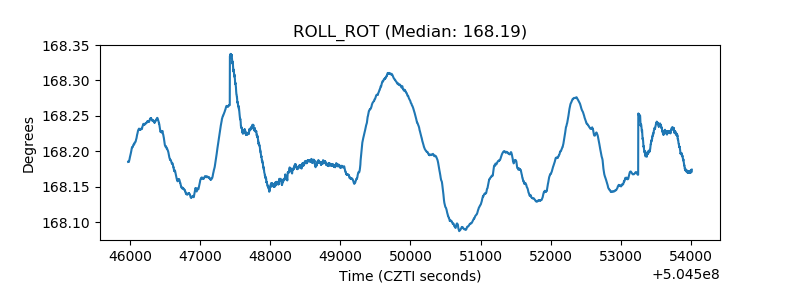 |
| _Roll_DEC | 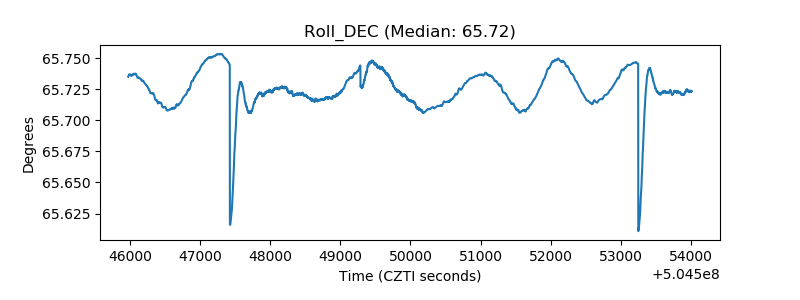 |
| _Roll_RA | 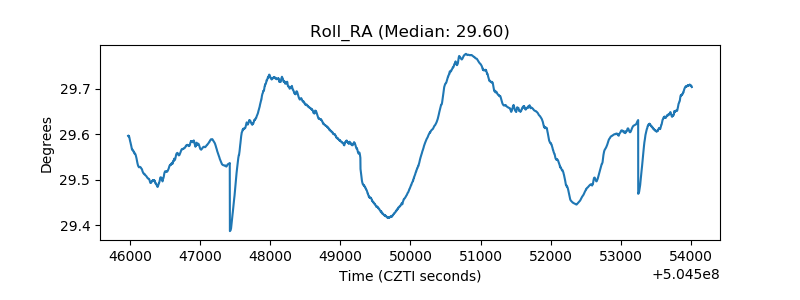 |
| Veto Counter | 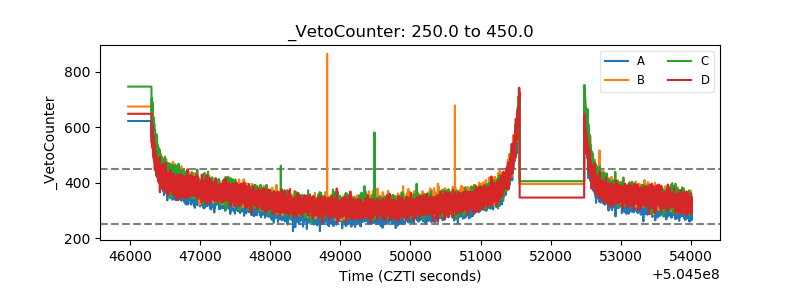 |