| Param | Original file | Final file |
|---|---|---|
| Filename | modeM0/AS1A14_099T01_9000006536_55449cztM0_level2.fits | modeM0/AS1A14_099T01_9000006536_55449cztM0_level2_quad_clean.evt |
| Size (bytes) | 421,957,440 | 55,128,960 |
| Size | 402.4 MB | 52.6 MB |
| Events in quadrant A | 2,388,382 | 412,210 |
| Events in quadrant B | 2,453,347 | 423,983 |
| Events in quadrant C | 1,873,063 | 387,505 |
| Events in quadrant D | 8,568,480 | 142,347 |
| Mode M9 | |||
|---|---|---|---|
| Quadrant | BADHDUFLAG | Total packets | Discarded packets |
| A | 0 | 5 | 0 |
| B | 0 | 5 | 0 |
| C | 0 | 5 | 0 |
| D | 0 | 5 | 0 |
| Mode SS | |||
|---|---|---|---|
| Quadrant | BADHDUFLAG | Total packets | Discarded packets |
| A | 0 | 92 | 4 |
| B | 0 | 92 | 4 |
| C | 0 | 92 | 6 |
| D | 0 | 92 | 4 |
| Mode M0 | |||
|---|---|---|---|
| Quadrant | BADHDUFLAG | Total packets | Discarded packets |
| A | 0 | 11050 | 633 |
| B | 0 | 11276 | 720 |
| C | 0 | 9779 | 773 |
| D | 0 | 31171 | 2801 |
| Quadrant | Total seconds | Saturated seconds | Saturation percentage |
|---|---|---|---|
| A | 4343 | 108 | 2.486760% |
| B | 4338 | 203 | 4.679576% |
| C | 4322 | 15 | 0.347062% |
| D | 4216 | 2723 | 64.587287% |
Noise dominated data is calculated using 1-second bins in cleaned event files. If a bin has >2000 counts, and if more than 50% of those come from <1% of pixels, then it is considered to be noise-dominated and hence unusable.
| Quadrant | # 1 sec bins | Bins with >0 counts | Bins with >2000 counts | High rate bins dominated by noise | Noise dominated (total time) | Noise dominated (detector-on time) | Marked lightcurve |
|---|---|---|---|---|---|---|---|
| A | 7728 | 4394 | 82 | 82 | 1.06% | 1.87% | 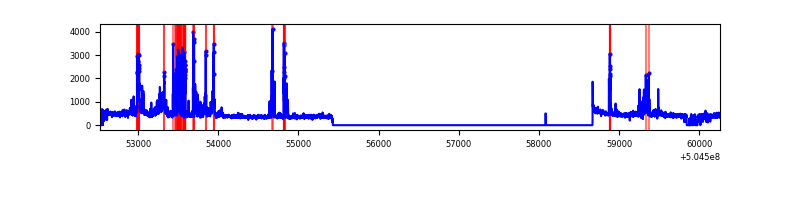 |
| B | 7731 | 4396 | 145 | 145 | 1.88% | 3.30% | 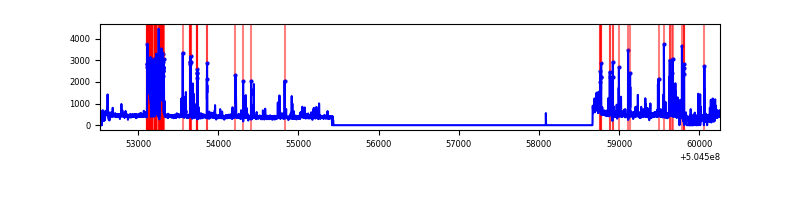 |
| C | 7726 | 4388 | 11 | 11 | 0.14% | 0.25% | 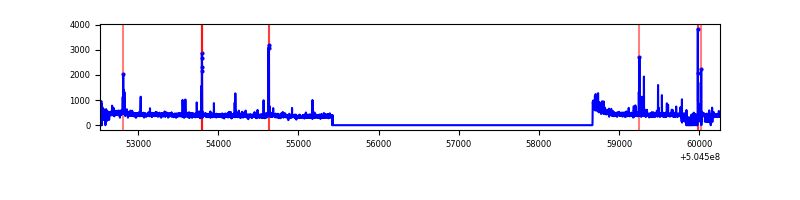 |
| D | 7714 | 4230 | 2611 | 2611 | 33.85% | 61.73% | 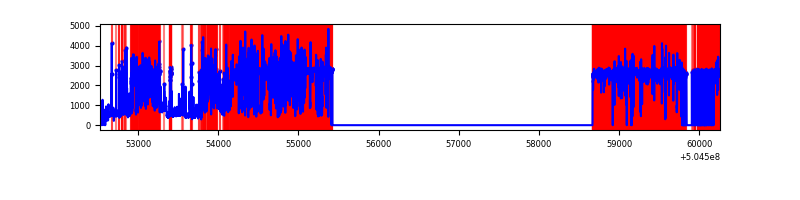 |
Top three noisy pixels from each quadrant. If the there are fewer than three noisy pixels in the level2.evt file, extra rows are filled as -1
| Pixel properties | Quadrant properties | ||||||
|---|---|---|---|---|---|---|---|
| Quadrant | DetID | PixID | Counts | Sigma | Mean | Median | Sigma |
| A | 0 | 8 | 312461 | 2778.38 | 447 | 435 | 112.3 |
| A | 3 | 78 | 265136 | 2356.98 | 447 | 435 | 112.3 |
| A | 8 | 249 | 31101 | 273.06 | 447 | 435 | 112.3 |
| B | 0 | 171 | 475746 | 5139.57 | 438 | 423 | 92.5 |
| B | 10 | 247 | 102883 | 1107.88 | 438 | 423 | 92.5 |
| B | 7 | 252 | 38338 | 409.97 | 438 | 423 | 92.5 |
| C | 13 | 3 | 73094 | 587.22 | 444 | 439 | 123.7 |
| C | 15 | 147 | 24774 | 196.68 | 444 | 439 | 123.7 |
| C | 14 | 254 | 11241 | 87.31 | 444 | 439 | 123.7 |
| D | 2 | 62 | 5908732 | 77972.21 | 263 | 251 | 75.8 |
| D | 6 | 239 | 370876 | 4891.01 | 263 | 251 | 75.8 |
| D | 3 | 12 | 331164 | 4366.95 | 263 | 251 | 75.8 |
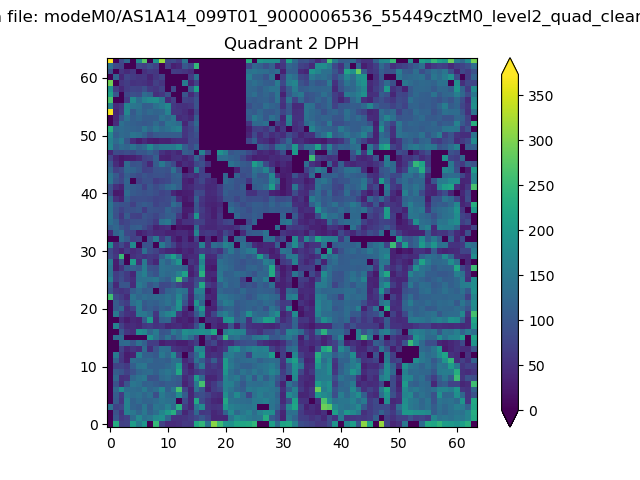
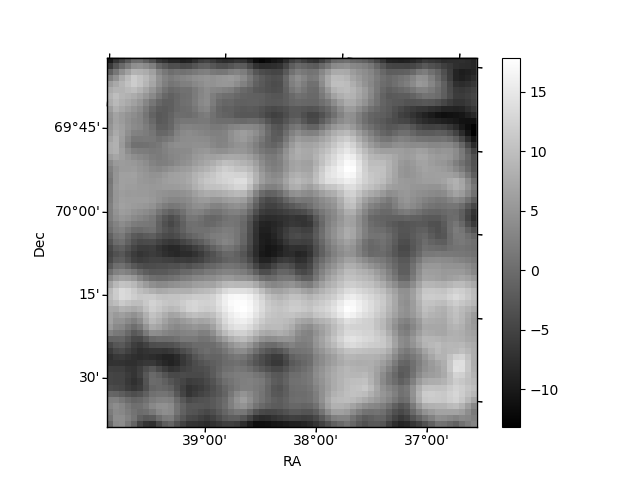
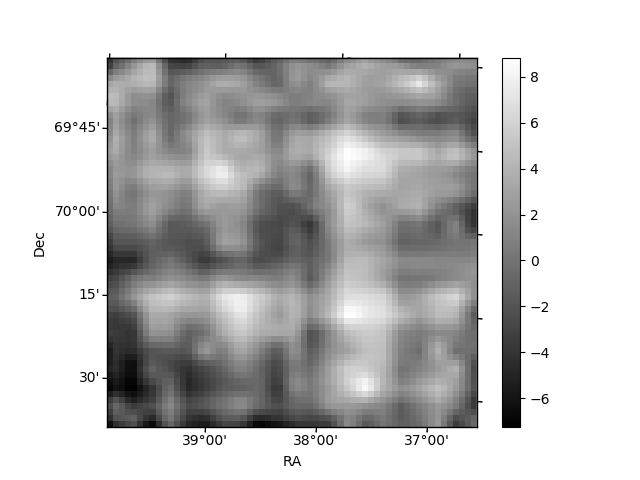
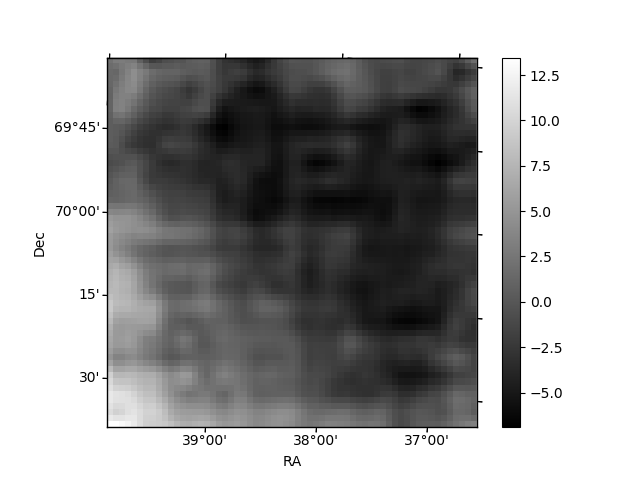
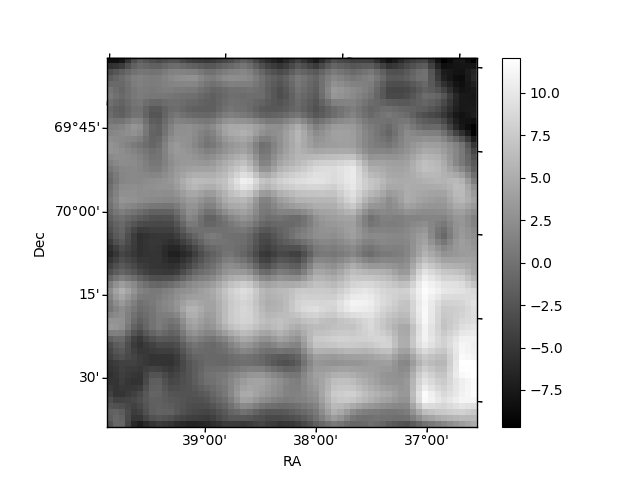
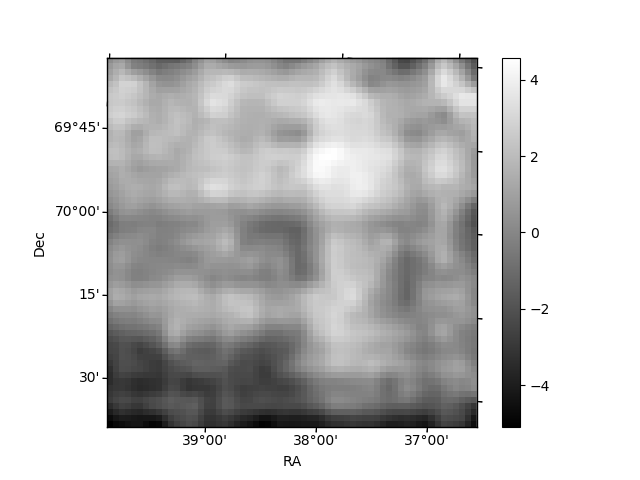
Histogram calculated using DETX and DETY for each event in the final _common_clean file
| Quadrant A | 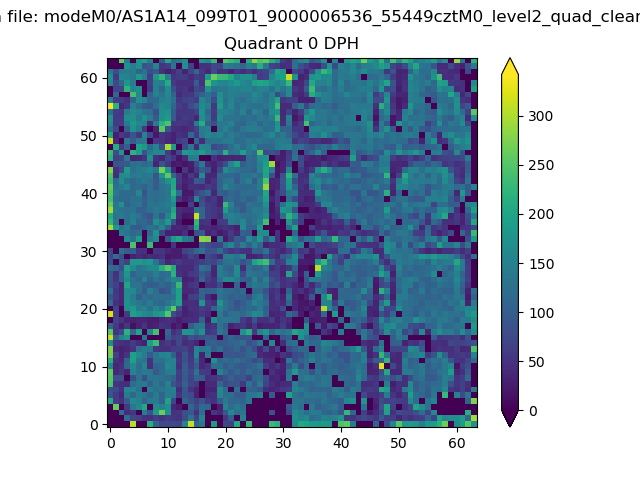 |
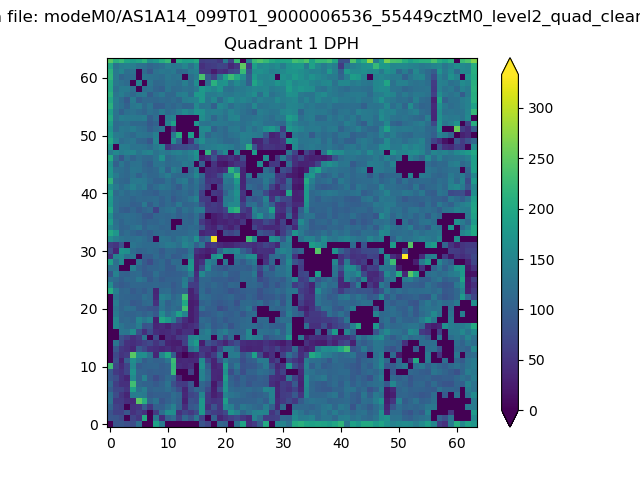 |
Quadrant B |
|---|---|---|---|
| Quadrant D | 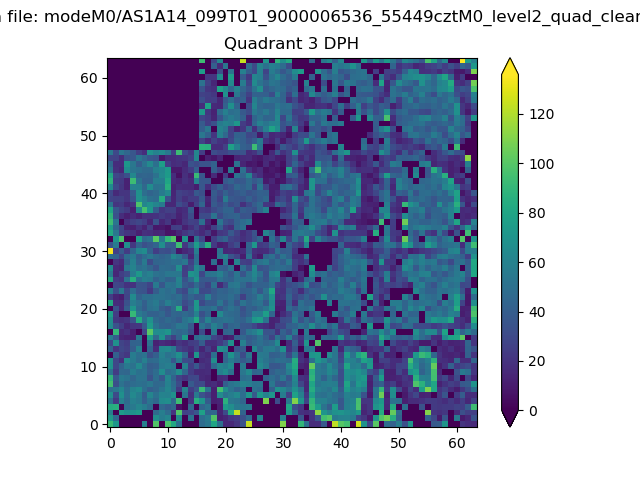 |
 |
Quadrant C |
| Plot type | Count rate plots | Images |
|---|---|---|
| Comparison with Poisson distribution Blue bars denote a histogram of data divided into 1 sec bins. Red curve is a Poisson curve with rate = median count rate of data. |
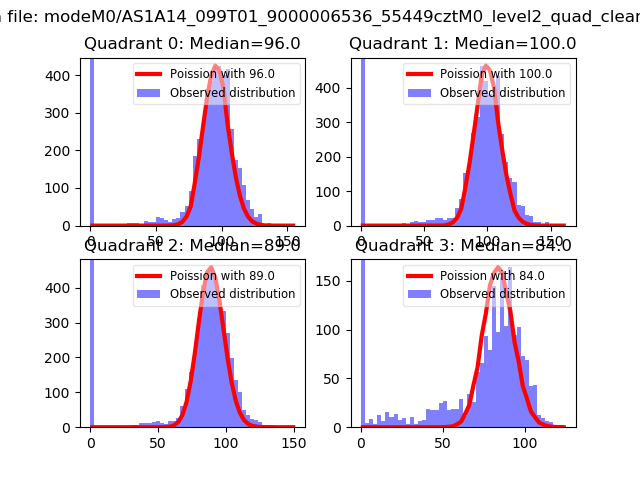 |
 |
| Quadrant-wise count rates Data is divided into 100 sec bins |
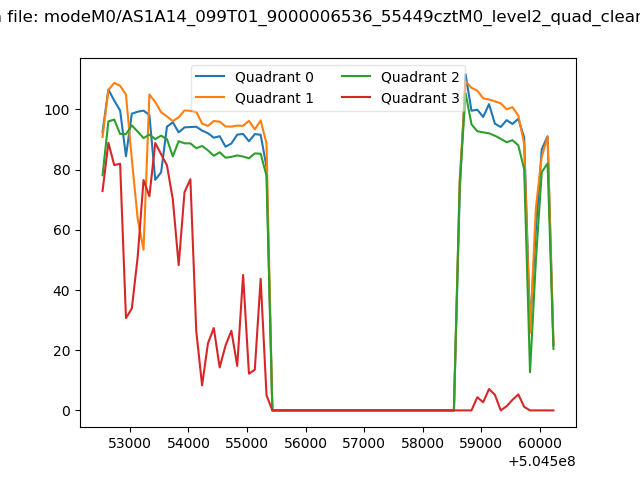 |
|
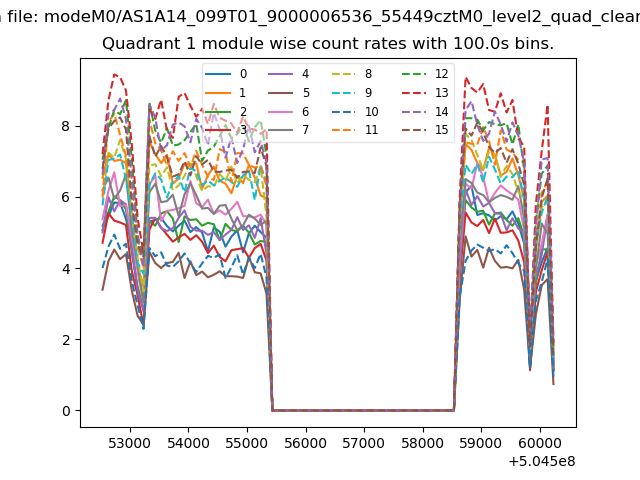
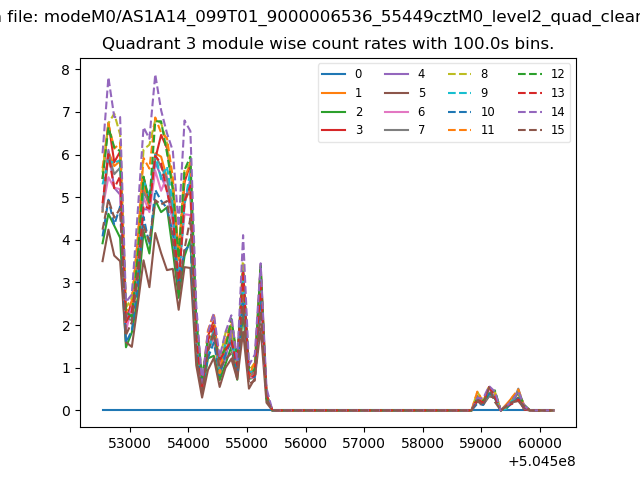
| Module-wise count rates for Quadrant A Data is divided into 100 sec bins |
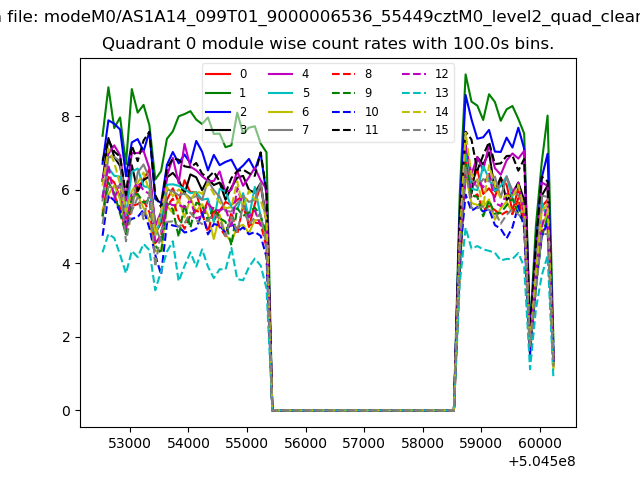 |
 |
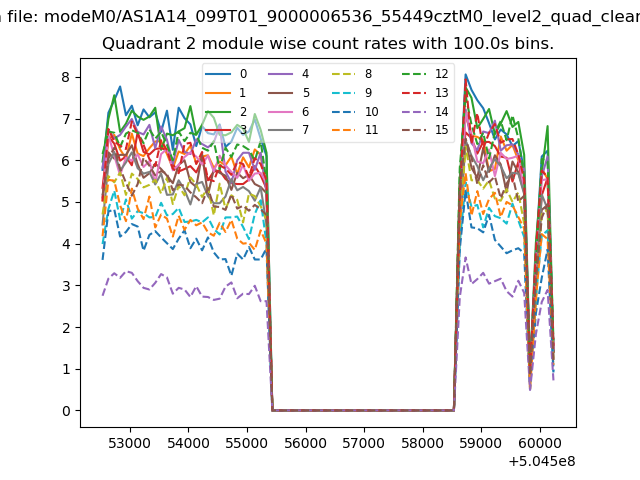
| Module-wise count rates for Quadrant B Data is divided into 100 sec bins |
 |
 |
| Module-wise count rates for Quadrant C Data is divided into 100 sec bins |
 |
 |
| Module-wise count rates for Quadrant D Data is divided into 100 sec bins |
 |
 |
| Parameter | Plot |
|---|---|
| CZT HV Monitor | 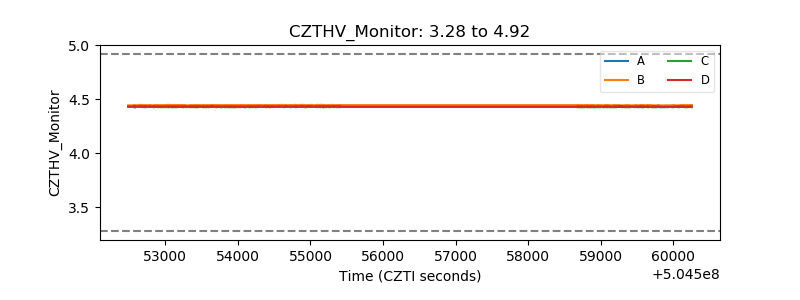 |
| D_VDD | 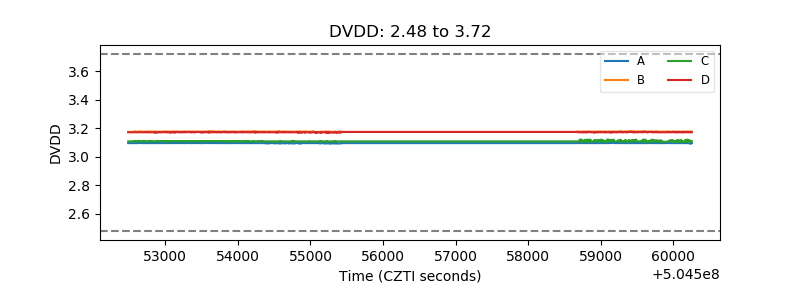 |
| Temperature 1 | 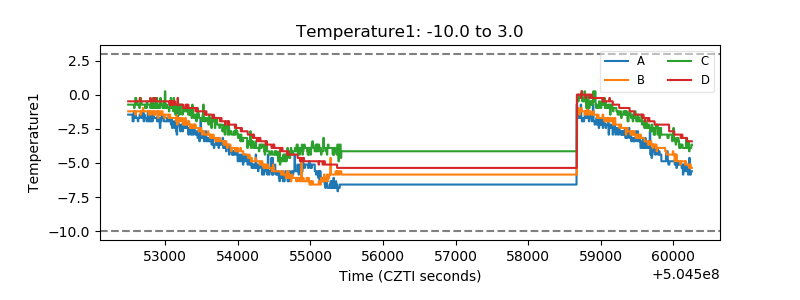 |
| Veto HV Monitor |  |
| Veto LLD | 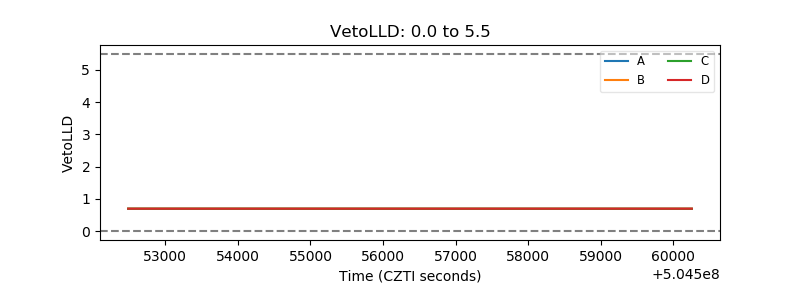 |
| Alpha Counter | 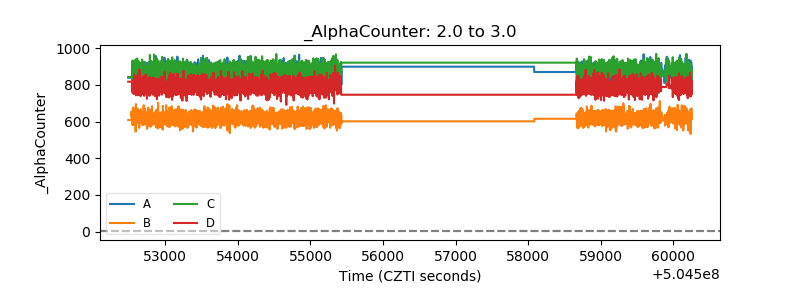 |
| _CPM_Rate | 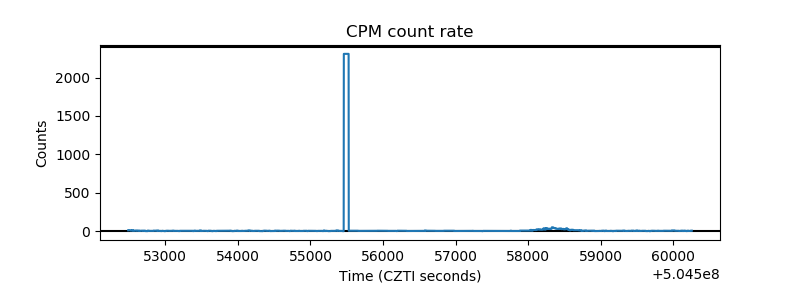 |
| CZT Counter | 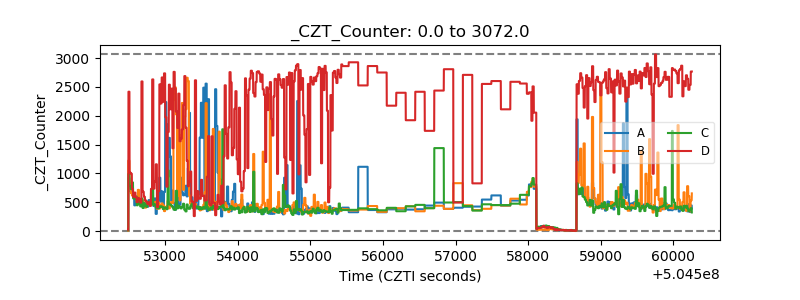 |
| +2.5 Volts monitor | 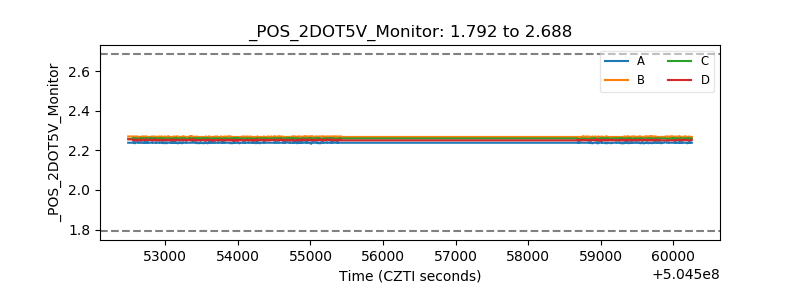 |
| +5 Volts monitor | 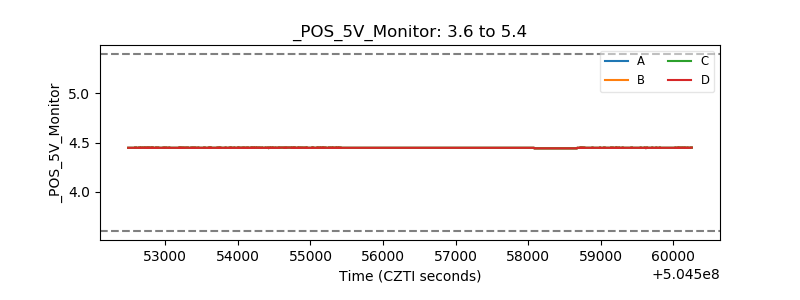 |
| _ROLL_ROT | 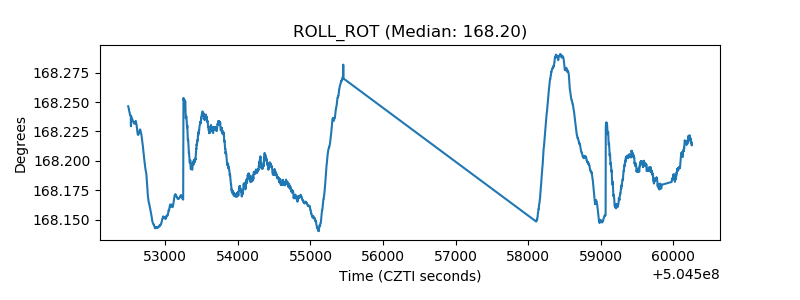 |
| _Roll_DEC | 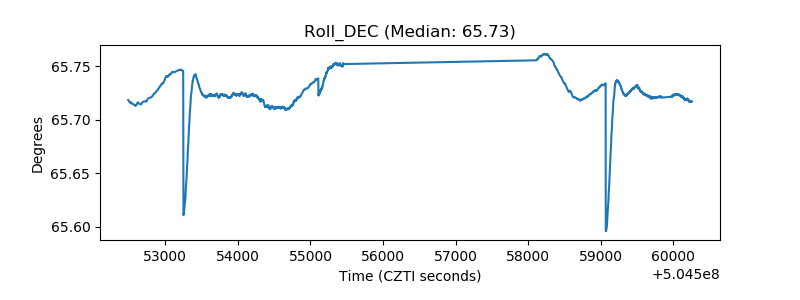 |
| _Roll_RA | 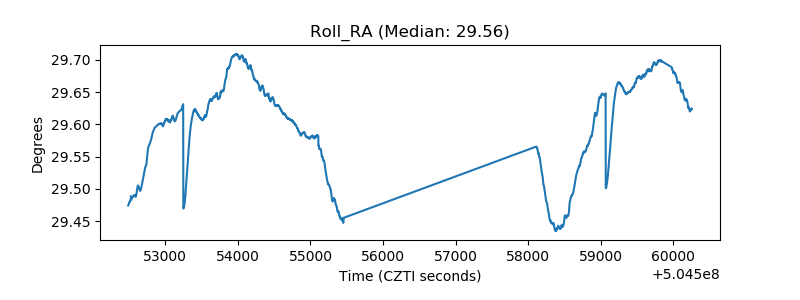 |
| Veto Counter | 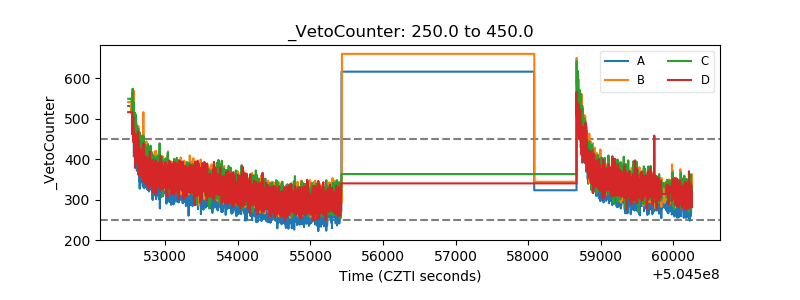 |