| Param | Original file | Final file |
|---|---|---|
| Filename | modeM0/AS1A14_099T01_9000006536_55450cztM0_level2.fits | modeM0/AS1A14_099T01_9000006536_55450cztM0_level2_quad_clean.evt |
| Size (bytes) | 842,754,240 | 91,379,520 |
| Size | 803.7 MB | 87.1 MB |
| Events in quadrant A | 3,769,986 | 721,255 |
| Events in quadrant B | 4,269,950 | 760,426 |
| Events in quadrant C | 3,573,381 | 678,930 |
| Events in quadrant D | 18,989,252 | 75,083 |
| Mode SS | |||
|---|---|---|---|
| Quadrant | BADHDUFLAG | Total packets | Discarded packets |
| A | 0 | 154 | 2 |
| B | 0 | 153 | 1 |
| C | 0 | 154 | 2 |
| D | 0 | 154 | 2 |
| Mode M0 | |||
|---|---|---|---|
| Quadrant | BADHDUFLAG | Total packets | Discarded packets |
| A | 0 | 17137 | 104 |
| B | 0 | 18522 | 204 |
| C | 0 | 16752 | 150 |
| D | 0 | 62265 | 630 |
| Quadrant | Total seconds | Saturated seconds | Saturation percentage |
|---|---|---|---|
| A | 7648 | 66 | 0.862971% |
| B | 7636 | 194 | 2.540597% |
| C | 7632 | 103 | 1.349581% |
| D | 7620 | 6929 | 90.931759% |
Noise dominated data is calculated using 1-second bins in cleaned event files. If a bin has >2000 counts, and if more than 50% of those come from <1% of pixels, then it is considered to be noise-dominated and hence unusable.
| Quadrant | # 1 sec bins | Bins with >0 counts | Bins with >2000 counts | High rate bins dominated by noise | Noise dominated (total time) | Noise dominated (detector-on time) | Marked lightcurve |
|---|---|---|---|---|---|---|---|
| A | 7684 | 7662 | 42 | 42 | 0.55% | 0.55% | 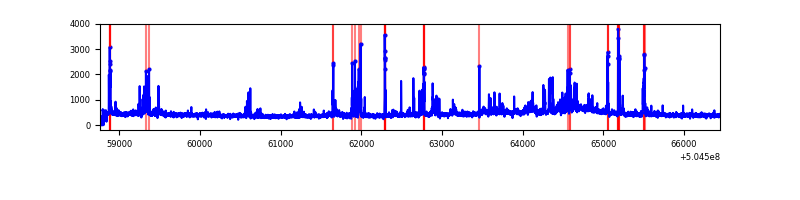 |
| B | 7651 | 7645 | 129 | 129 | 1.69% | 1.69% | 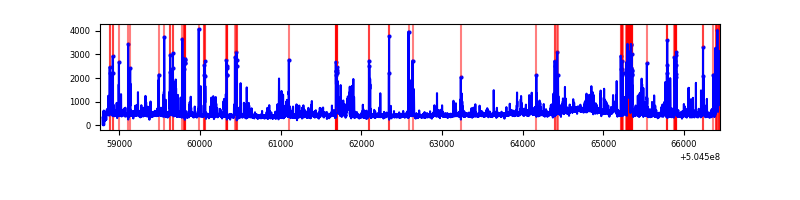 |
| C | 7671 | 7647 | 62 | 62 | 0.81% | 0.81% | 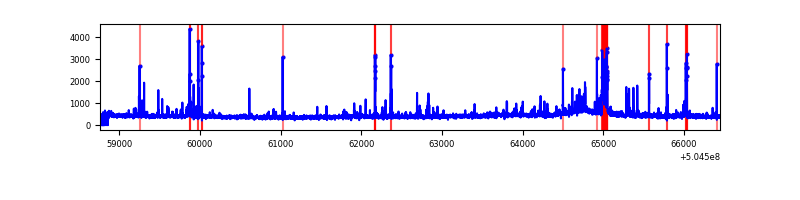 |
| D | 7657 | 7620 | 6607 | 6607 | 86.29% | 86.71% | 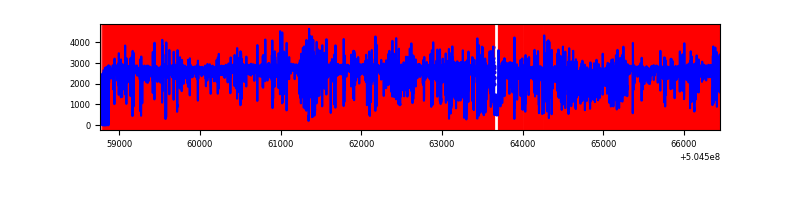 |
Top three noisy pixels from each quadrant. If the there are fewer than three noisy pixels in the level2.evt file, extra rows are filled as -1
| Pixel properties | Quadrant properties | ||||||
|---|---|---|---|---|---|---|---|
| Quadrant | DetID | PixID | Counts | Sigma | Mean | Median | Sigma |
| A | 3 | 78 | 282918 | 1398.17 | 807 | 786 | 201.8 |
| A | 0 | 8 | 185457 | 915.18 | 807 | 786 | 201.8 |
| A | 4 | 159 | 106416 | 523.47 | 807 | 786 | 201.8 |
| B | 0 | 171 | 351715 | 2096.66 | 792 | 762 | 167.4 |
| B | 5 | 236 | 250143 | 1489.85 | 792 | 762 | 167.4 |
| B | 10 | 247 | 219185 | 1304.9 | 792 | 762 | 167.4 |
| C | 13 | 3 | 336157 | 1546.04 | 787 | 779 | 216.9 |
| C | 12 | 252 | 66152 | 301.36 | 787 | 779 | 216.9 |
| C | 15 | 147 | 34259 | 154.34 | 787 | 779 | 216.9 |
| D | 2 | 62 | 15588736 | 140269.54 | 382 | 365 | 111.1 |
| D | 6 | 239 | 682027 | 6133.83 | 382 | 365 | 111.1 |
| D | 7 | 70 | 450913 | 4054.19 | 382 | 365 | 111.1 |
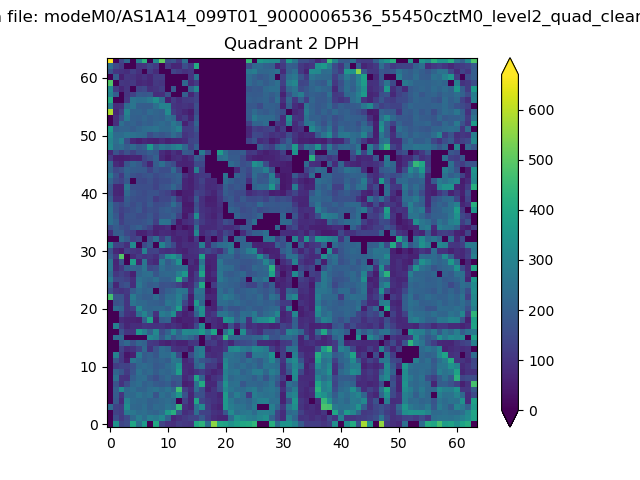
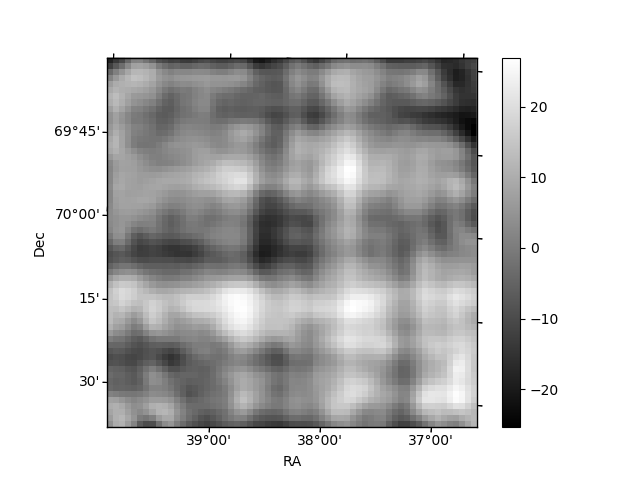
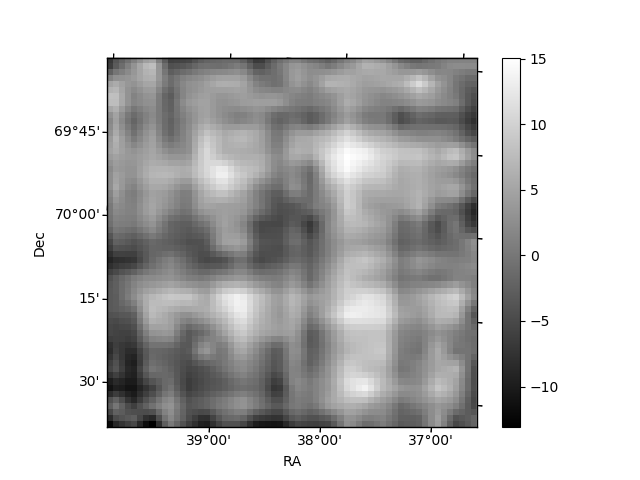
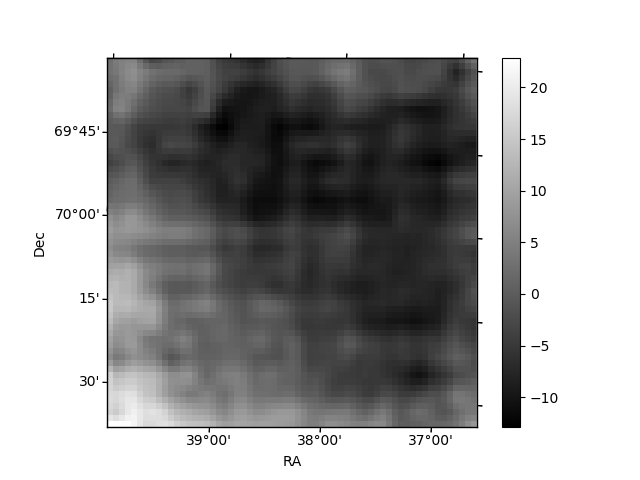
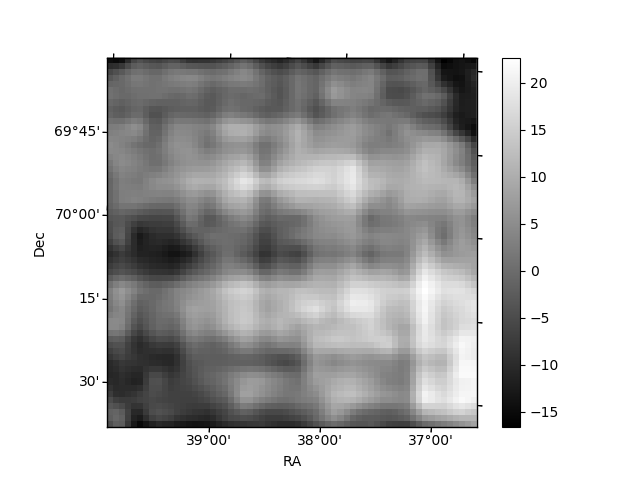
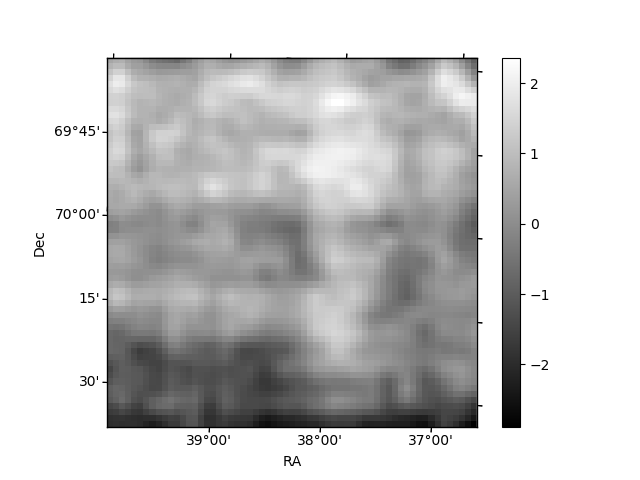
Histogram calculated using DETX and DETY for each event in the final _common_clean file
| Quadrant A | 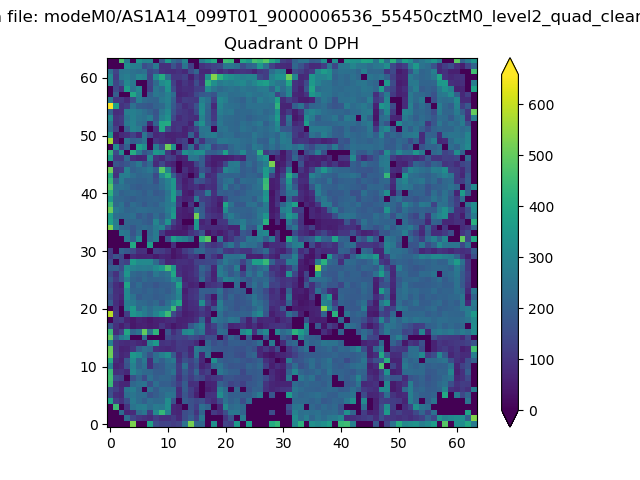 |
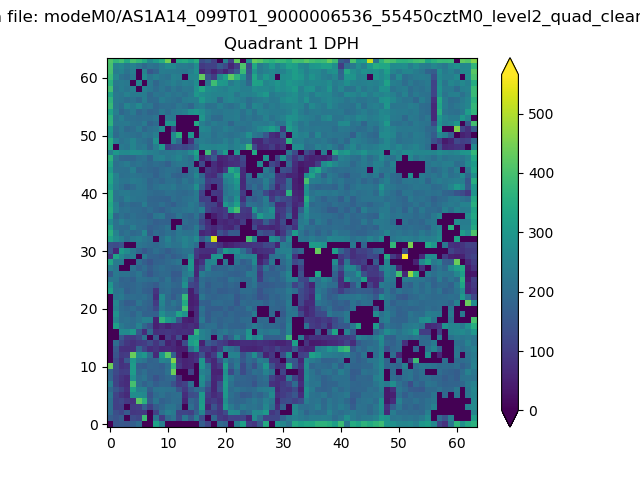 |
Quadrant B |
|---|---|---|---|
| Quadrant D | 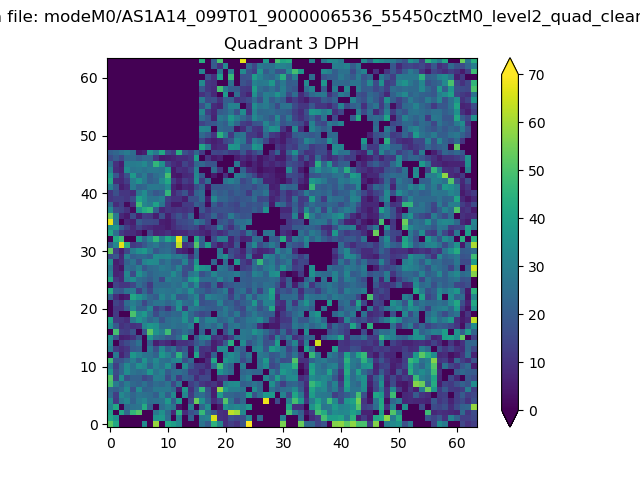 |
 |
Quadrant C |
| Plot type | Count rate plots | Images |
|---|---|---|
| Comparison with Poisson distribution Blue bars denote a histogram of data divided into 1 sec bins. Red curve is a Poisson curve with rate = median count rate of data. |
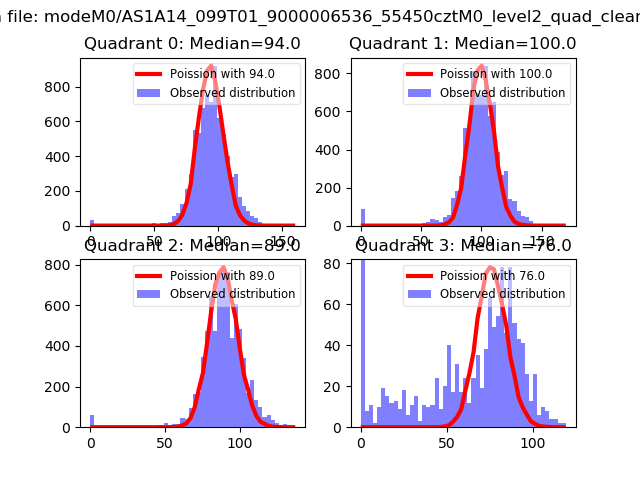 |
 |
| Quadrant-wise count rates Data is divided into 100 sec bins |
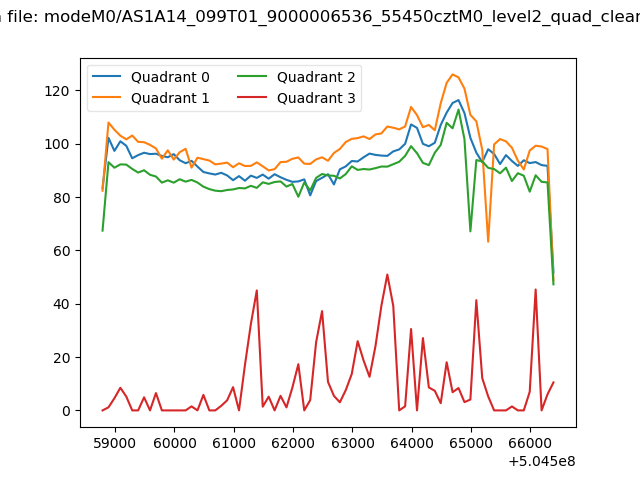 |
|
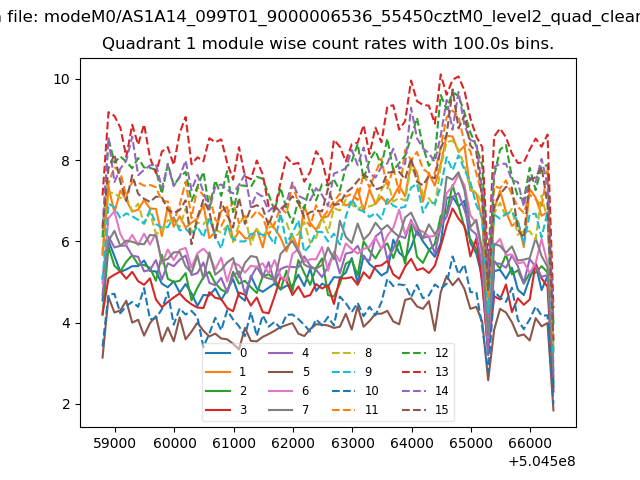
| Module-wise count rates for Quadrant A Data is divided into 100 sec bins |
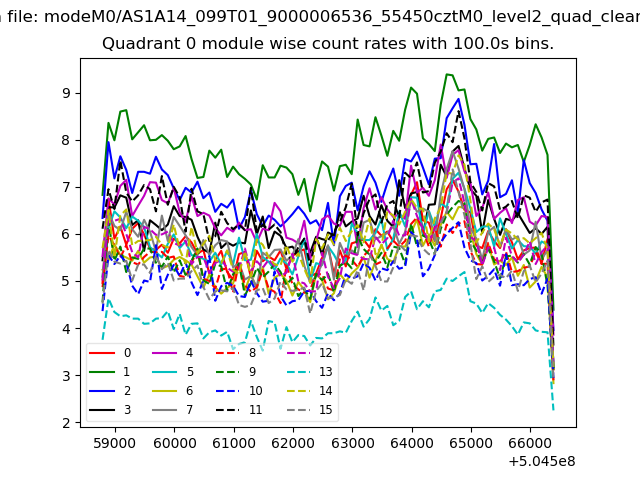 |
 |
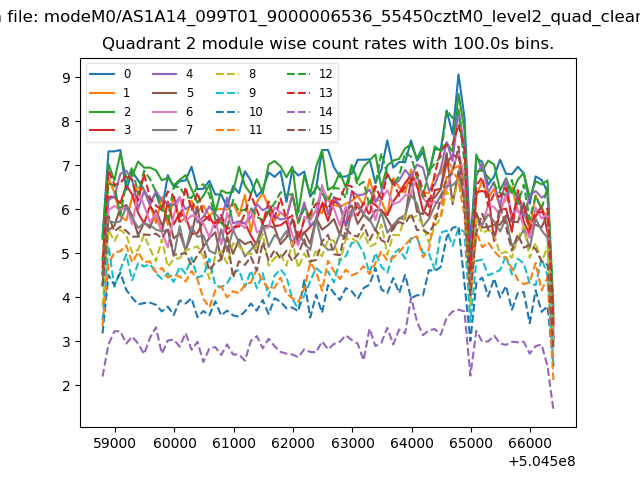
| Module-wise count rates for Quadrant B Data is divided into 100 sec bins |
 |
 |
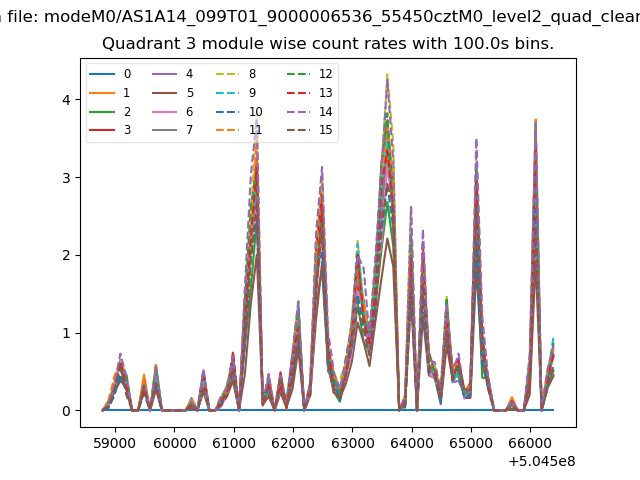
| Module-wise count rates for Quadrant C Data is divided into 100 sec bins |
 |
 |
| Module-wise count rates for Quadrant D Data is divided into 100 sec bins |
 |
 |
| Parameter | Plot |
|---|---|
| CZT HV Monitor |  |
| D_VDD | 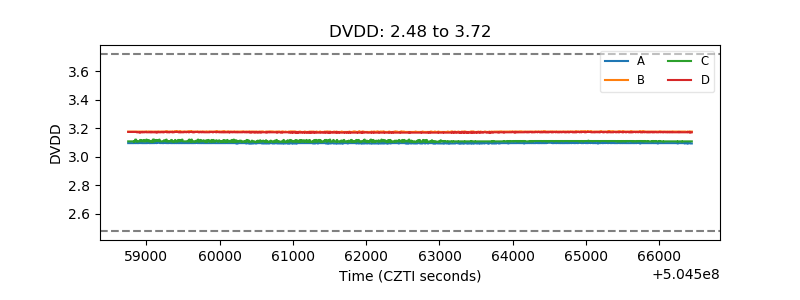 |
| Temperature 1 | 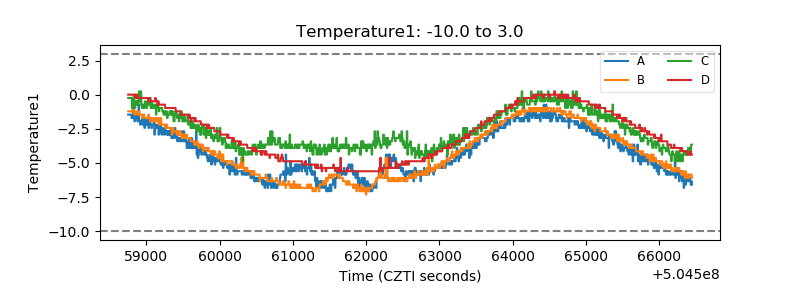 |
| Veto HV Monitor | 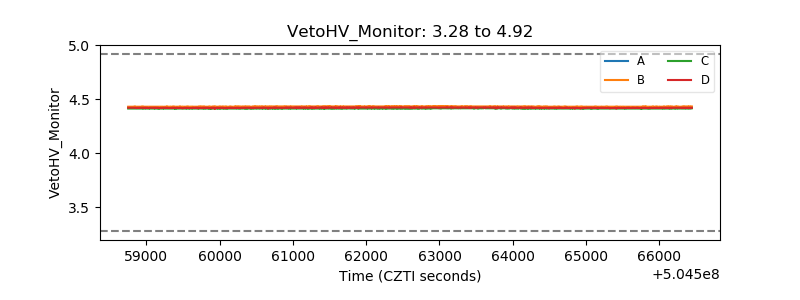 |
| Veto LLD | 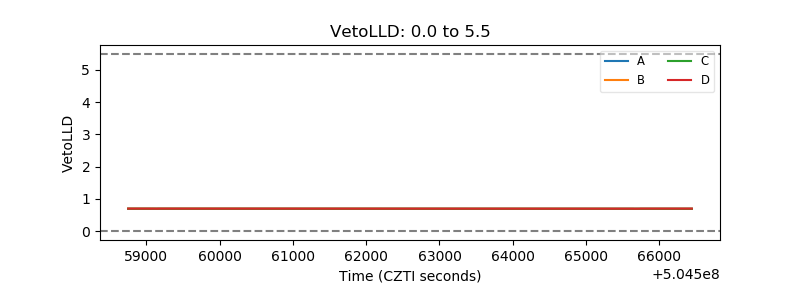 |
| Alpha Counter | 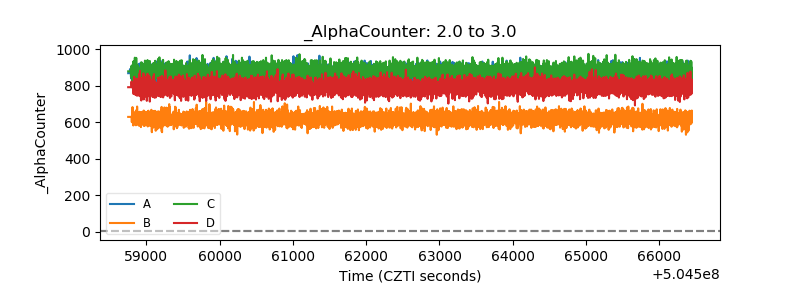 |
| _CPM_Rate | 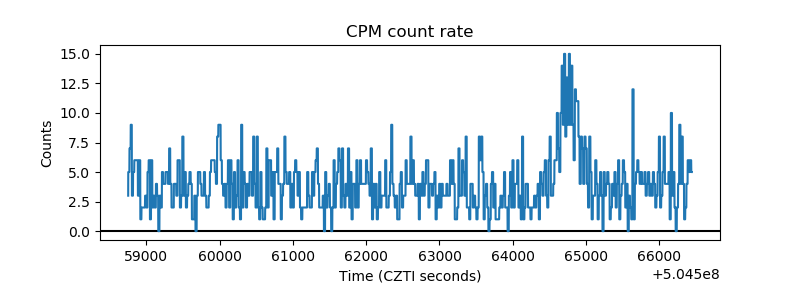 |
| CZT Counter | 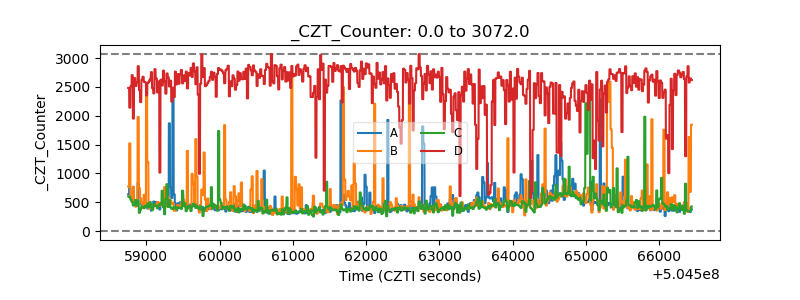 |
| +2.5 Volts monitor |  |
| +5 Volts monitor |  |
| _ROLL_ROT | 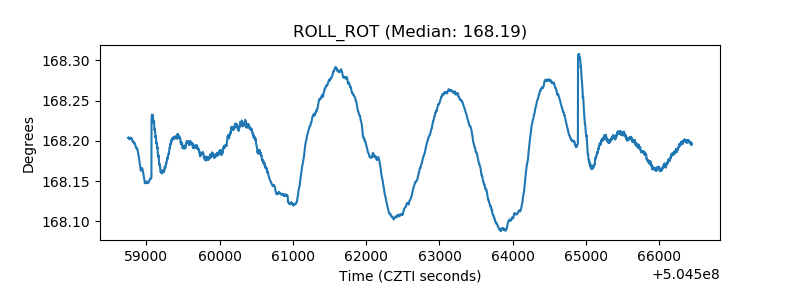 |
| _Roll_DEC | 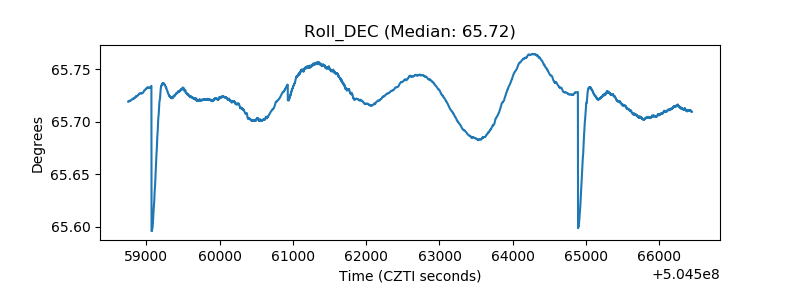 |
| _Roll_RA | 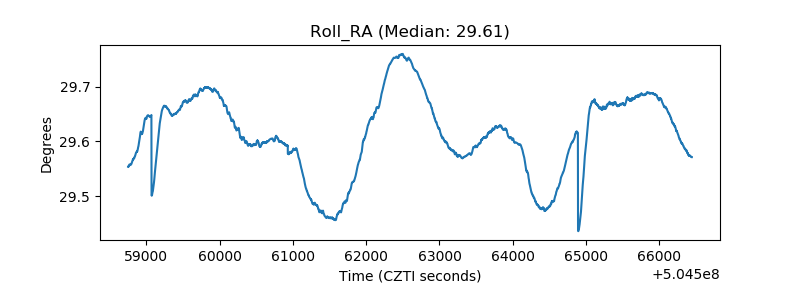 |
| Veto Counter | 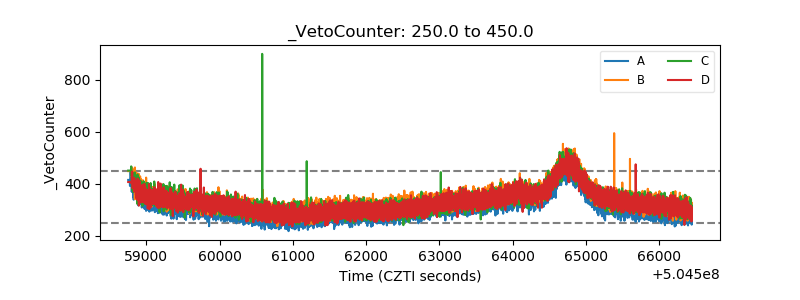 |