| Param | Original file | Final file |
|---|---|---|
| Filename | modeM0/AS1A14_099T01_9000006536_55451cztM0_level2.fits | modeM0/AS1A14_099T01_9000006536_55451cztM0_level2_quad_clean.evt |
| Size (bytes) | 731,479,680 | 80,225,280 |
| Size | 697.6 MB | 76.5 MB |
| Events in quadrant A | 3,121,203 | 619,348 |
| Events in quadrant B | 5,002,588 | 606,752 |
| Events in quadrant C | 2,973,022 | 591,039 |
| Events in quadrant D | 15,460,985 | 145,839 |
| Mode SS | |||
|---|---|---|---|
| Quadrant | BADHDUFLAG | Total packets | Discarded packets |
| A | 0 | 134 | 0 |
| B | 0 | 134 | 0 |
| C | 0 | 134 | 0 |
| D | 0 | 134 | 0 |
| Mode M0 | |||
|---|---|---|---|
| Quadrant | BADHDUFLAG | Total packets | Discarded packets |
| A | 0 | 14395 | 2 |
| B | 0 | 19542 | 0 |
| C | 0 | 13968 | 0 |
| D | 0 | 50531 | 12 |
| Quadrant | Total seconds | Saturated seconds | Saturation percentage |
|---|---|---|---|
| A | 6678 | 52 | 0.778676% |
| B | 6680 | 682 | 10.209581% |
| C | 6680 | 13 | 0.194611% |
| D | 6678 | 5142 | 76.999102% |
Noise dominated data is calculated using 1-second bins in cleaned event files. If a bin has >2000 counts, and if more than 50% of those come from <1% of pixels, then it is considered to be noise-dominated and hence unusable.
| Quadrant | # 1 sec bins | Bins with >0 counts | Bins with >2000 counts | High rate bins dominated by noise | Noise dominated (total time) | Noise dominated (detector-on time) | Marked lightcurve |
|---|---|---|---|---|---|---|---|
| A | 6678 | 6678 | 44 | 44 | 0.66% | 0.66% |  |
| B | 6681 | 6681 | 513 | 513 | 7.68% | 7.68% |  |
| C | 6681 | 6681 | 17 | 17 | 0.25% | 0.25% |  |
| D | 6678 | 6678 | 4962 | 4962 | 74.30% | 74.30% |  |
Top three noisy pixels from each quadrant. If the there are fewer than three noisy pixels in the level2.evt file, extra rows are filled as -1
| Pixel properties | Quadrant properties | ||||||
|---|---|---|---|---|---|---|---|
| Quadrant | DetID | PixID | Counts | Sigma | Mean | Median | Sigma |
| A | 0 | 8 | 292547 | 1674.12 | 689 | 670 | 174.3 |
| A | 3 | 78 | 41647 | 235.03 | 689 | 670 | 174.3 |
| A | 4 | 159 | 37503 | 211.26 | 689 | 670 | 174.3 |
| B | 12 | 32 | 1503671 | 10699.04 | 654 | 631 | 140.5 |
| B | 0 | 171 | 439792 | 3126.07 | 654 | 631 | 140.5 |
| B | 5 | 185 | 142252 | 1008.1 | 654 | 631 | 140.5 |
| C | 12 | 252 | 139275 | 749.82 | 674 | 668 | 184.9 |
| C | 13 | 3 | 40437 | 215.14 | 674 | 668 | 184.9 |
| C | 11 | 244 | 37062 | 196.88 | 674 | 668 | 184.9 |
| D | 2 | 62 | 12366636 | 110200.0 | 387 | 370 | 112.2 |
| D | 2 | 153 | 526330 | 4687.01 | 387 | 370 | 112.2 |
| D | 6 | 239 | 386031 | 3436.76 | 387 | 370 | 112.2 |
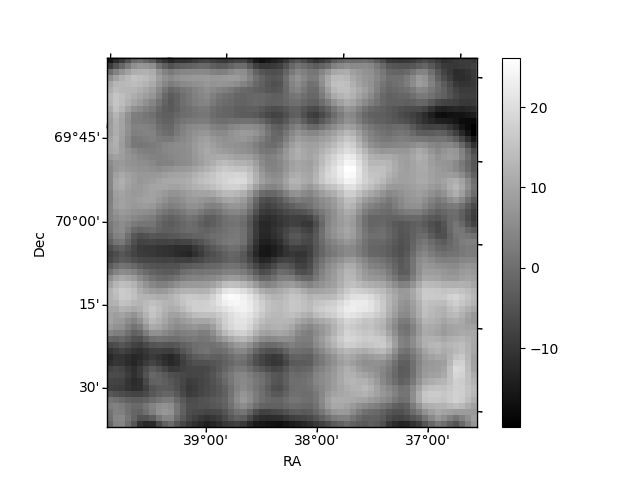
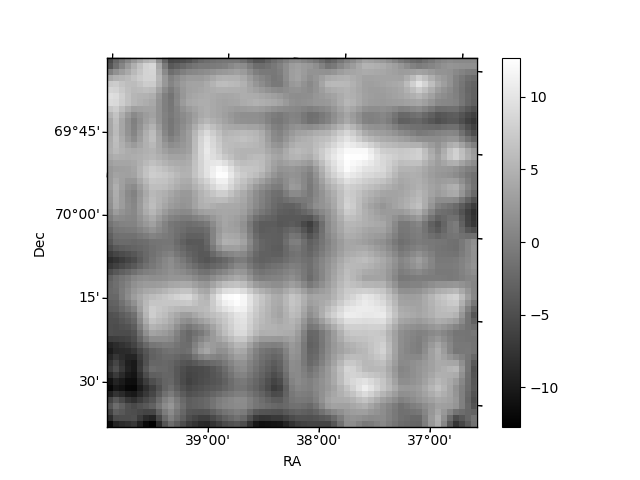
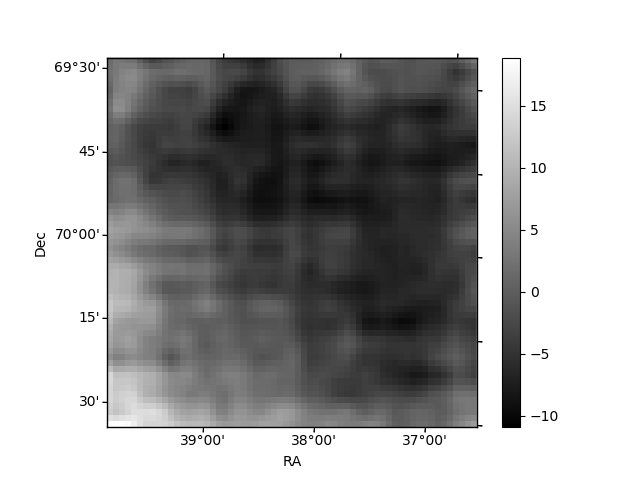
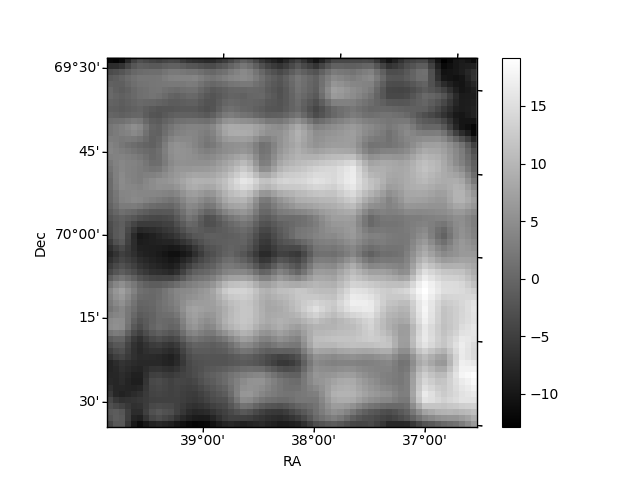
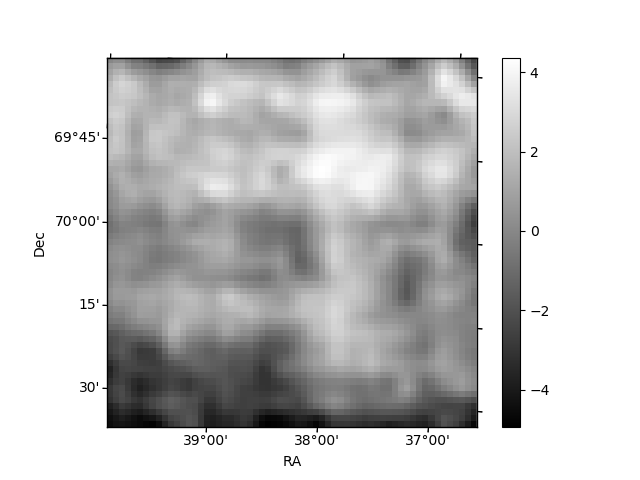
Histogram calculated using DETX and DETY for each event in the final _common_clean file
| Quadrant A | 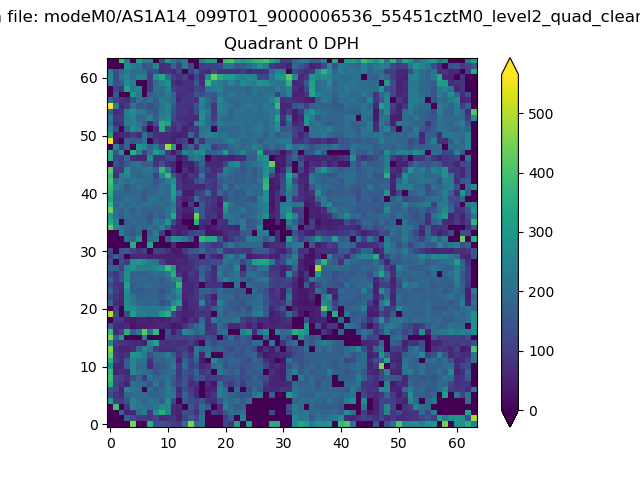 |
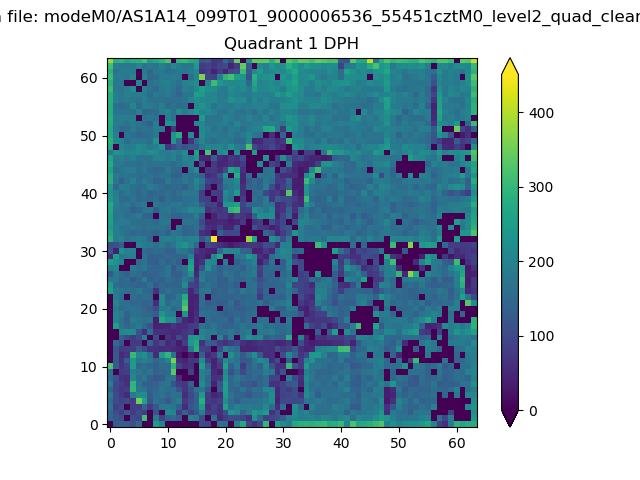 |
Quadrant B |
|---|---|---|---|
| Quadrant D | 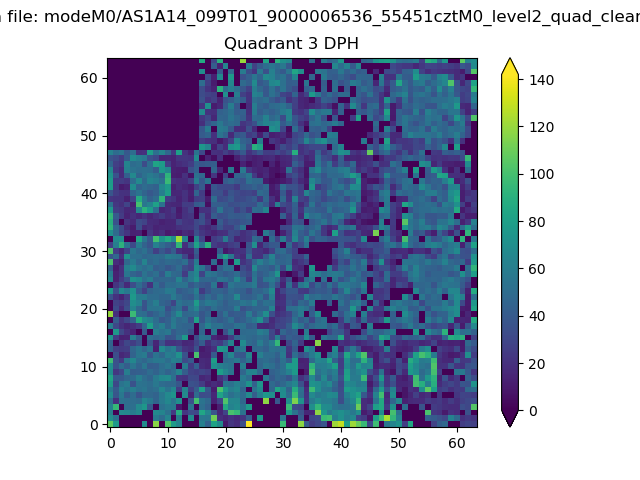 |
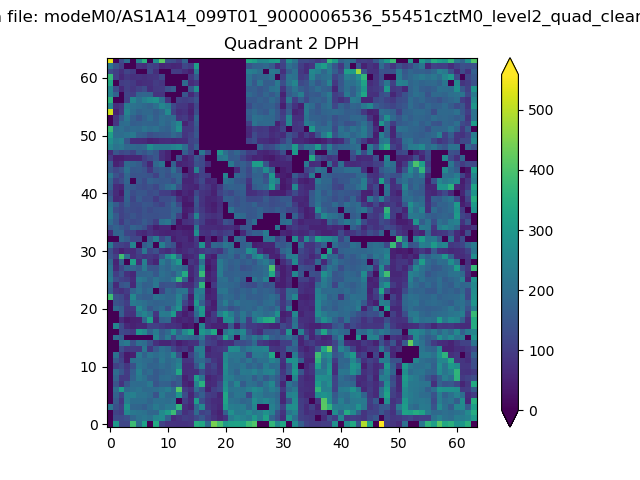 |
Quadrant C |
| Plot type | Count rate plots | Images |
|---|---|---|
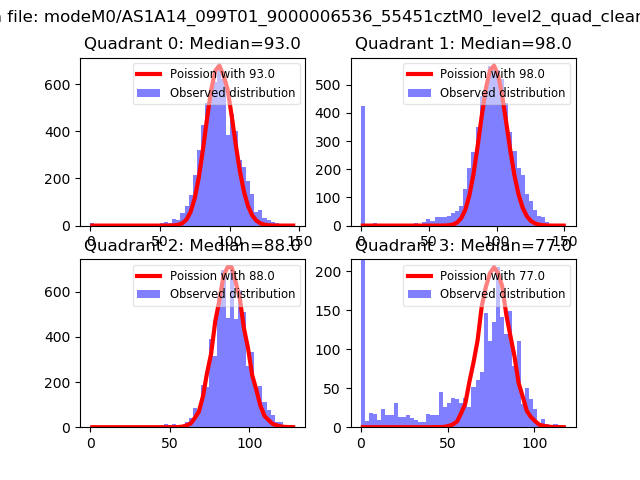
| Comparison with Poisson distribution Blue bars denote a histogram of data divided into 1 sec bins. Red curve is a Poisson curve with rate = median count rate of data. |
 |
 |
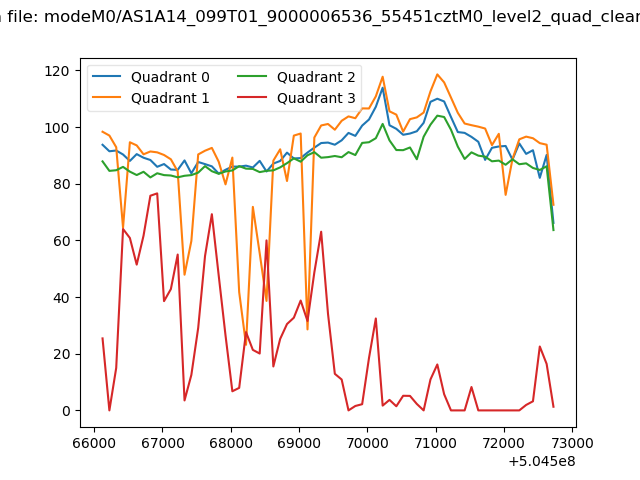
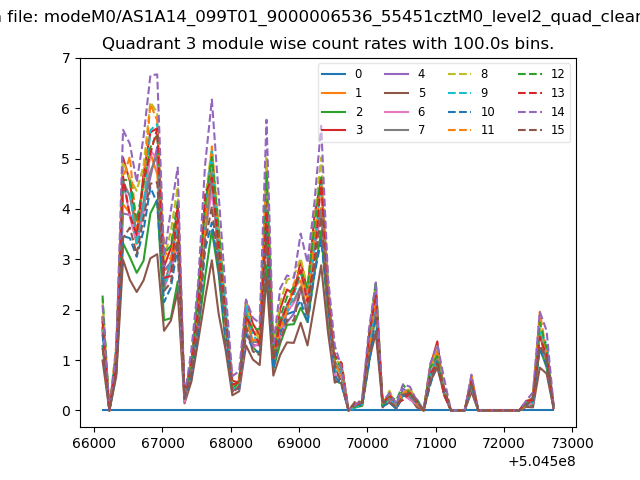
| Quadrant-wise count rates Data is divided into 100 sec bins |
 |
|
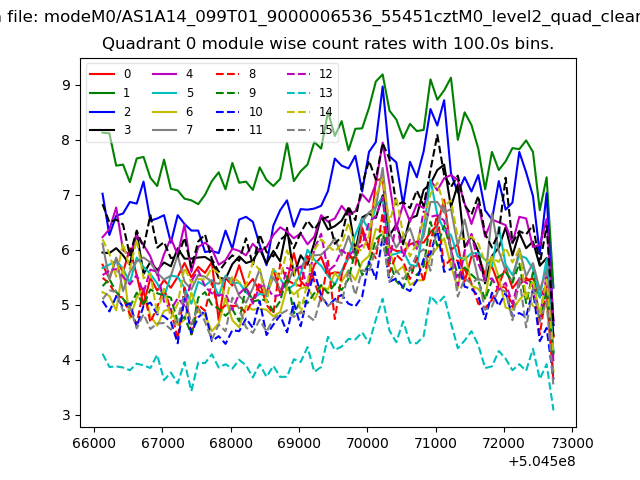
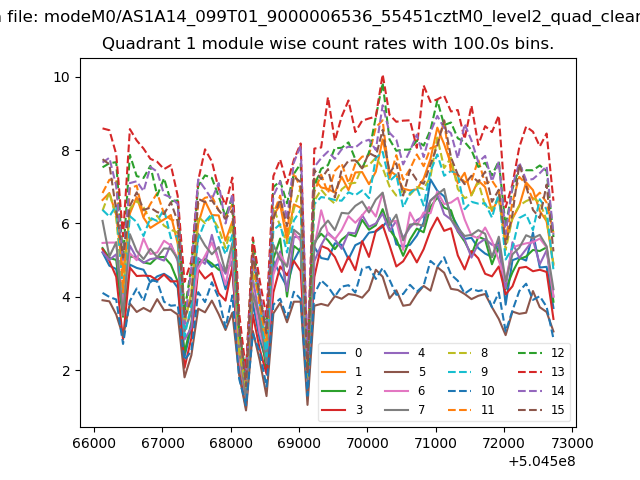
| Module-wise count rates for Quadrant A Data is divided into 100 sec bins |
 |
 |
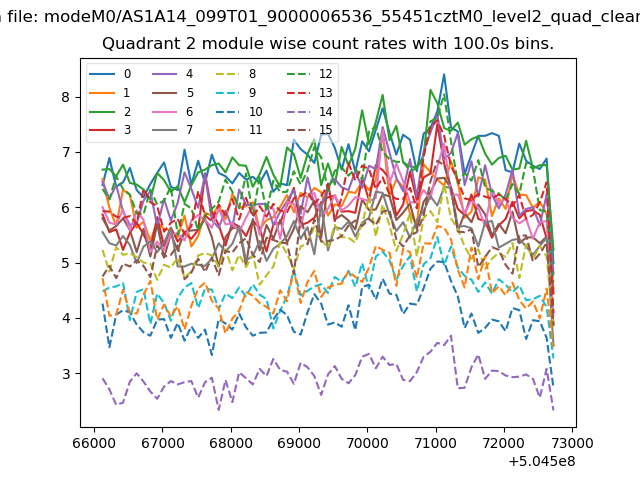
| Module-wise count rates for Quadrant B Data is divided into 100 sec bins |
 |
 |
| Module-wise count rates for Quadrant C Data is divided into 100 sec bins |
 |
 |
| Module-wise count rates for Quadrant D Data is divided into 100 sec bins |
 |
 |
| Parameter | Plot |
|---|---|
| CZT HV Monitor | 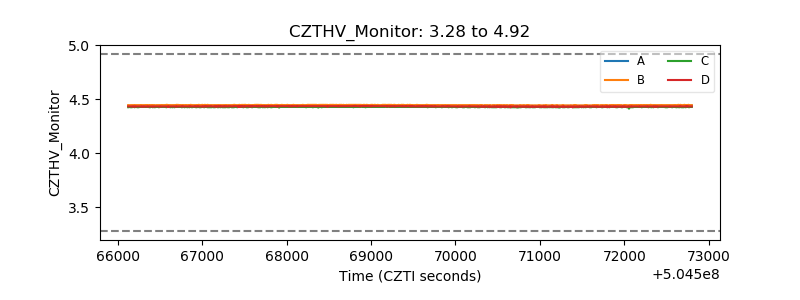 |
| D_VDD | 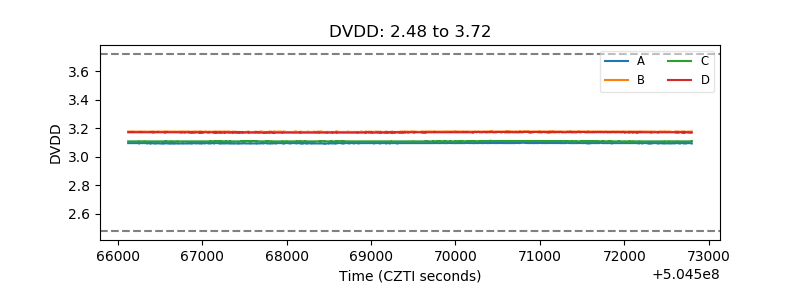 |
| Temperature 1 | 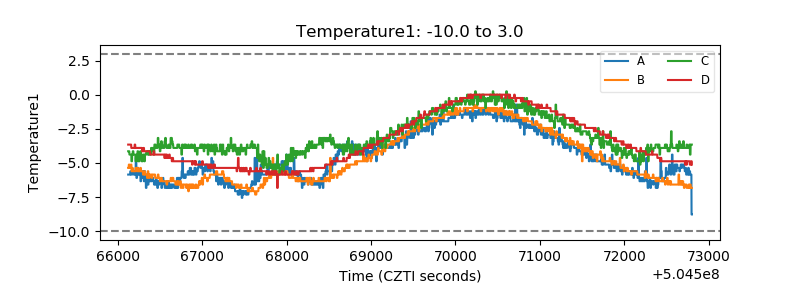 |
| Veto HV Monitor | 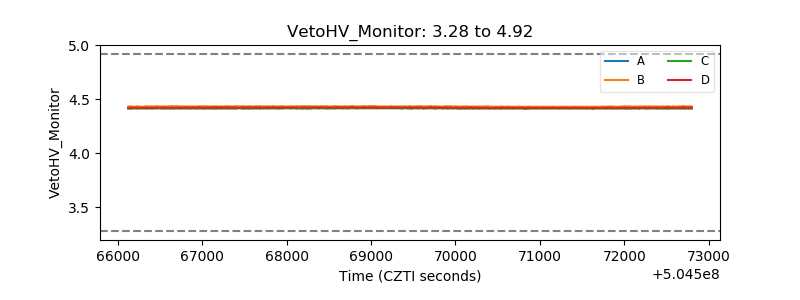 |
| Veto LLD | 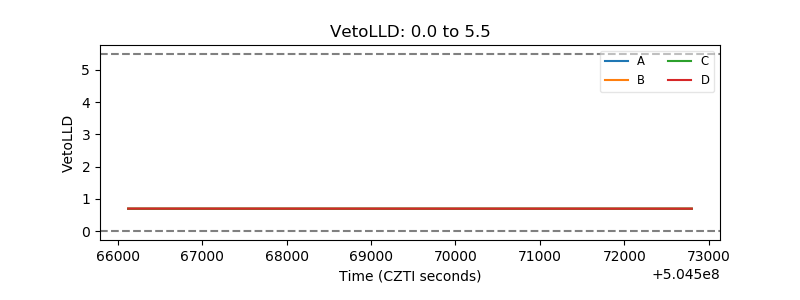 |
| Alpha Counter | 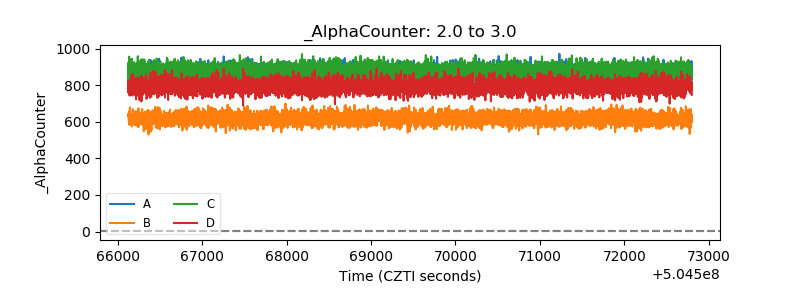 |
| _CPM_Rate | 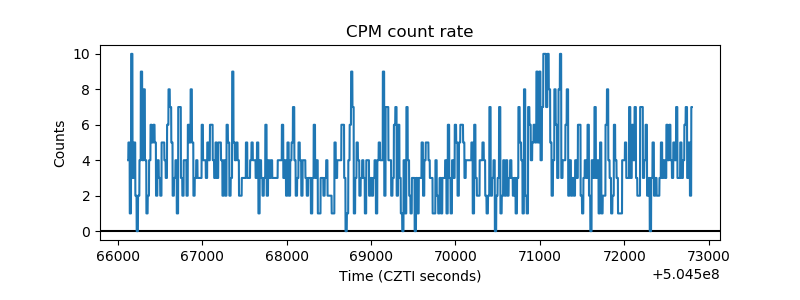 |
| CZT Counter | 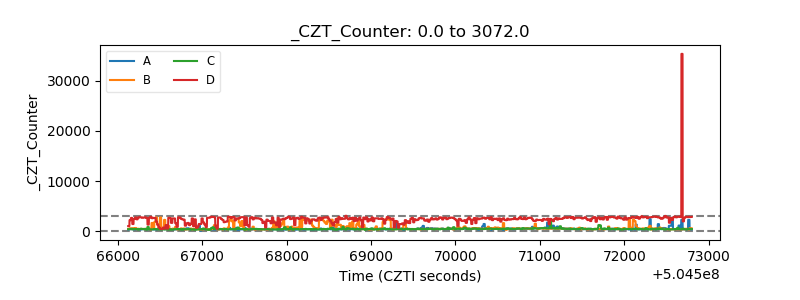 |
| +2.5 Volts monitor | 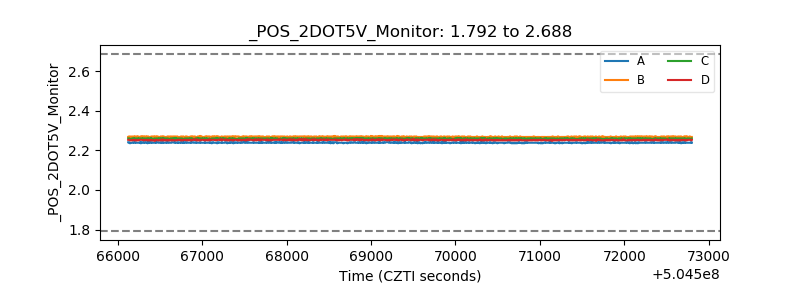 |
| +5 Volts monitor | 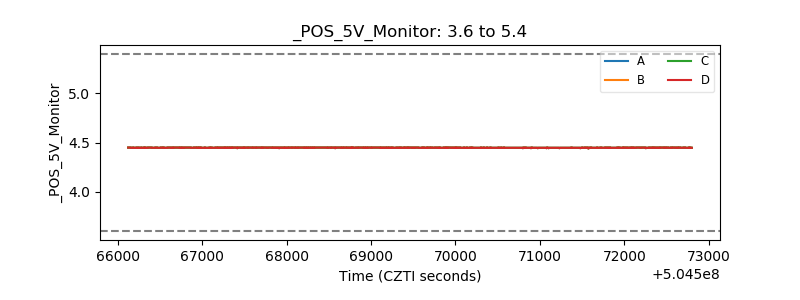 |
| _ROLL_ROT | 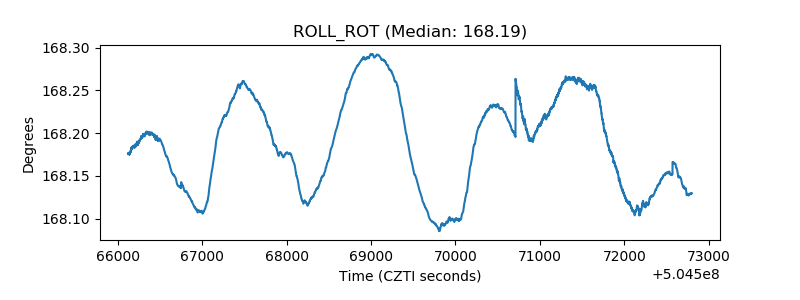 |
| _Roll_DEC | 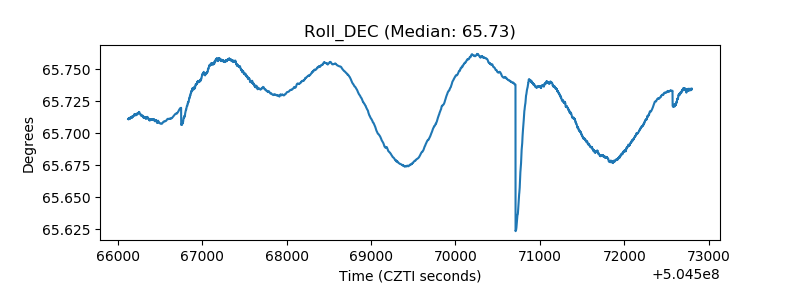 |
| _Roll_RA | 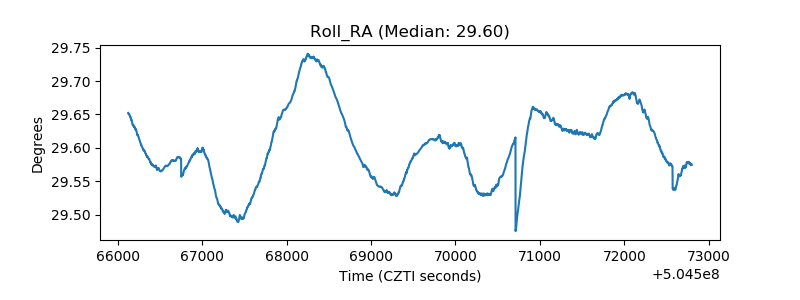 |
| Veto Counter | 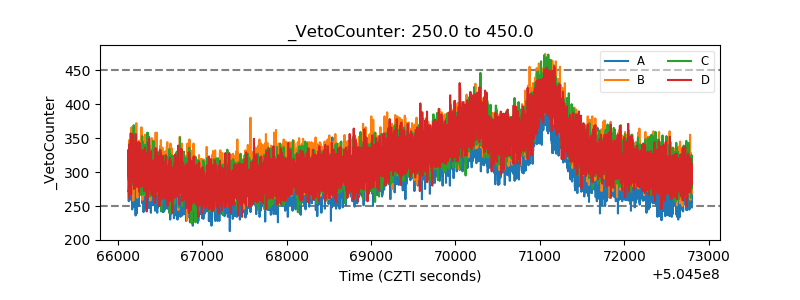 |