| Param | Original file | Final file |
|---|---|---|
| Filename | modeM0/AS1A14_099T01_9000006536_55452cztM0_level2.fits | modeM0/AS1A14_099T01_9000006536_55452cztM0_level2_quad_clean.evt |
| Size (bytes) | 795,464,640 | 99,169,920 |
| Size | 758.6 MB | 94.6 MB |
| Events in quadrant A | 4,197,056 | 727,074 |
| Events in quadrant B | 4,137,285 | 784,943 |
| Events in quadrant C | 3,532,431 | 706,327 |
| Events in quadrant D | 16,960,483 | 230,792 |
| Mode SS | |||
|---|---|---|---|
| Quadrant | BADHDUFLAG | Total packets | Discarded packets |
| A | 0 | 162 | 2 |
| B | 0 | 162 | 4 |
| C | 0 | 162 | 2 |
| D | 0 | 161 | 2 |
| Mode M0 | |||
|---|---|---|---|
| Quadrant | BADHDUFLAG | Total packets | Discarded packets |
| A | 0 | 18958 | 409 |
| B | 0 | 18442 | 289 |
| C | 0 | 17072 | 356 |
| D | 0 | 57288 | 1541 |
| Quadrant | Total seconds | Saturated seconds | Saturation percentage |
|---|---|---|---|
| A | 7971 | 195 | 2.446368% |
| B | 7984 | 156 | 1.953908% |
| C | 7976 | 19 | 0.238215% |
| D | 7902 | 5427 | 68.678815% |
Noise dominated data is calculated using 1-second bins in cleaned event files. If a bin has >2000 counts, and if more than 50% of those come from <1% of pixels, then it is considered to be noise-dominated and hence unusable.
| Quadrant | # 1 sec bins | Bins with >0 counts | Bins with >2000 counts | High rate bins dominated by noise | Noise dominated (total time) | Noise dominated (detector-on time) | Marked lightcurve |
|---|---|---|---|---|---|---|---|
| A | 8086 | 8016 | 159 | 159 | 1.97% | 1.98% | 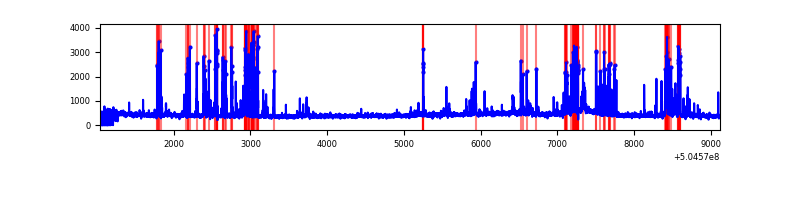 |
| B | 8081 | 8020 | 114 | 114 | 1.41% | 1.42% | 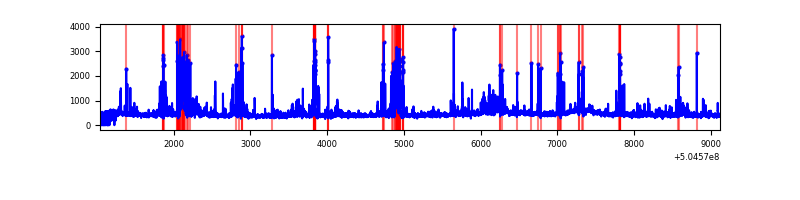 |
| C | 8068 | 8011 | 15 | 15 | 0.19% | 0.19% | 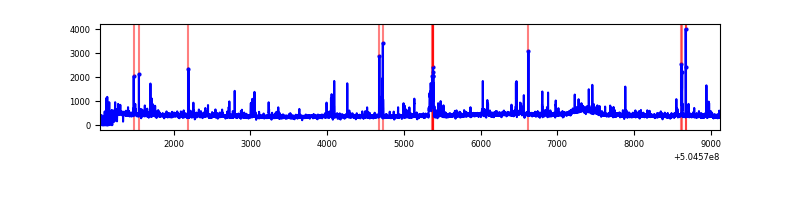 |
| D | 7968 | 7902 | 5196 | 5196 | 65.21% | 65.76% | 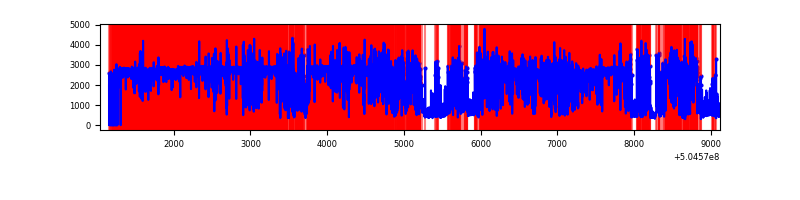 |
Top three noisy pixels from each quadrant. If the there are fewer than three noisy pixels in the level2.evt file, extra rows are filled as -1
| Pixel properties | Quadrant properties | ||||||
|---|---|---|---|---|---|---|---|
| Quadrant | DetID | PixID | Counts | Sigma | Mean | Median | Sigma |
| A | 0 | 8 | 601761 | 2927.27 | 821 | 797 | 205.3 |
| A | 4 | 159 | 279208 | 1356.13 | 821 | 797 | 205.3 |
| A | 3 | 78 | 66852 | 321.75 | 821 | 797 | 205.3 |
| B | 0 | 171 | 253724 | 1424.28 | 823 | 791 | 177.6 |
| B | 12 | 32 | 171389 | 960.65 | 823 | 791 | 177.6 |
| B | 5 | 236 | 110638 | 618.56 | 823 | 791 | 177.6 |
| C | 13 | 3 | 113535 | 505.48 | 817 | 809 | 223.0 |
| C | 9 | 38 | 59511 | 263.23 | 817 | 809 | 223.0 |
| C | 12 | 252 | 52534 | 231.94 | 817 | 809 | 223.0 |
| D | 2 | 62 | 12661207 | 94558.09 | 463 | 440 | 133.9 |
| D | 6 | 239 | 1254203 | 9363.84 | 463 | 440 | 133.9 |
| D | 2 | 153 | 650284 | 4853.42 | 463 | 440 | 133.9 |
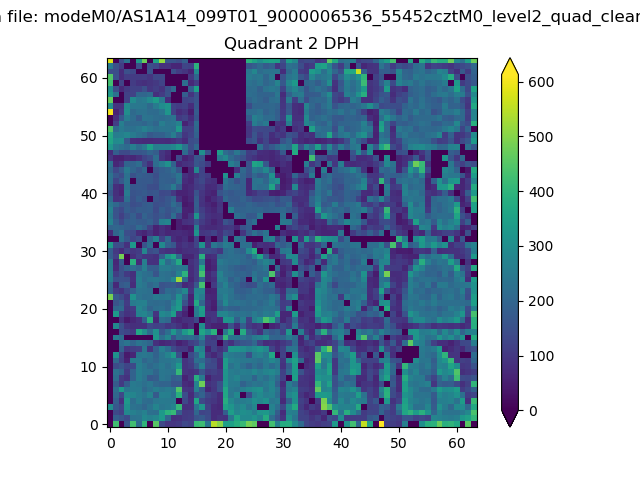
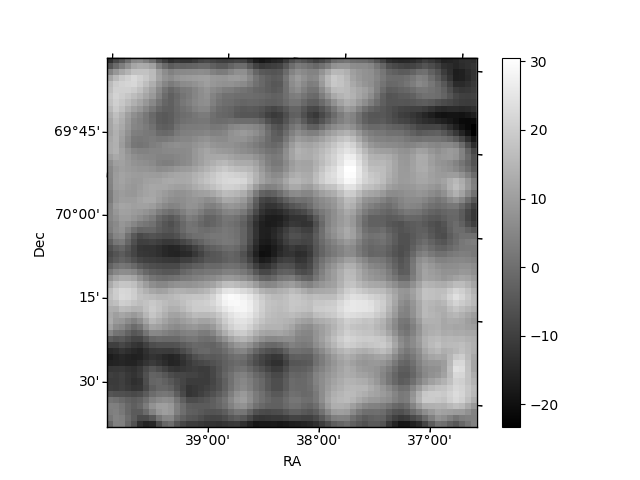
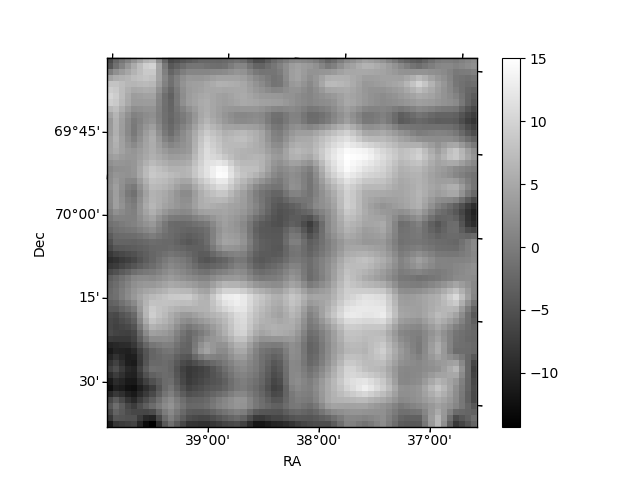
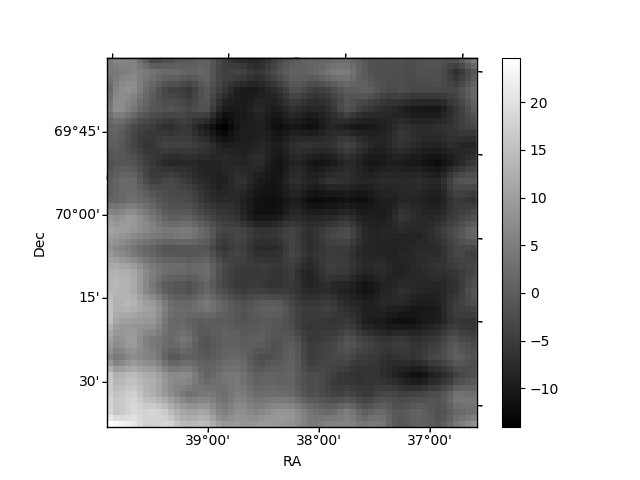
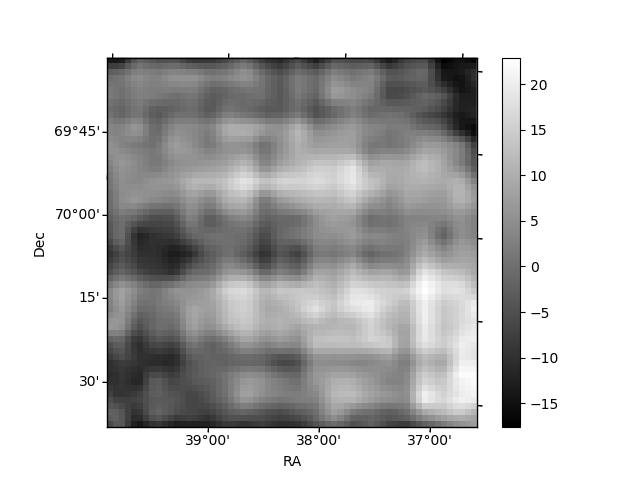
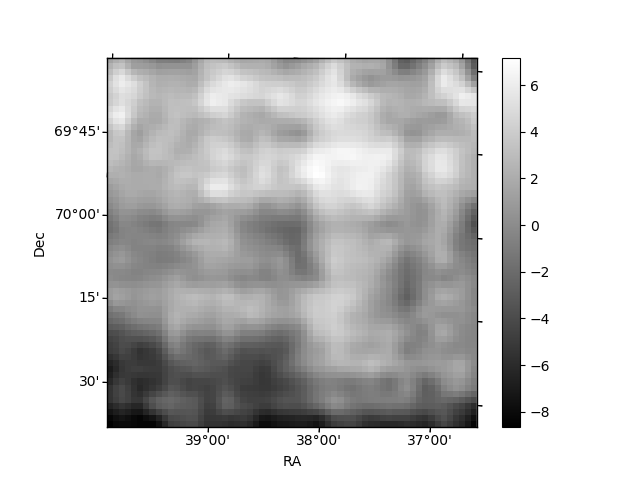
Histogram calculated using DETX and DETY for each event in the final _common_clean file
| Quadrant A | 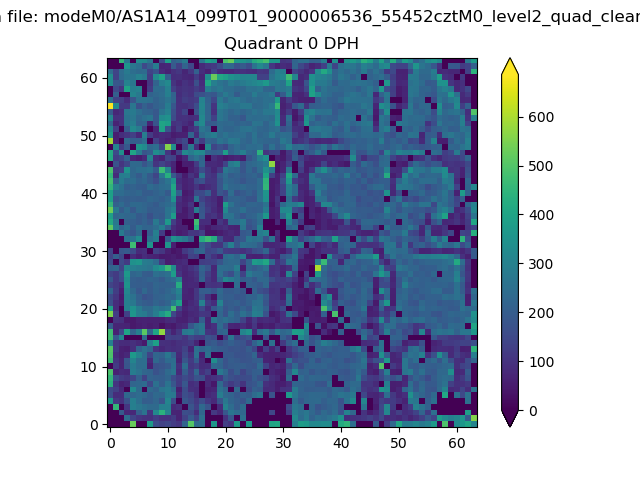 |
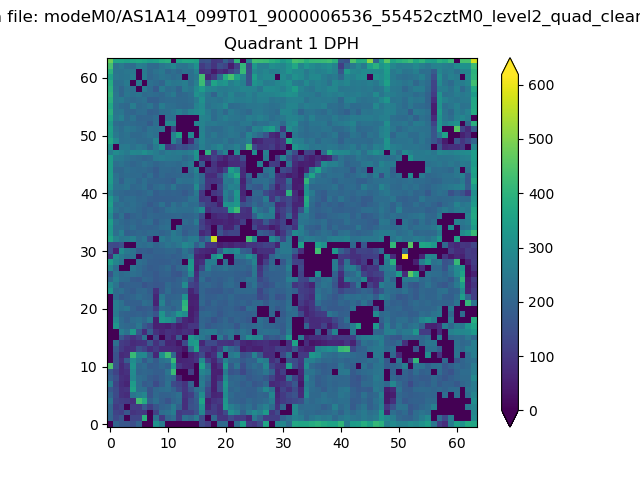 |
Quadrant B |
|---|---|---|---|
| Quadrant D | 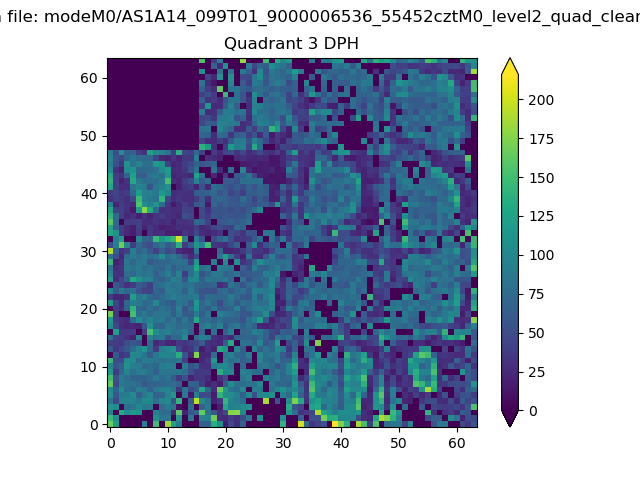 |
 |
Quadrant C |
| Plot type | Count rate plots | Images |
|---|---|---|
| Comparison with Poisson distribution Blue bars denote a histogram of data divided into 1 sec bins. Red curve is a Poisson curve with rate = median count rate of data. |
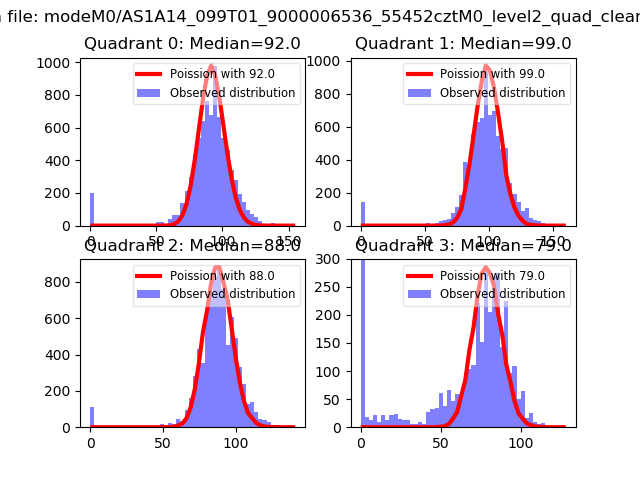 |
 |
| Quadrant-wise count rates Data is divided into 100 sec bins |
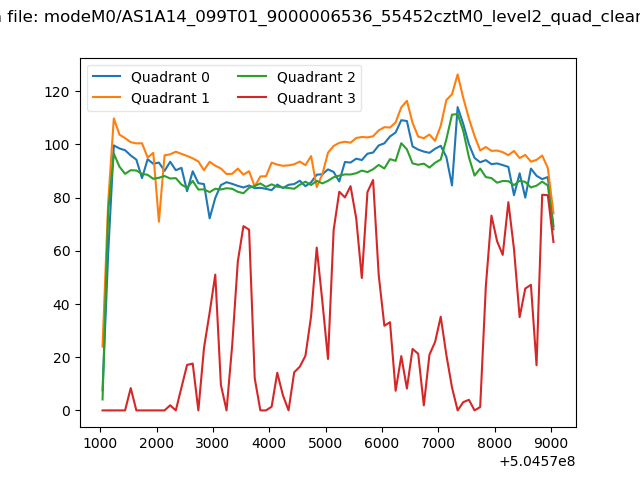 |
|
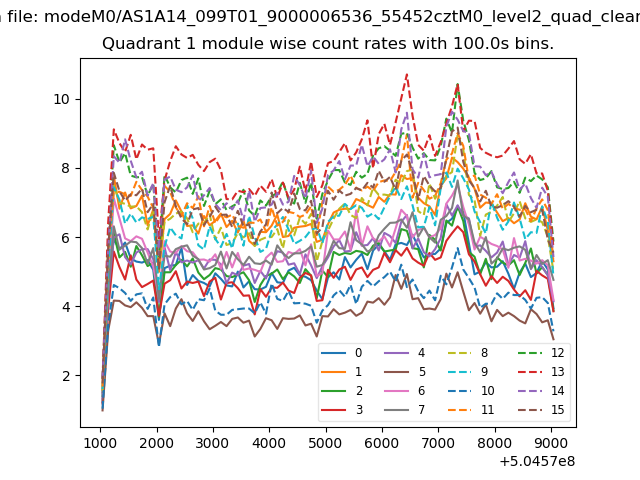
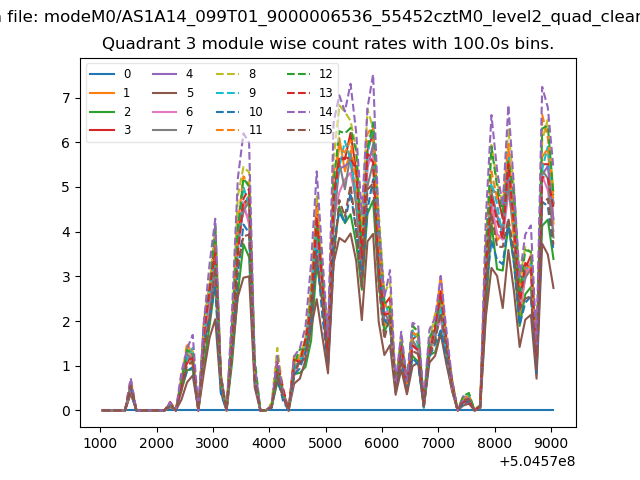
| Module-wise count rates for Quadrant A Data is divided into 100 sec bins |
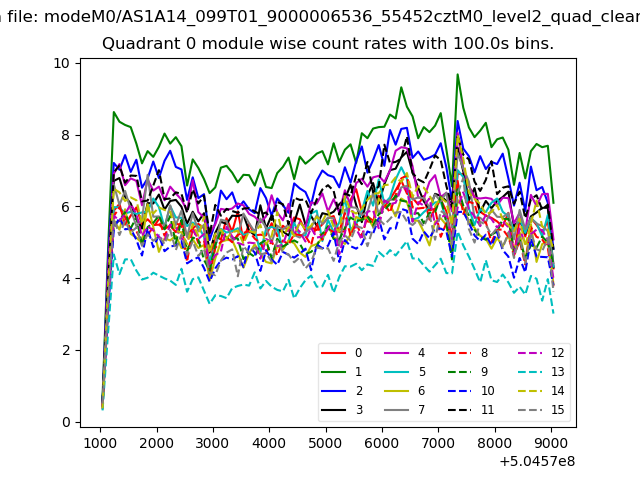 |
 |
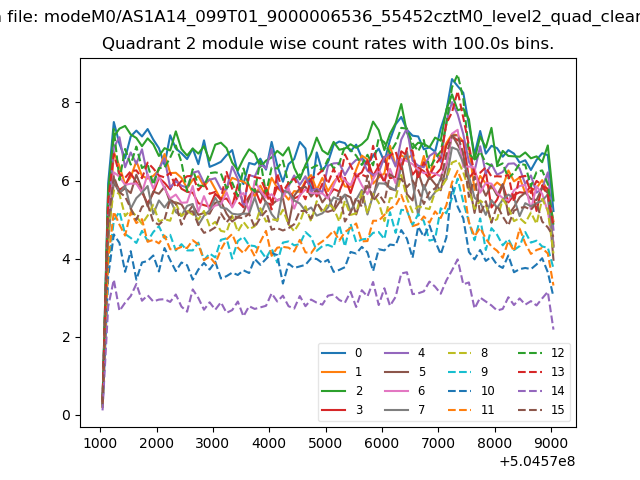
| Module-wise count rates for Quadrant B Data is divided into 100 sec bins |
 |
 |
| Module-wise count rates for Quadrant C Data is divided into 100 sec bins |
 |
 |
| Module-wise count rates for Quadrant D Data is divided into 100 sec bins |
 |
 |
| Parameter | Plot |
|---|---|
| CZT HV Monitor | 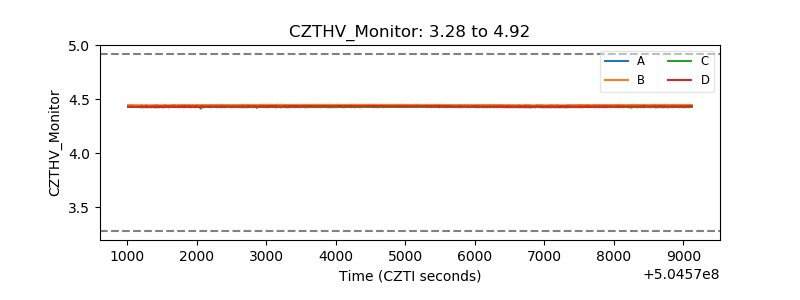 |
| D_VDD | 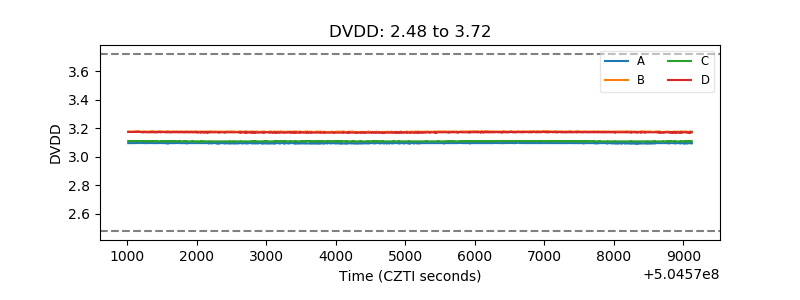 |
| Temperature 1 | 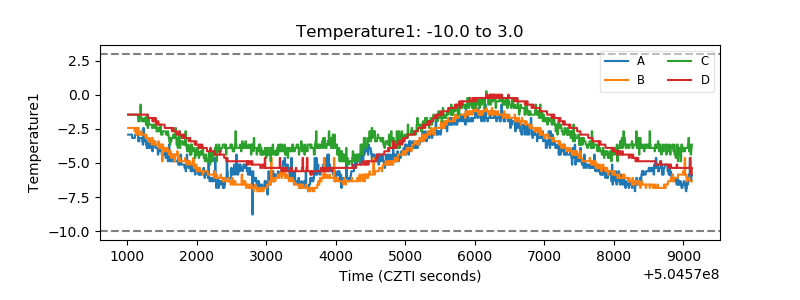 |
| Veto HV Monitor | 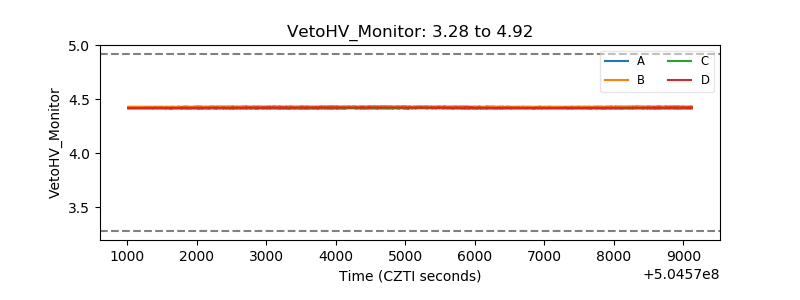 |
| Veto LLD | 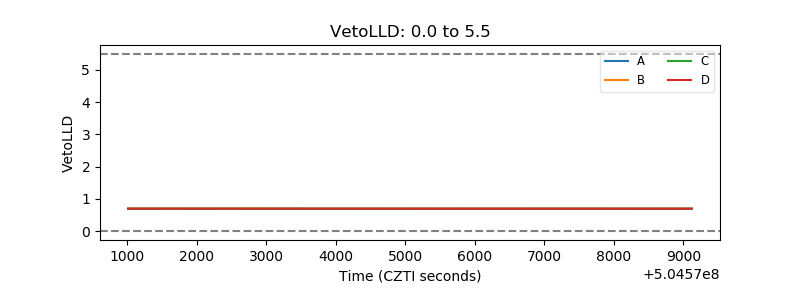 |
| Alpha Counter | 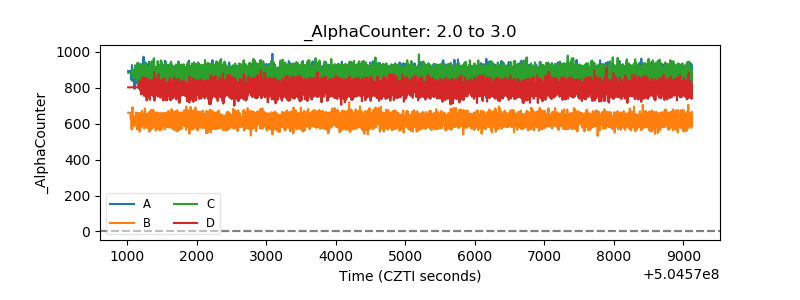 |
| _CPM_Rate | 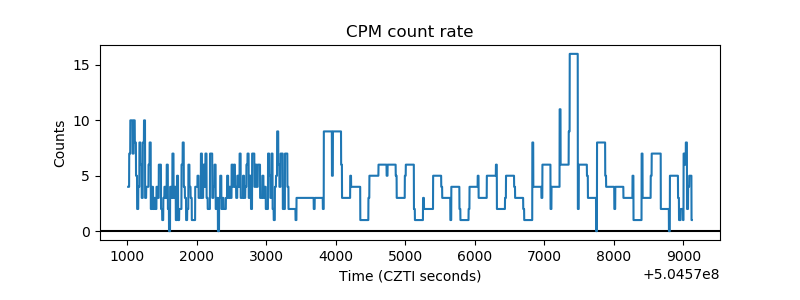 |
| CZT Counter | 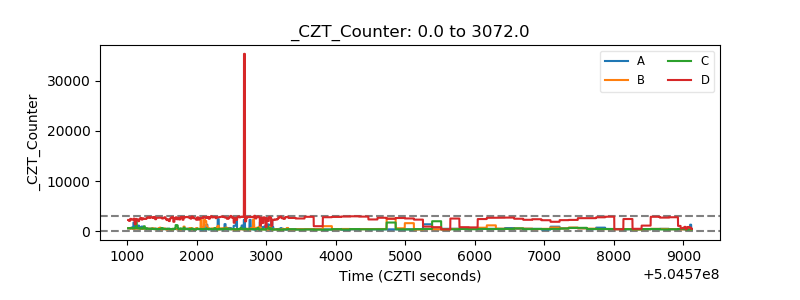 |
| +2.5 Volts monitor | 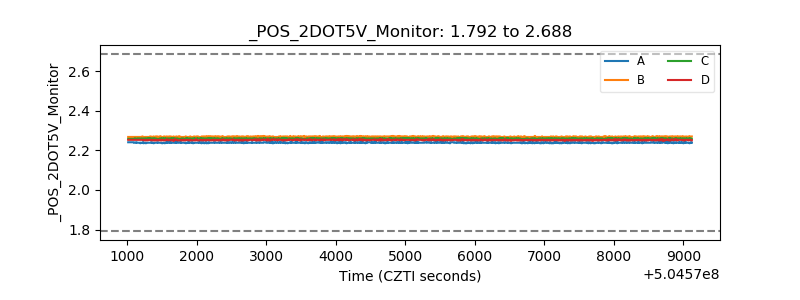 |
| +5 Volts monitor | 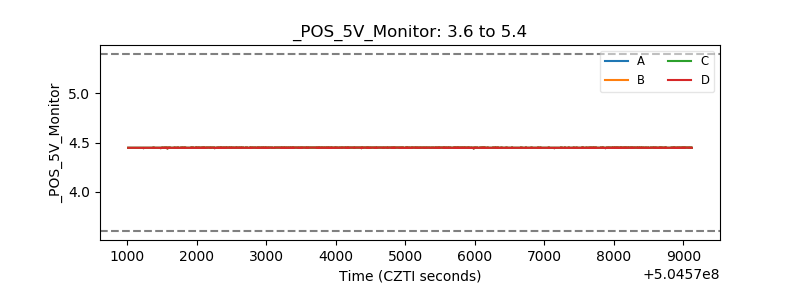 |
| _ROLL_ROT | 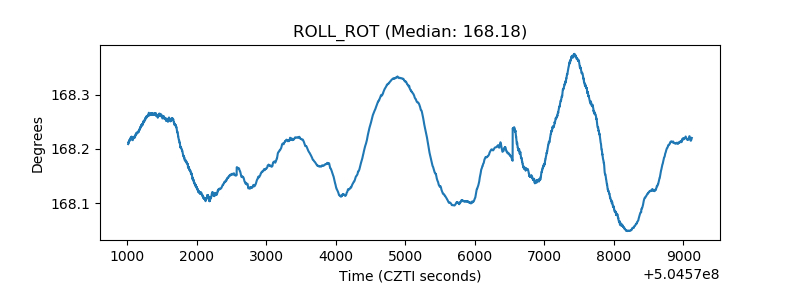 |
| _Roll_DEC | 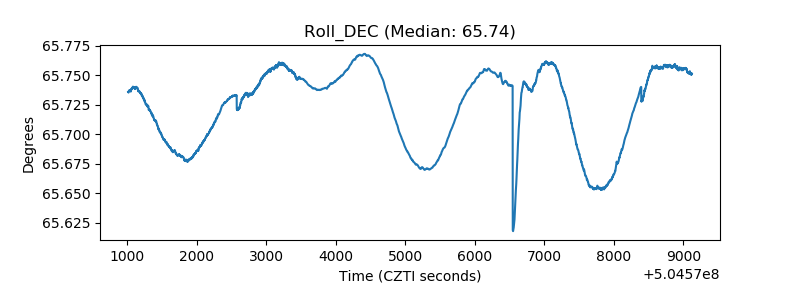 |
| _Roll_RA | 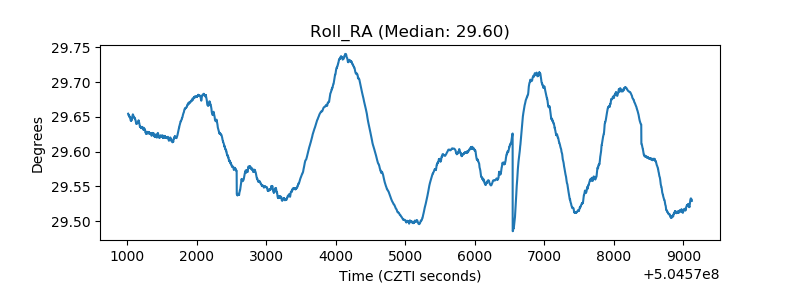 |
| Veto Counter | 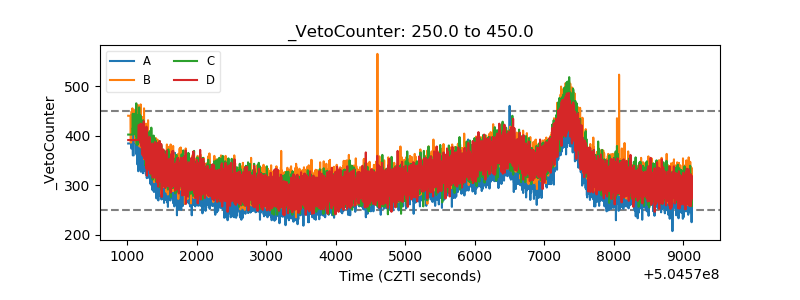 |