| Param | Original file | Final file |
|---|---|---|
| Filename | modeM0/AS1A14_099T01_9000006536_55455cztM0_level2.fits | modeM0/AS1A14_099T01_9000006536_55455cztM0_level2_quad_clean.evt |
| Size (bytes) | 1,998,406,080 | 228,504,960 |
| Size | 1.9 GB | 217.9 MB |
| Events in quadrant A | 8,980,815 | 1,725,942 |
| Events in quadrant B | 11,084,886 | 1,781,142 |
| Events in quadrant C | 9,650,222 | 1,650,926 |
| Events in quadrant D | 42,781,651 | 445,125 |
| Mode M9 | |||
|---|---|---|---|
| Quadrant | BADHDUFLAG | Total packets | Discarded packets |
| A | 0 | 15 | 0 |
| B | 0 | 15 | 0 |
| C | 0 | 15 | 0 |
| D | 0 | 15 | 0 |
| Mode SS | |||
|---|---|---|---|
| Quadrant | BADHDUFLAG | Total packets | Discarded packets |
| A | 0 | 388 | 0 |
| B | 0 | 388 | 0 |
| C | 0 | 388 | 0 |
| D | 0 | 388 | 0 |
| Mode M0 | |||
|---|---|---|---|
| Quadrant | BADHDUFLAG | Total packets | Discarded packets |
| A | 0 | 41315 | 5 |
| B | 0 | 47102 | 5 |
| C | 0 | 43310 | 5 |
| D | 0 | 140016 | 18 |
| Quadrant | Total seconds | Saturated seconds | Saturation percentage |
|---|---|---|---|
| A | 19086 | 269 | 1.409410% |
| B | 19086 | 1021 | 5.349471% |
| C | 19086 | 414 | 2.169129% |
| D | 19084 | 14020 | 73.464682% |
Noise dominated data is calculated using 1-second bins in cleaned event files. If a bin has >2000 counts, and if more than 50% of those come from <1% of pixels, then it is considered to be noise-dominated and hence unusable.
| Quadrant | # 1 sec bins | Bins with >0 counts | Bins with >2000 counts | High rate bins dominated by noise | Noise dominated (total time) | Noise dominated (detector-on time) | Marked lightcurve |
|---|---|---|---|---|---|---|---|
| A | 20551 | 19092 | 121 | 121 | 0.59% | 0.63% | 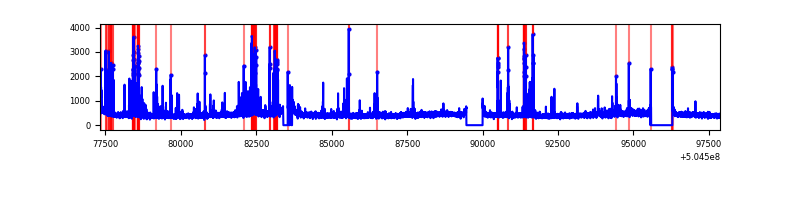 |
| B | 20551 | 19091 | 660 | 660 | 3.21% | 3.46% | 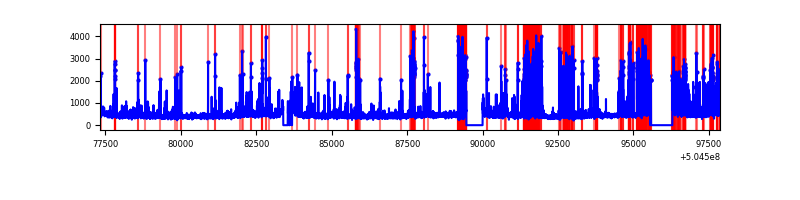 |
| C | 20551 | 19092 | 260 | 260 | 1.27% | 1.36% | 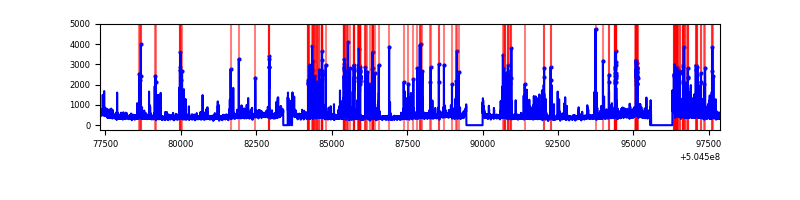 |
| D | 20550 | 19083 | 13749 | 13749 | 66.91% | 72.05% | 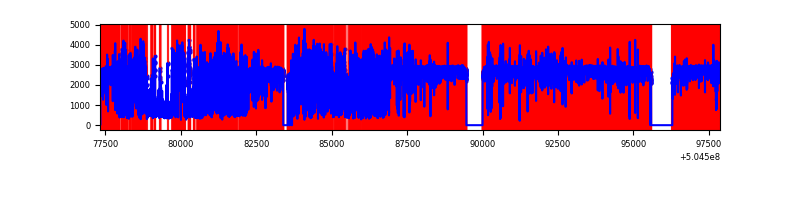 |
Top three noisy pixels from each quadrant. If the there are fewer than three noisy pixels in the level2.evt file, extra rows are filled as -1
| Pixel properties | Quadrant properties | ||||||
|---|---|---|---|---|---|---|---|
| Quadrant | DetID | PixID | Counts | Sigma | Mean | Median | Sigma |
| A | 4 | 159 | 491726 | 988.82 | 1998 | 1945 | 495.3 |
| A | 0 | 8 | 369629 | 742.32 | 1998 | 1945 | 495.3 |
| A | 3 | 78 | 192334 | 384.38 | 1998 | 1945 | 495.3 |
| B | 5 | 236 | 1991376 | 4818.86 | 1945 | 1871 | 412.9 |
| B | 0 | 171 | 945864 | 2286.48 | 1945 | 1871 | 412.9 |
| B | 10 | 247 | 140404 | 335.55 | 1945 | 1871 | 412.9 |
| C | 13 | 3 | 1477114 | 2774.19 | 1944 | 1922 | 531.8 |
| C | 1 | 16 | 176130 | 327.61 | 1944 | 1922 | 531.8 |
| C | 9 | 38 | 123138 | 227.95 | 1944 | 1922 | 531.8 |
| D | 2 | 62 | 36072781 | 118506.77 | 1059 | 1011 | 304.4 |
| D | 11 | 129 | 861230 | 2826.08 | 1059 | 1011 | 304.4 |
| D | 6 | 239 | 399561 | 1309.36 | 1059 | 1011 | 304.4 |
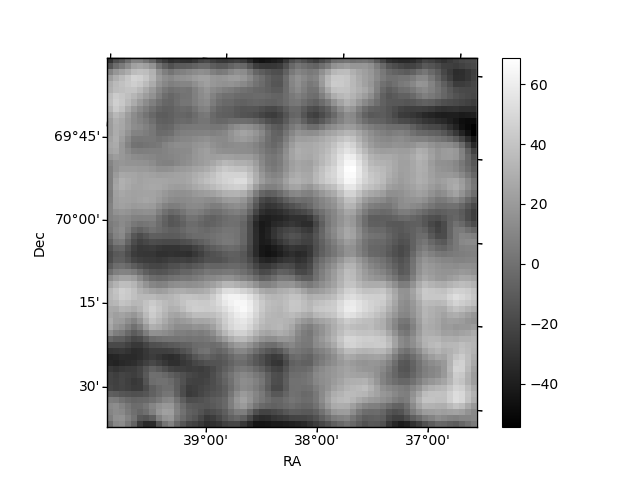
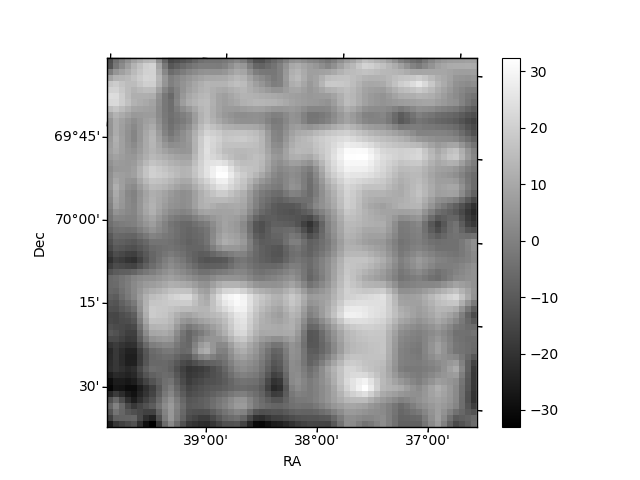
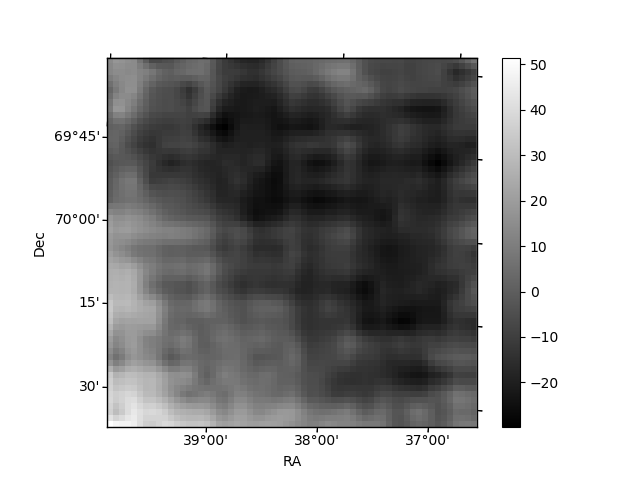
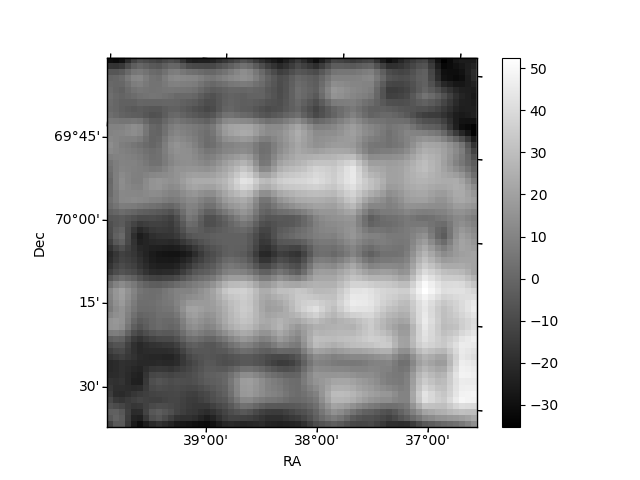
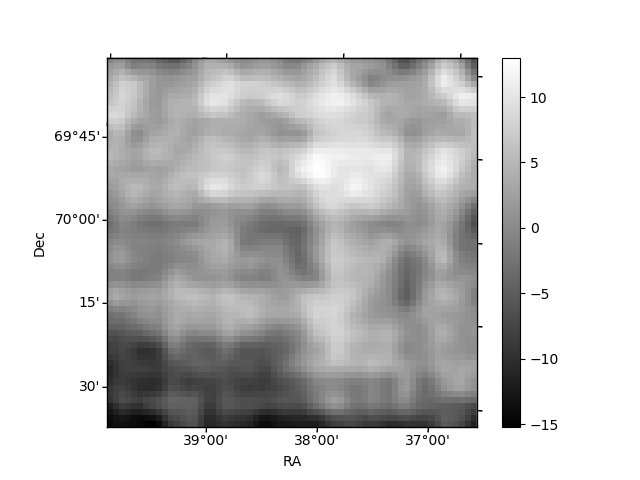
Histogram calculated using DETX and DETY for each event in the final _common_clean file
| Quadrant A | 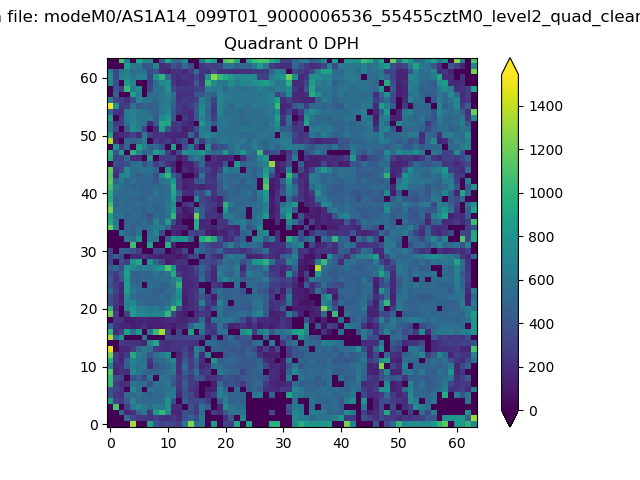 |
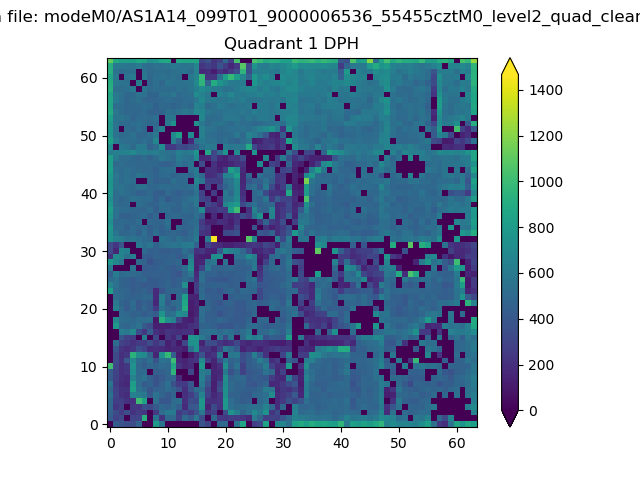 |
Quadrant B |
|---|---|---|---|
| Quadrant D | 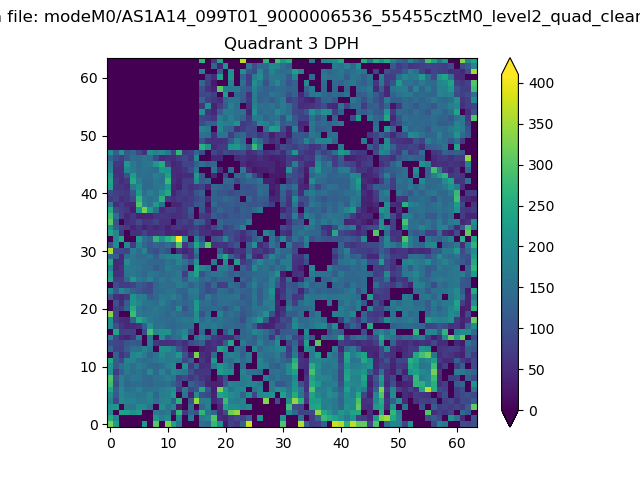 |
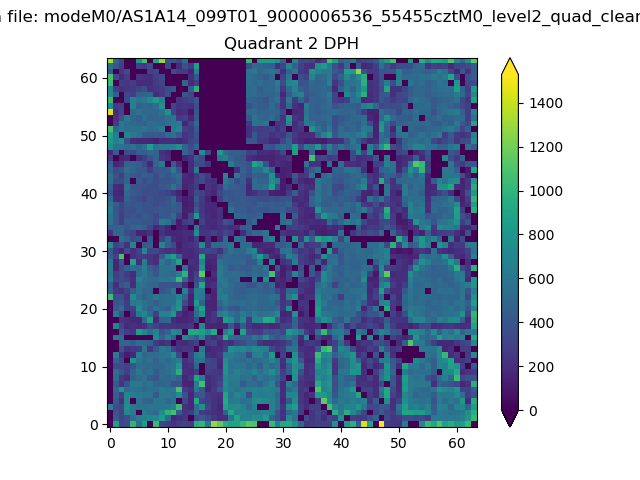 |
Quadrant C |
| Plot type | Count rate plots | Images |
|---|---|---|
| Comparison with Poisson distribution Blue bars denote a histogram of data divided into 1 sec bins. Red curve is a Poisson curve with rate = median count rate of data. |
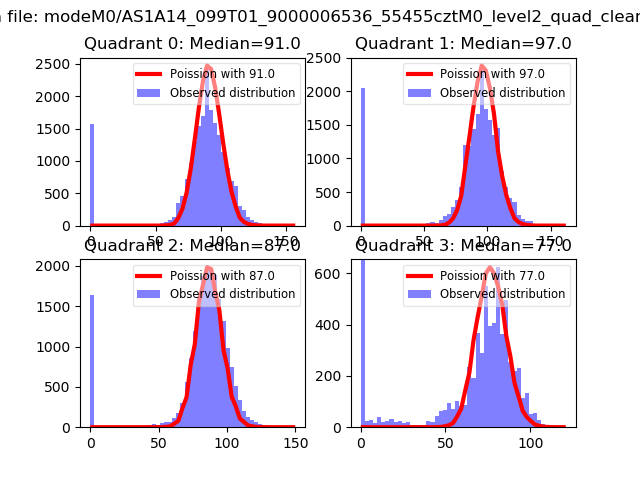 |
 |
| Quadrant-wise count rates Data is divided into 100 sec bins |
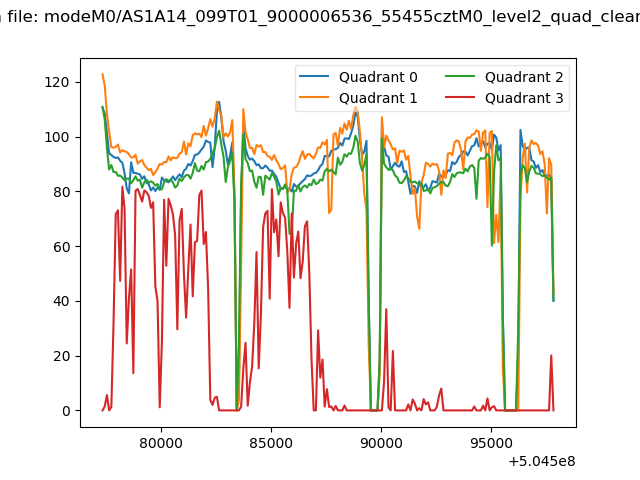 |
|
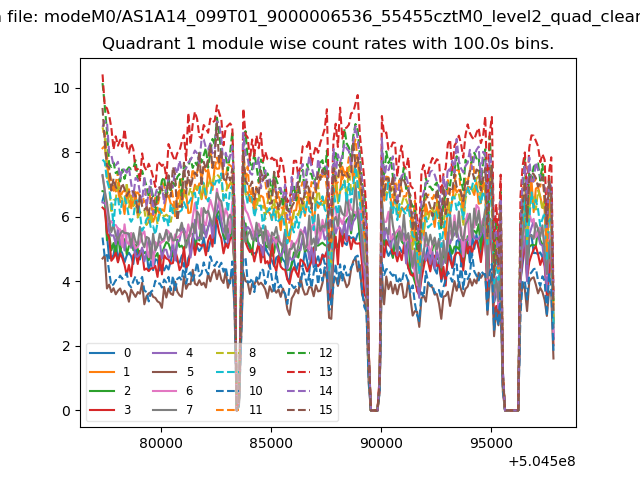
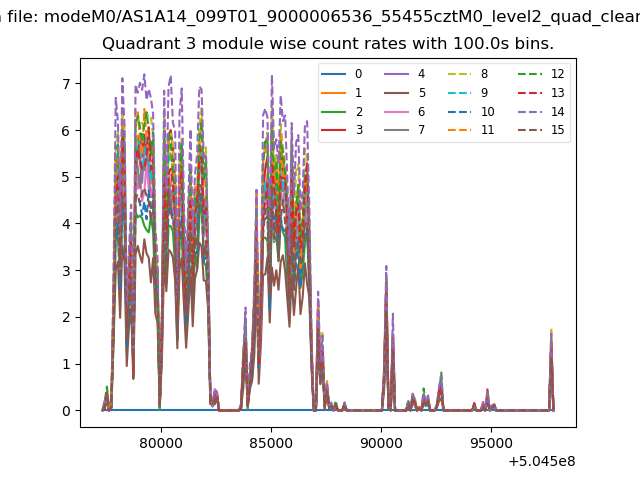
| Module-wise count rates for Quadrant A Data is divided into 100 sec bins |
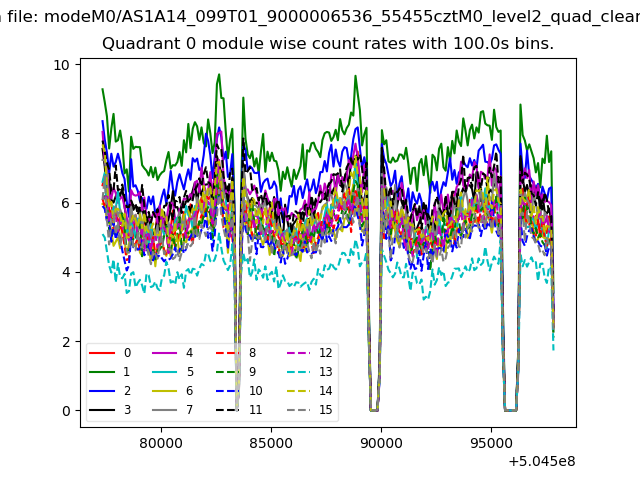 |
 |
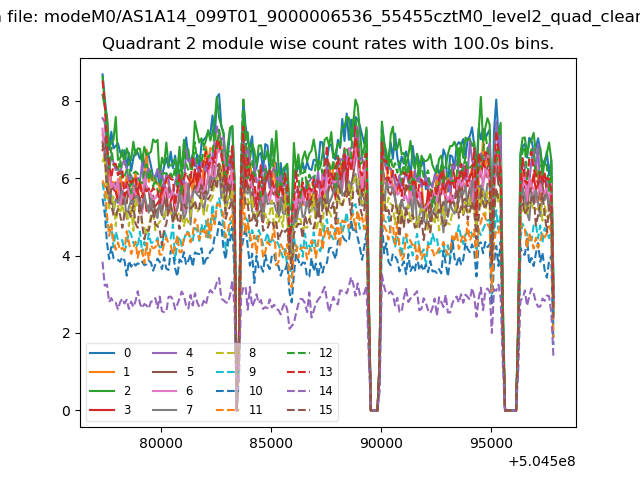
| Module-wise count rates for Quadrant B Data is divided into 100 sec bins |
 |
 |
| Module-wise count rates for Quadrant C Data is divided into 100 sec bins |
 |
 |
| Module-wise count rates for Quadrant D Data is divided into 100 sec bins |
 |
 |
| Parameter | Plot |
|---|---|
| CZT HV Monitor | 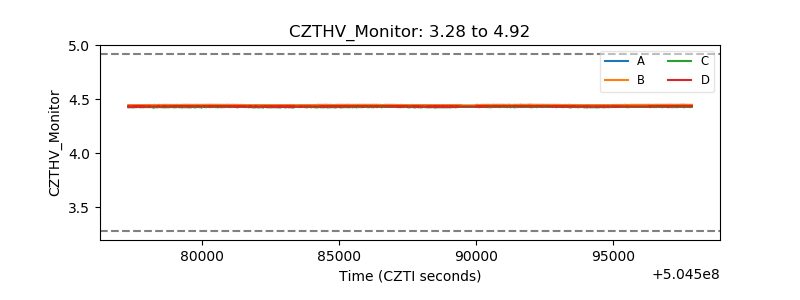 |
| D_VDD | 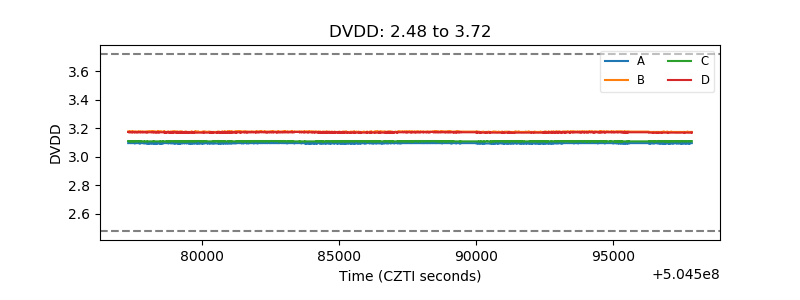 |
| Temperature 1 | 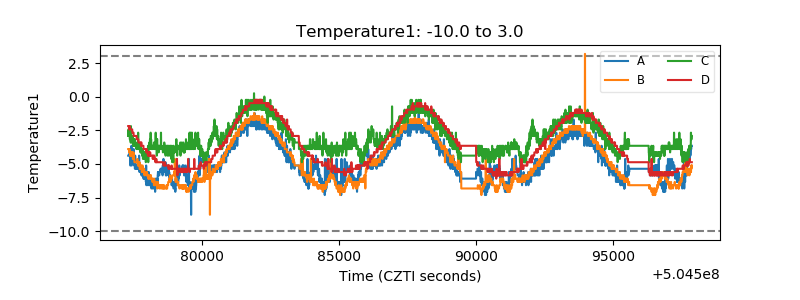 |
| Veto HV Monitor | 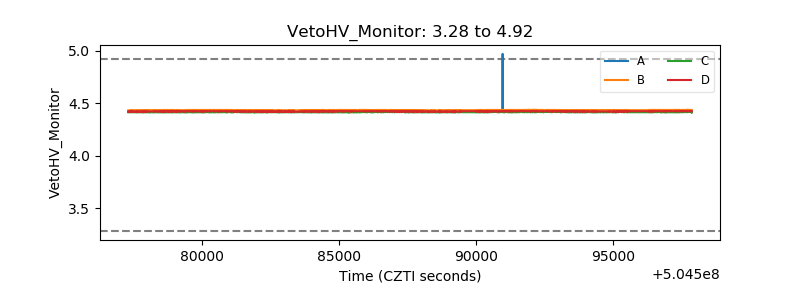 |
| Veto LLD | 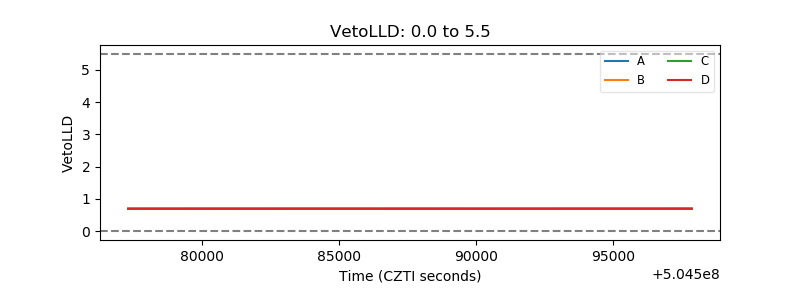 |
| Alpha Counter | 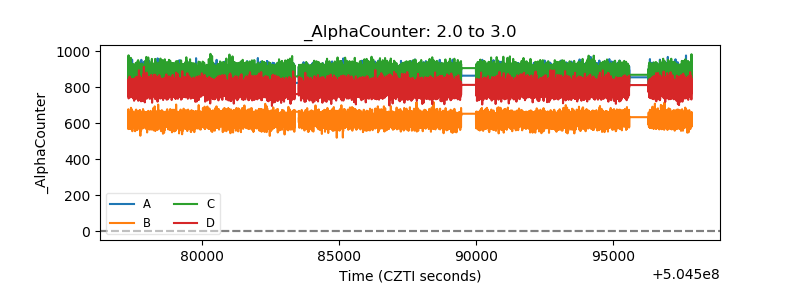 |
| _CPM_Rate | 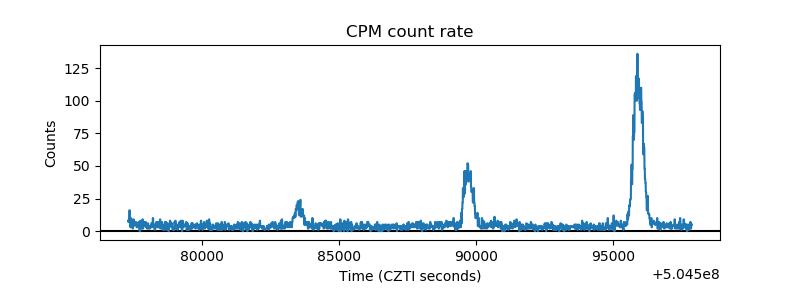 |
| CZT Counter | 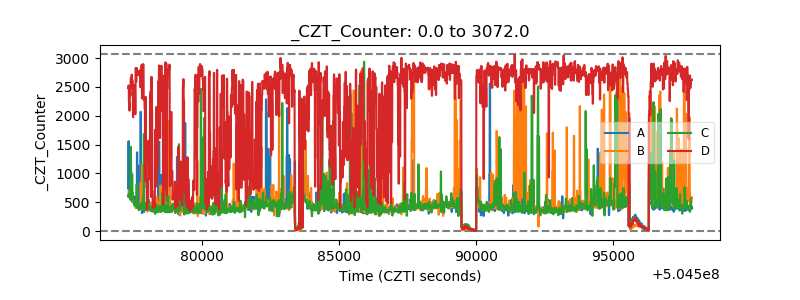 |
| +2.5 Volts monitor |  |
| +5 Volts monitor |  |
| _ROLL_ROT | 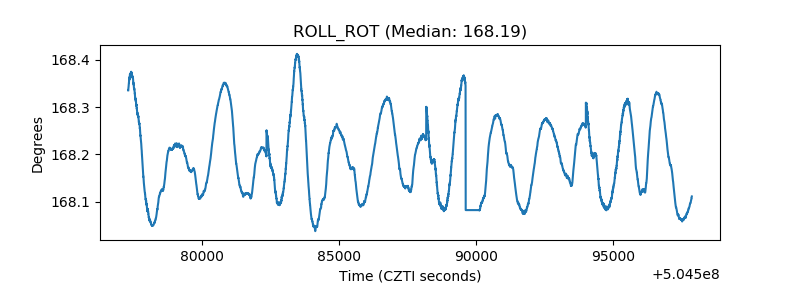 |
| _Roll_DEC | 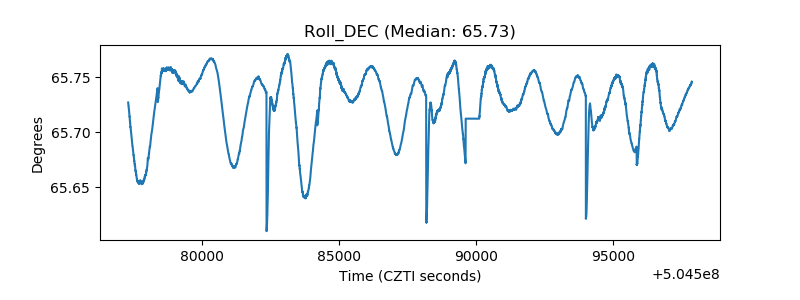 |
| _Roll_RA | 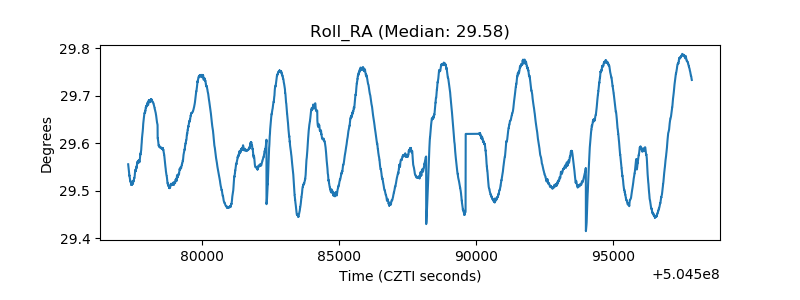 |
| Veto Counter | 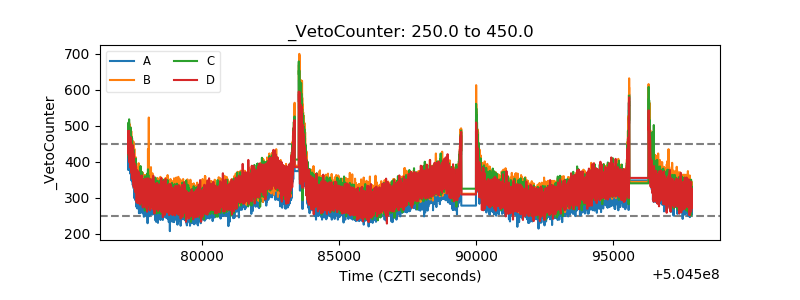 |