| Param | Original file | Final file |
|---|---|---|
| Filename | modeM0/AS1A14_099T01_9000006536_55456cztM0_level2.fits | modeM0/AS1A14_099T01_9000006536_55456cztM0_level2_quad_clean.evt |
| Size (bytes) | 799,560,000 | 82,874,880 |
| Size | 762.5 MB | 79.0 MB |
| Events in quadrant A | 3,218,279 | 647,104 |
| Events in quadrant B | 4,899,800 | 648,264 |
| Events in quadrant C | 4,621,946 | 601,704 |
| Events in quadrant D | 16,315,616 | 126,173 |
| Mode M9 | |||
|---|---|---|---|
| Quadrant | BADHDUFLAG | Total packets | Discarded packets |
| A | 0 | 17 | 0 |
| B | 0 | 17 | 0 |
| C | 0 | 17 | 0 |
| D | 0 | 17 | 0 |
| Mode SS | |||
|---|---|---|---|
| Quadrant | BADHDUFLAG | Total packets | Discarded packets |
| A | 0 | 144 | 2 |
| B | 0 | 144 | 0 |
| C | 0 | 144 | 0 |
| D | 0 | 144 | 0 |
| Mode M0 | |||
|---|---|---|---|
| Quadrant | BADHDUFLAG | Total packets | Discarded packets |
| A | 0 | 14795 | 115 |
| B | 0 | 19939 | 450 |
| C | 0 | 18906 | 142 |
| D | 0 | 54152 | 963 |
| Quadrant | Total seconds | Saturated seconds | Saturation percentage |
|---|---|---|---|
| A | 6997 | 68 | 0.971845% |
| B | 6970 | 629 | 9.024390% |
| C | 6986 | 335 | 4.795305% |
| D | 6944 | 5675 | 81.725230% |
Noise dominated data is calculated using 1-second bins in cleaned event files. If a bin has >2000 counts, and if more than 50% of those come from <1% of pixels, then it is considered to be noise-dominated and hence unusable.
| Quadrant | # 1 sec bins | Bins with >0 counts | Bins with >2000 counts | High rate bins dominated by noise | Noise dominated (total time) | Noise dominated (detector-on time) | Marked lightcurve |
|---|---|---|---|---|---|---|---|
| A | 8680 | 7023 | 11 | 11 | 0.13% | 0.16% | 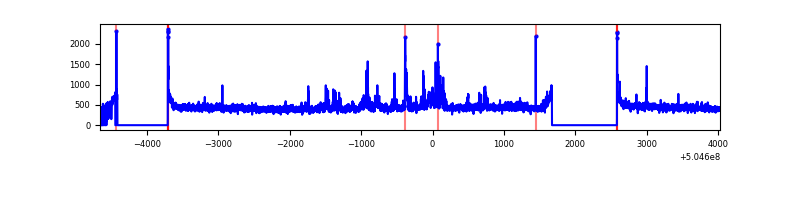 |
| B | 8681 | 6987 | 418 | 418 | 4.82% | 5.98% | 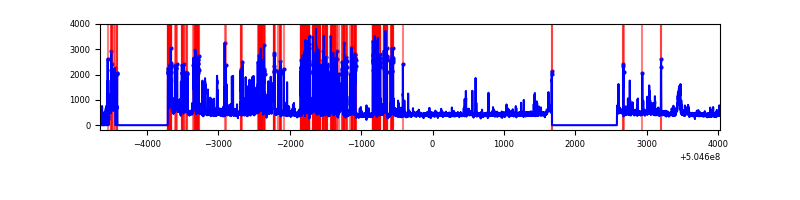 |
| C | 8679 | 7008 | 241 | 241 | 2.78% | 3.44% | 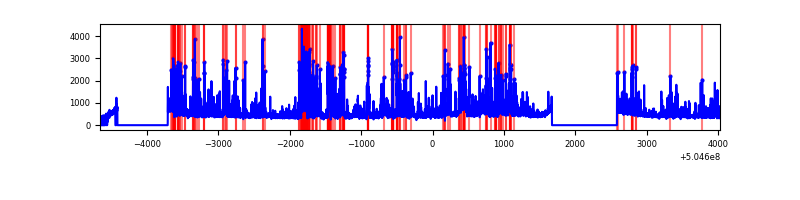 |
| D | 8682 | 6945 | 5469 | 5469 | 62.99% | 78.75% | 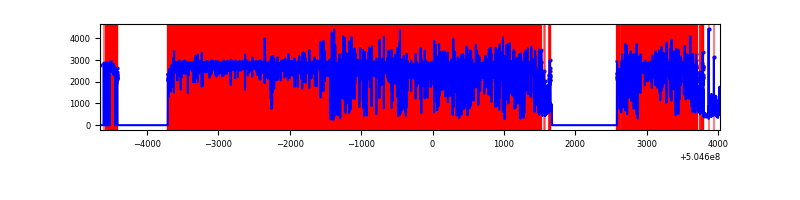 |
Top three noisy pixels from each quadrant. If the there are fewer than three noisy pixels in the level2.evt file, extra rows are filled as -1
| Pixel properties | Quadrant properties | ||||||
|---|---|---|---|---|---|---|---|
| Quadrant | DetID | PixID | Counts | Sigma | Mean | Median | Sigma |
| A | 3 | 78 | 162954 | 890.11 | 743 | 725 | 182.3 |
| A | 4 | 159 | 70983 | 385.49 | 743 | 725 | 182.3 |
| A | 12 | 115 | 27576 | 147.33 | 743 | 725 | 182.3 |
| B | 5 | 236 | 1495438 | 9729.16 | 714 | 687 | 153.6 |
| B | 0 | 171 | 455897 | 2962.91 | 714 | 687 | 153.6 |
| B | 2 | 249 | 45913 | 294.37 | 714 | 687 | 153.6 |
| C | 13 | 3 | 1452220 | 7498.47 | 708 | 699 | 193.6 |
| C | 1 | 16 | 223639 | 1151.69 | 708 | 699 | 193.6 |
| C | 12 | 252 | 70644 | 361.33 | 708 | 699 | 193.6 |
| D | 2 | 62 | 13684491 | 112349.94 | 427 | 406 | 121.8 |
| D | 3 | 12 | 354470 | 2906.96 | 427 | 406 | 121.8 |
| D | 11 | 129 | 178964 | 1466.01 | 427 | 406 | 121.8 |
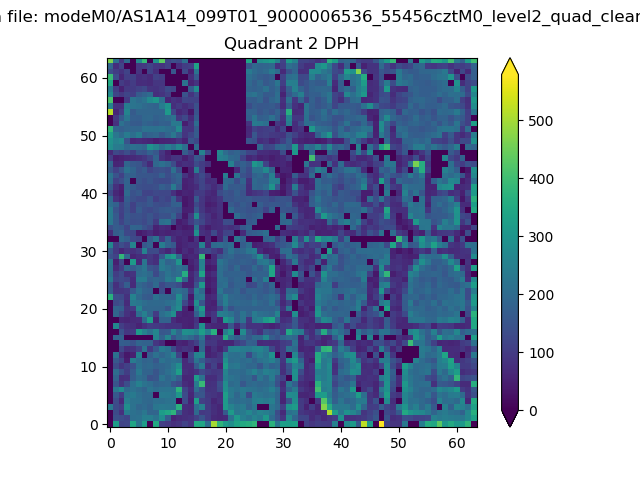
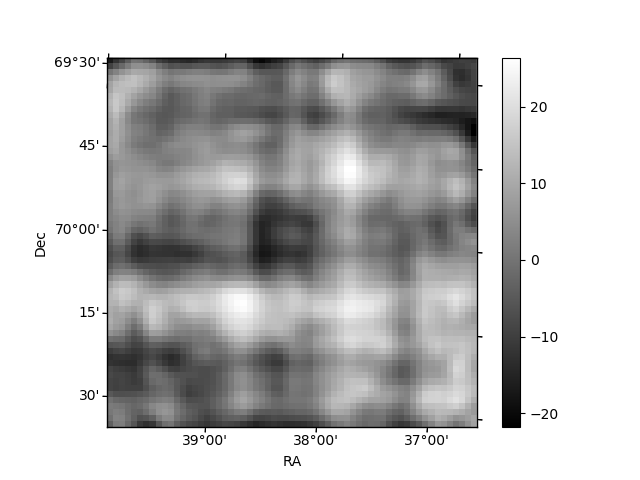
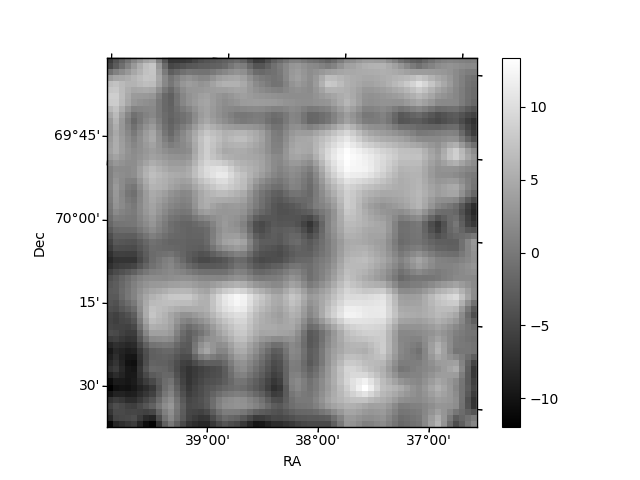
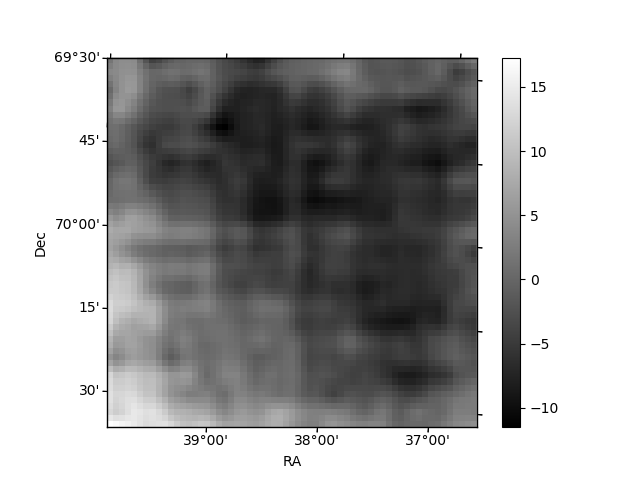
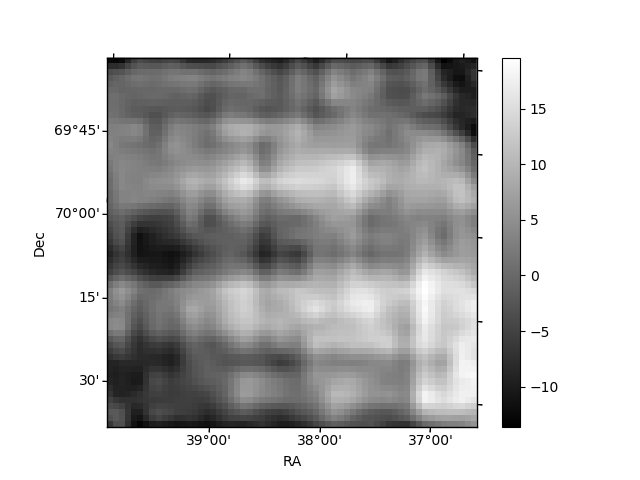
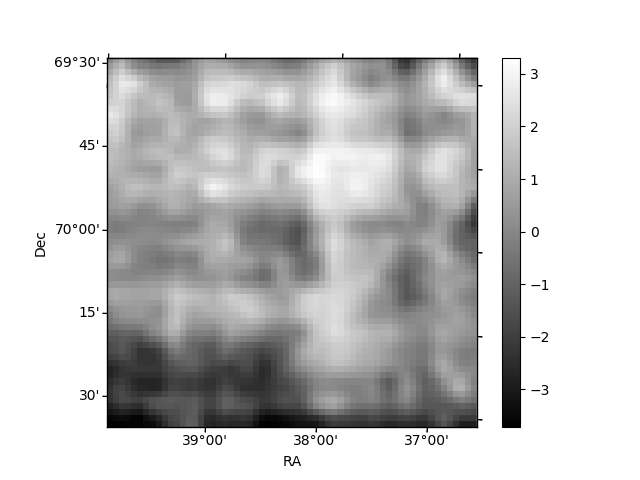
Histogram calculated using DETX and DETY for each event in the final _common_clean file
| Quadrant A | 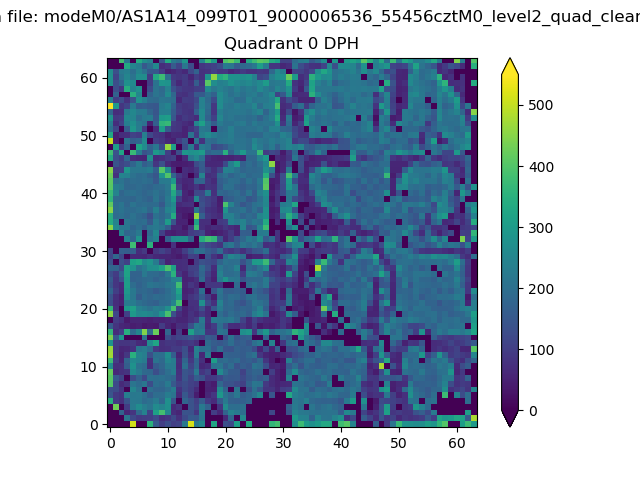 |
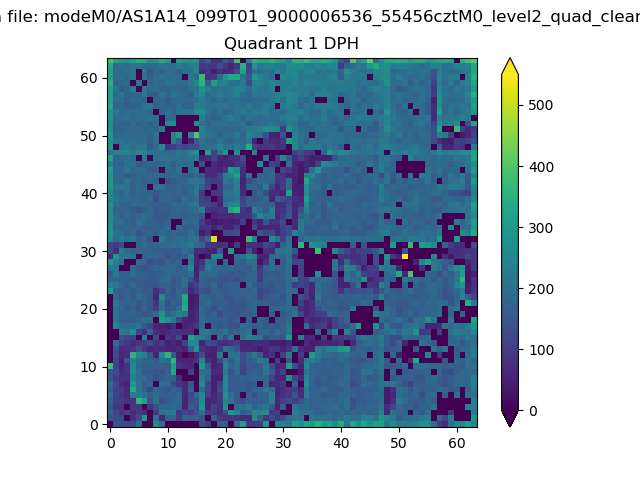 |
Quadrant B |
|---|---|---|---|
| Quadrant D | 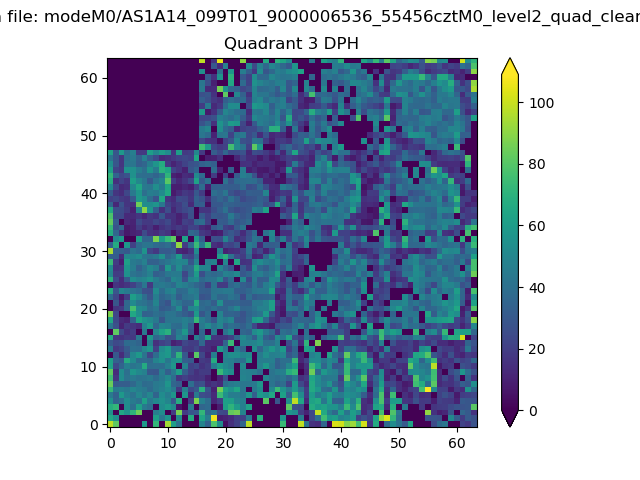 |
 |
Quadrant C |
| Plot type | Count rate plots | Images |
|---|---|---|
| Comparison with Poisson distribution Blue bars denote a histogram of data divided into 1 sec bins. Red curve is a Poisson curve with rate = median count rate of data. |
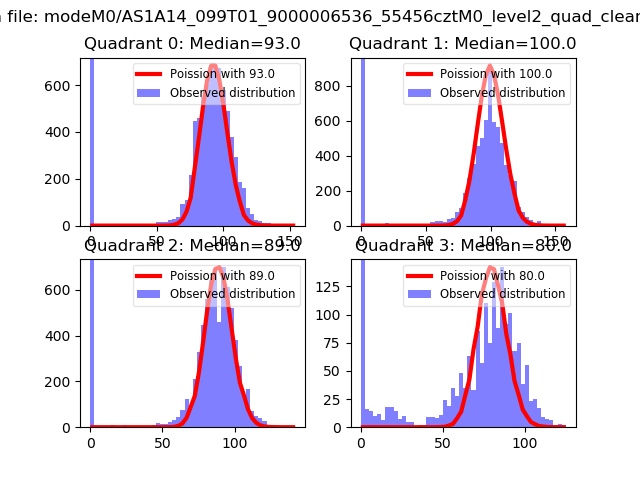 |
 |
| Quadrant-wise count rates Data is divided into 100 sec bins |
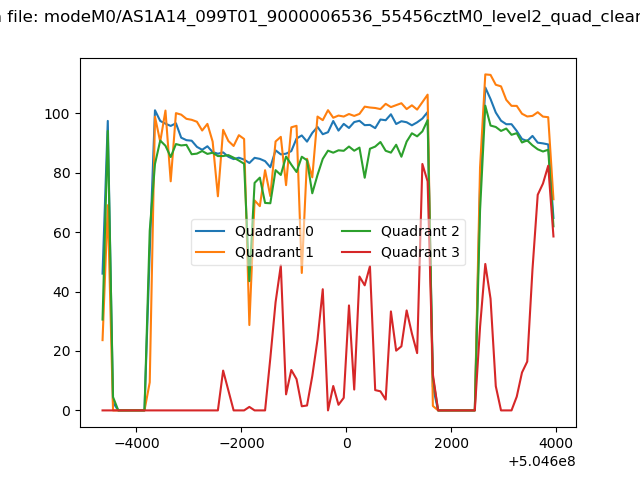 |
|
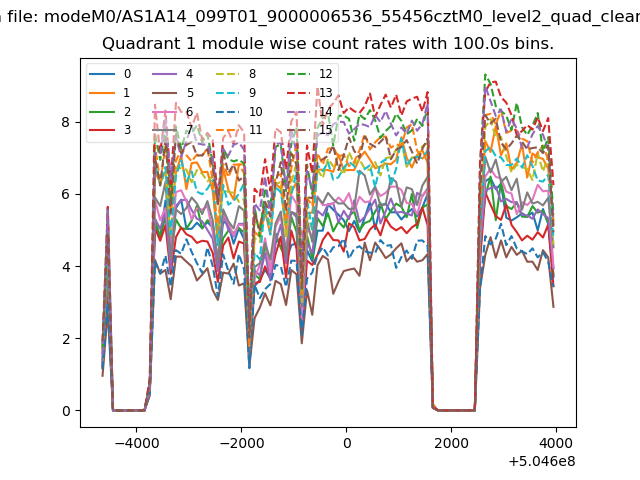
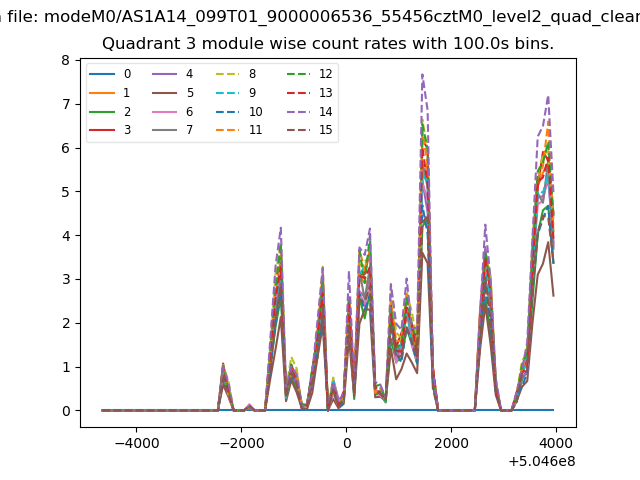
| Module-wise count rates for Quadrant A Data is divided into 100 sec bins |
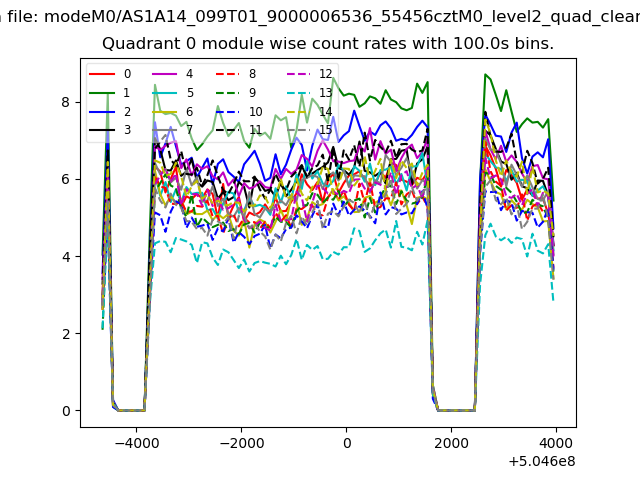 |
 |
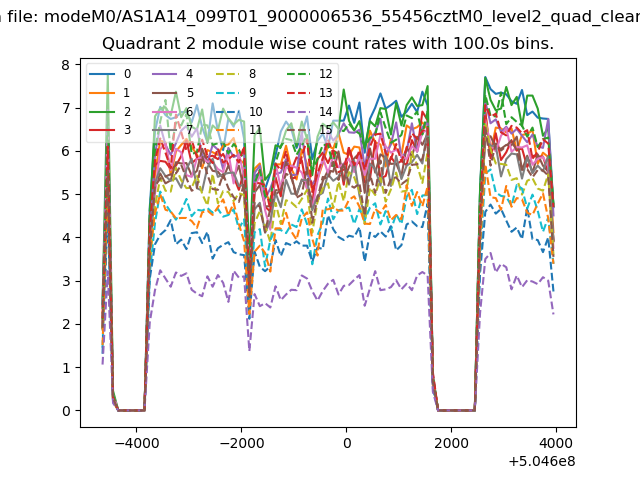
| Module-wise count rates for Quadrant B Data is divided into 100 sec bins |
 |
 |
| Module-wise count rates for Quadrant C Data is divided into 100 sec bins |
 |
 |
| Module-wise count rates for Quadrant D Data is divided into 100 sec bins |
 |
 |
| Parameter | Plot |
|---|---|
| CZT HV Monitor | 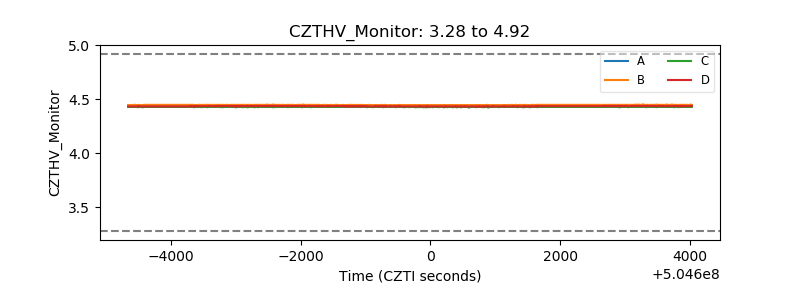 |
| D_VDD | 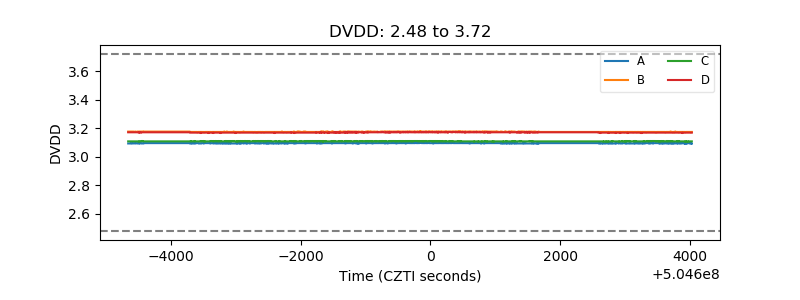 |
| Temperature 1 | 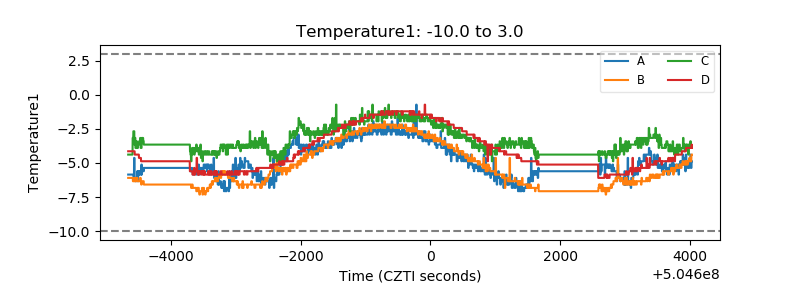 |
| Veto HV Monitor | 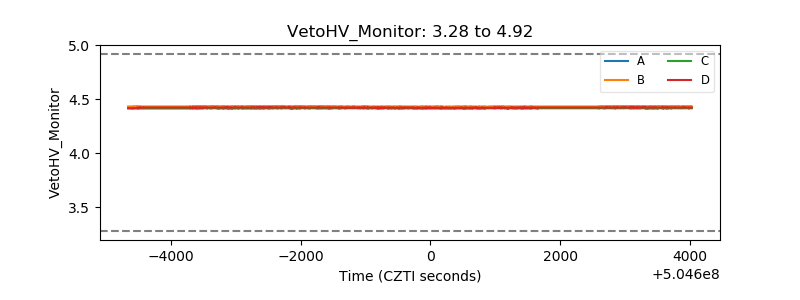 |
| Veto LLD | 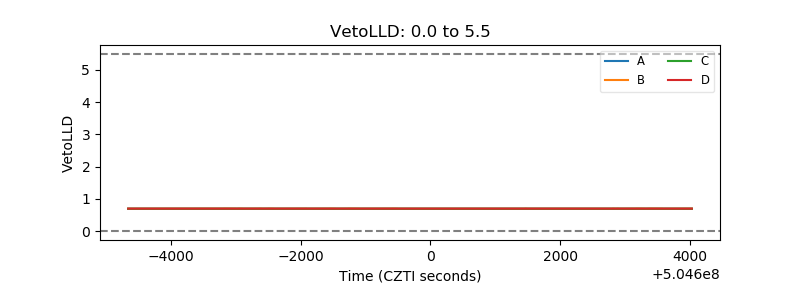 |
| Alpha Counter | 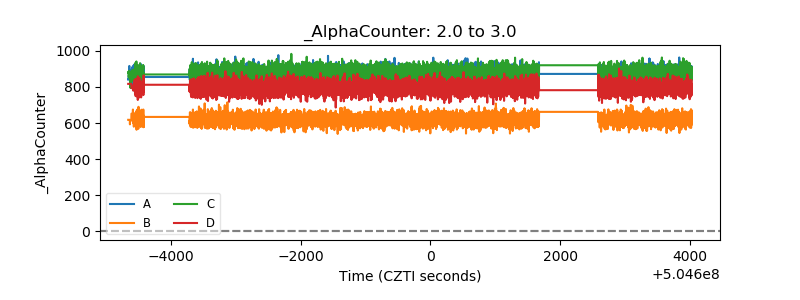 |
| _CPM_Rate | 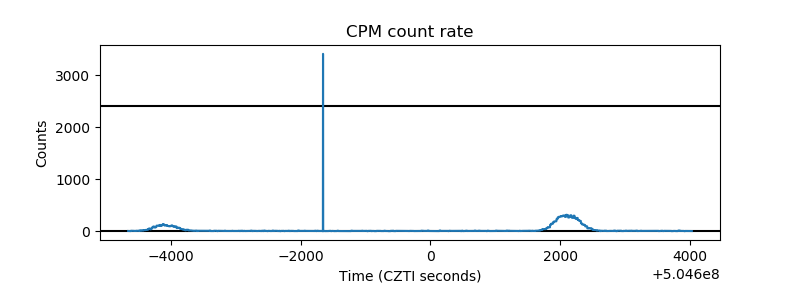 |
| CZT Counter | 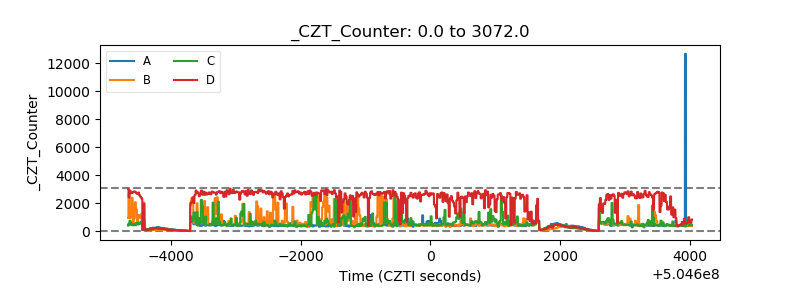 |
| +2.5 Volts monitor |  |
| +5 Volts monitor |  |
| _ROLL_ROT | 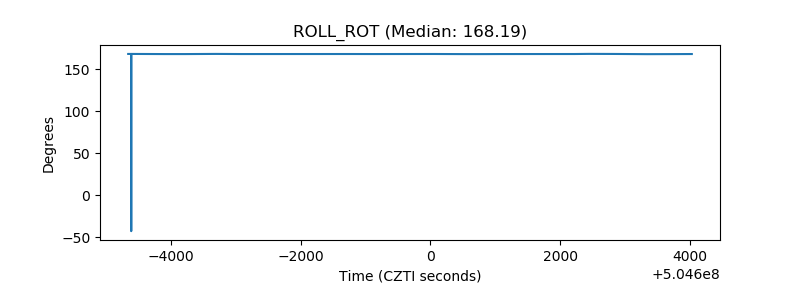 |
| _Roll_DEC | 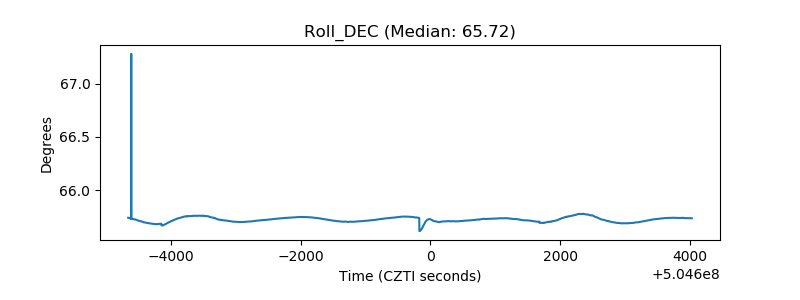 |
| _Roll_RA | 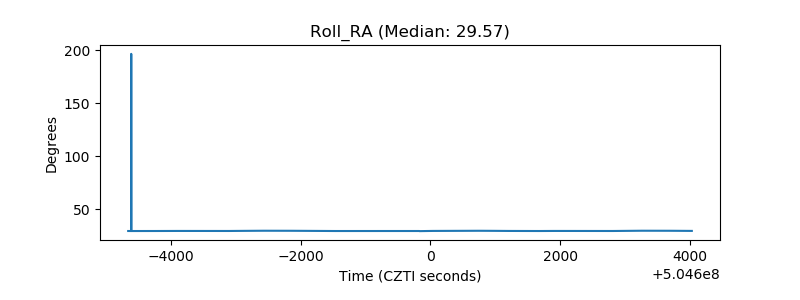 |
| Veto Counter | 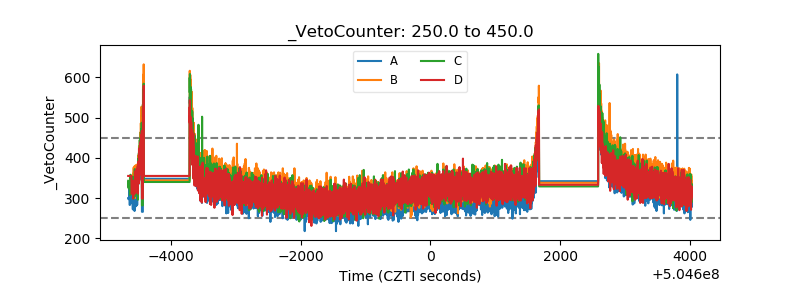 |