| Param | Original file | Final file |
|---|---|---|
| Filename | modeM0/AS1A14_099T01_9000006536_55458cztM0_level2.fits | modeM0/AS1A14_099T01_9000006536_55458cztM0_level2_quad_clean.evt |
| Size (bytes) | 462,841,920 | 94,461,120 |
| Size | 441.4 MB | 90.1 MB |
| Events in quadrant A | 3,218,917 | 631,523 |
| Events in quadrant B | 3,028,424 | 683,760 |
| Events in quadrant C | 3,259,064 | 599,643 |
| Events in quadrant D | 7,111,746 | 483,869 |
| Mode M9 | |||
|---|---|---|---|
| Quadrant | BADHDUFLAG | Total packets | Discarded packets |
| A | 0 | 18 | 1 |
| B | 0 | 18 | 0 |
| C | 0 | 18 | 1 |
| D | 0 | 19 | 2 |
| Mode SS | |||
|---|---|---|---|
| Quadrant | BADHDUFLAG | Total packets | Discarded packets |
| A | 0 | 134 | 0 |
| B | 0 | 134 | 0 |
| C | 0 | 134 | 0 |
| D | 0 | 134 | 0 |
| Mode M0 | |||
|---|---|---|---|
| Quadrant | BADHDUFLAG | Total packets | Discarded packets |
| A | 0 | 14414 | 2 |
| B | 0 | 13948 | 2 |
| C | 0 | 14739 | 2 |
| D | 0 | 25759 | 2 |
| Quadrant | Total seconds | Saturated seconds | Saturation percentage |
|---|---|---|---|
| A | 6620 | 112 | 1.691843% |
| B | 6620 | 87 | 1.314199% |
| C | 6620 | 90 | 1.359517% |
| D | 6620 | 1119 | 16.903323% |
Noise dominated data is calculated using 1-second bins in cleaned event files. If a bin has >2000 counts, and if more than 50% of those come from <1% of pixels, then it is considered to be noise-dominated and hence unusable.
| Quadrant | # 1 sec bins | Bins with >0 counts | Bins with >2000 counts | High rate bins dominated by noise | Noise dominated (total time) | Noise dominated (detector-on time) | Marked lightcurve |
|---|---|---|---|---|---|---|---|
| A | 7651 | 6621 | 60 | 60 | 0.78% | 0.91% | 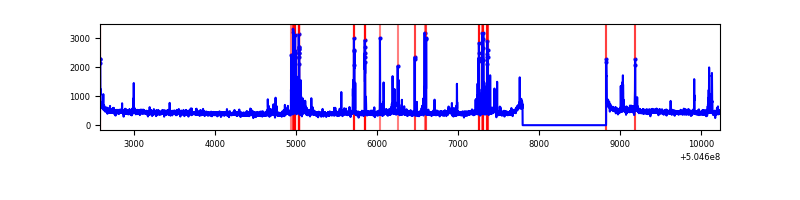 |
| B | 7651 | 6621 | 15 | 15 | 0.20% | 0.23% | 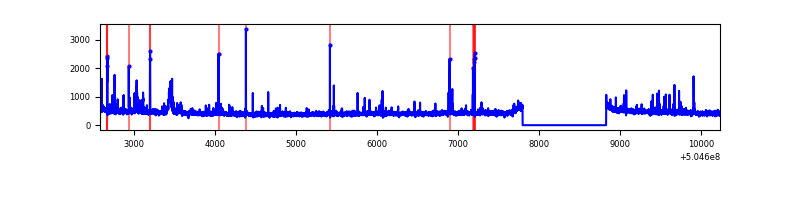 |
| C | 7651 | 6621 | 49 | 49 | 0.64% | 0.74% | 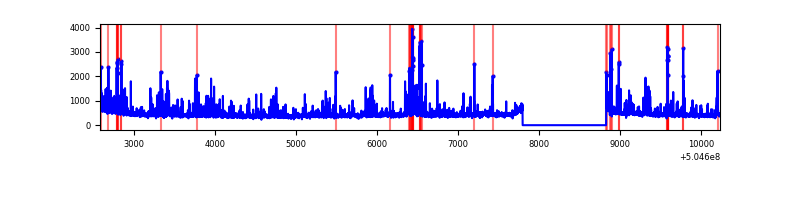 |
| D | 7651 | 6621 | 1061 | 1061 | 13.87% | 16.02% | 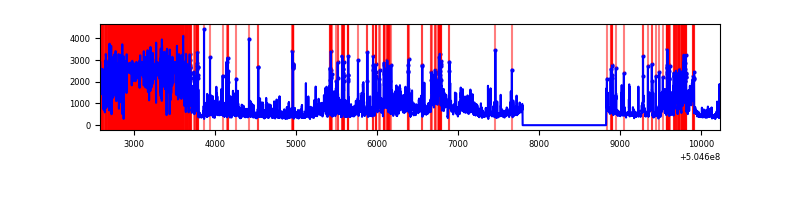 |
Top three noisy pixels from each quadrant. If the there are fewer than three noisy pixels in the level2.evt file, extra rows are filled as -1
| Pixel properties | Quadrant properties | ||||||
|---|---|---|---|---|---|---|---|
| Quadrant | DetID | PixID | Counts | Sigma | Mean | Median | Sigma |
| A | 3 | 78 | 202221 | 1157.22 | 711 | 692 | 174.1 |
| A | 0 | 8 | 186329 | 1065.96 | 711 | 692 | 174.1 |
| A | 4 | 159 | 19153 | 106.01 | 711 | 692 | 174.1 |
| B | 0 | 171 | 82647 | 540.3 | 703 | 677 | 151.7 |
| B | 2 | 249 | 43115 | 279.73 | 703 | 677 | 151.7 |
| B | 5 | 236 | 21223 | 135.43 | 703 | 677 | 151.7 |
| C | 13 | 3 | 250304 | 1335.99 | 683 | 676 | 186.8 |
| C | 1 | 16 | 180062 | 960.06 | 683 | 676 | 186.8 |
| C | 12 | 252 | 83404 | 442.75 | 683 | 676 | 186.8 |
| D | 2 | 62 | 3470121 | 19393.2 | 638 | 607 | 178.9 |
| D | 8 | 160 | 460854 | 2572.6 | 638 | 607 | 178.9 |
| D | 2 | 31 | 241628 | 1347.21 | 638 | 607 | 178.9 |
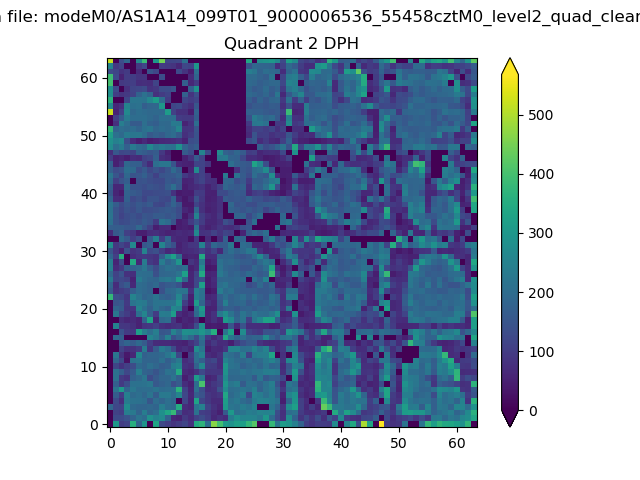
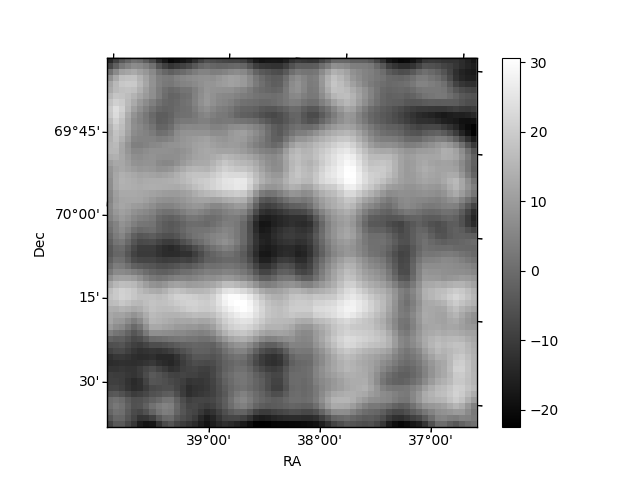
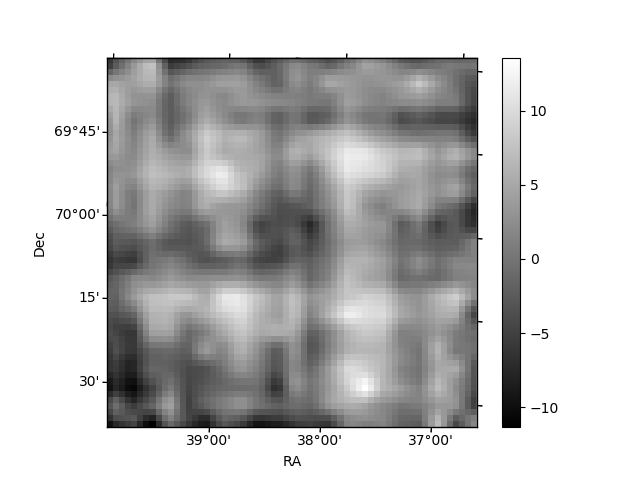
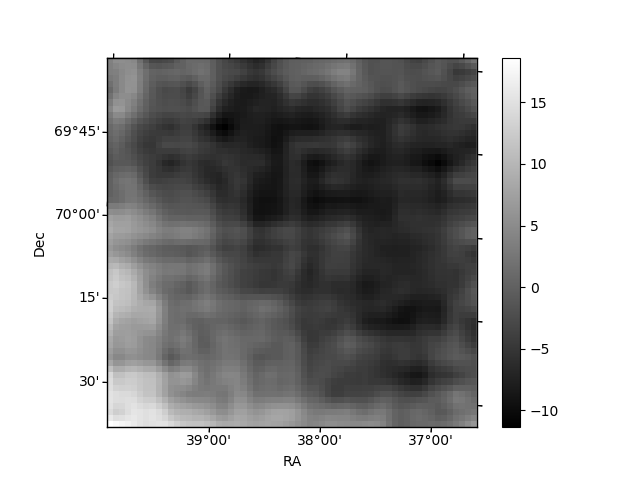
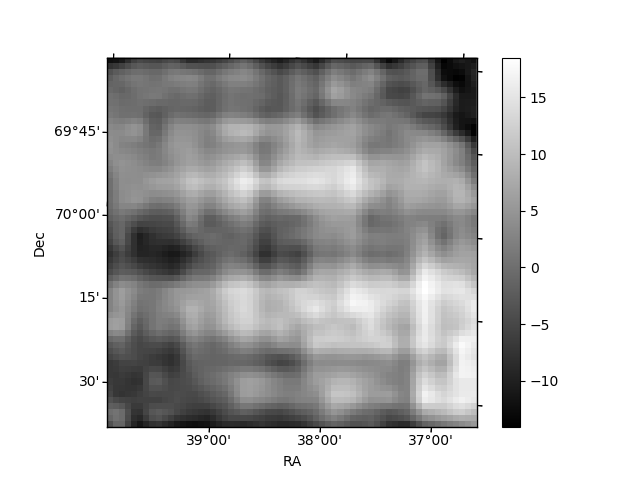
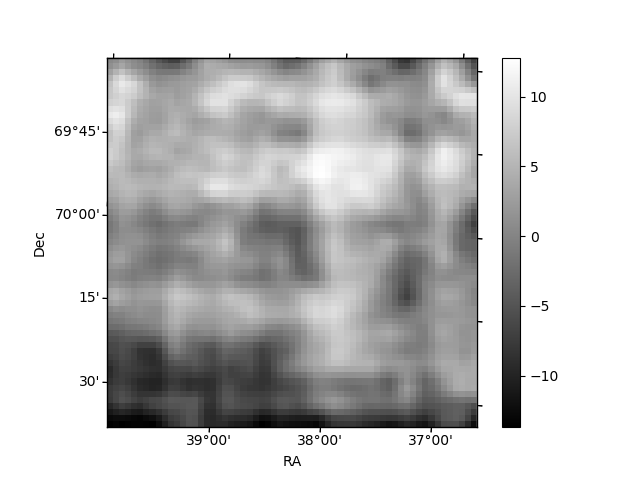
Histogram calculated using DETX and DETY for each event in the final _common_clean file
| Quadrant A | 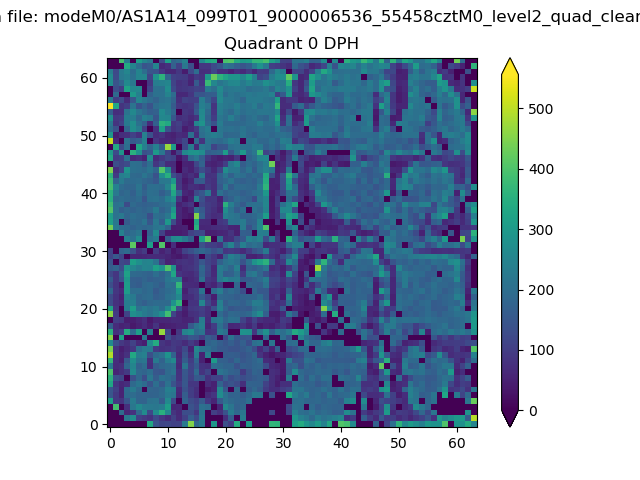 |
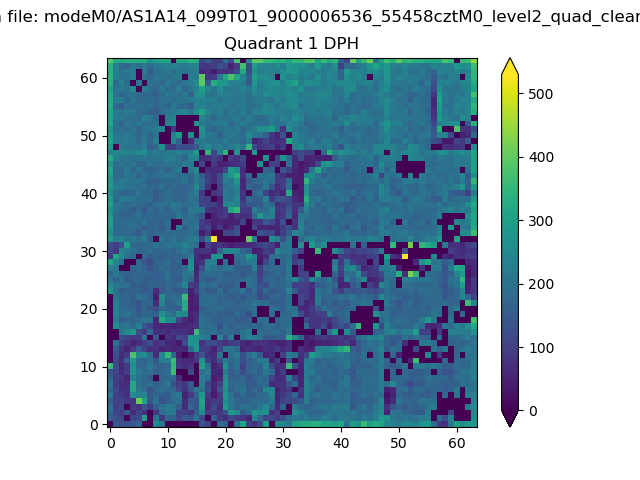 |
Quadrant B |
|---|---|---|---|
| Quadrant D | 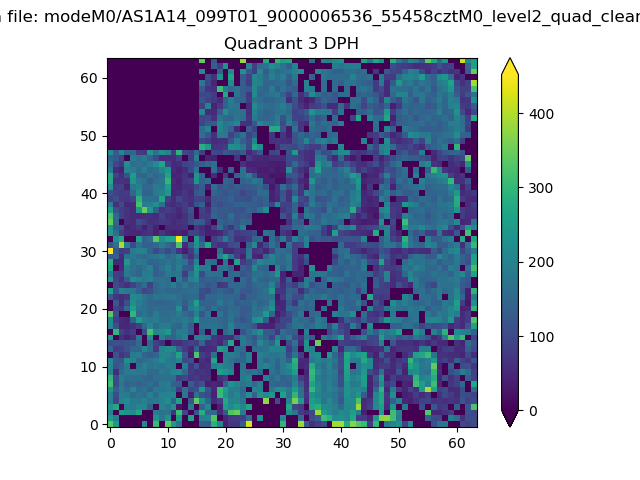 |
 |
Quadrant C |
| Plot type | Count rate plots | Images |
|---|---|---|
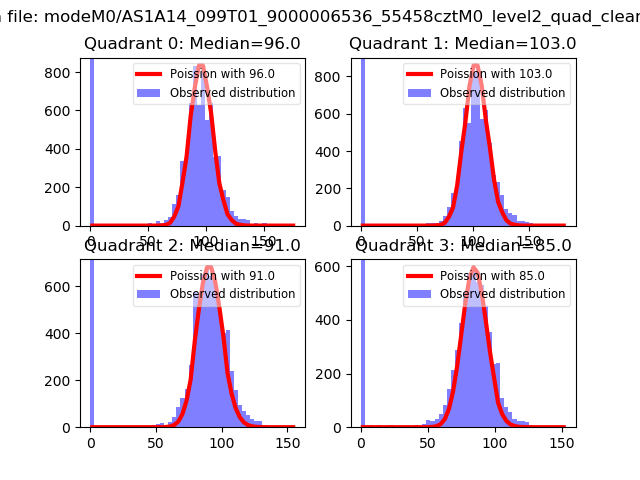
| Comparison with Poisson distribution Blue bars denote a histogram of data divided into 1 sec bins. Red curve is a Poisson curve with rate = median count rate of data. |
 |
 |
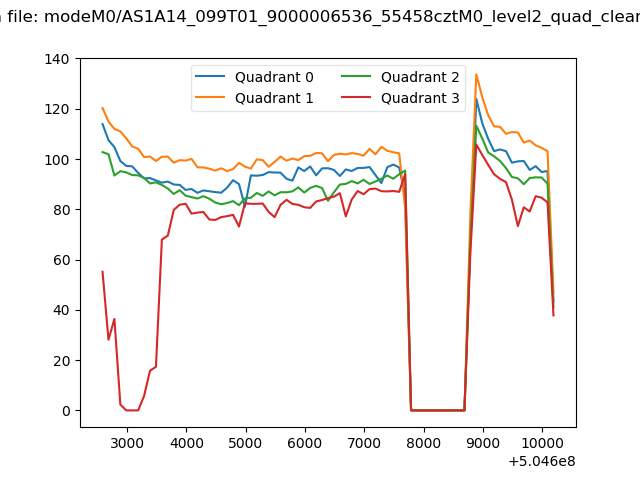
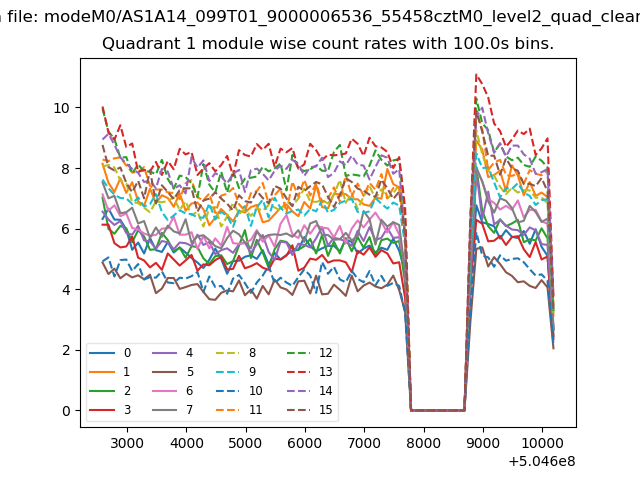
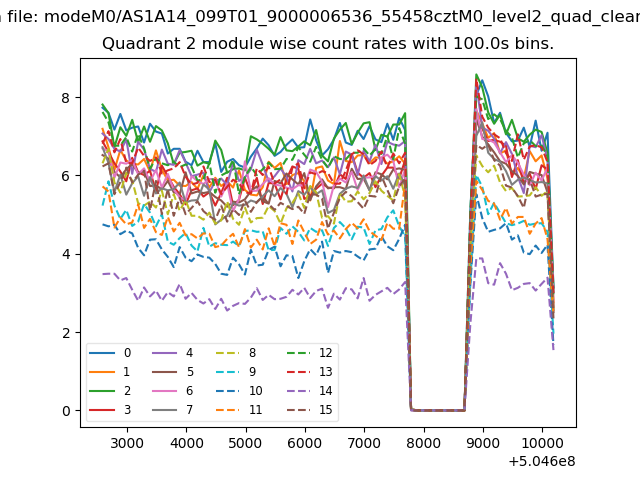
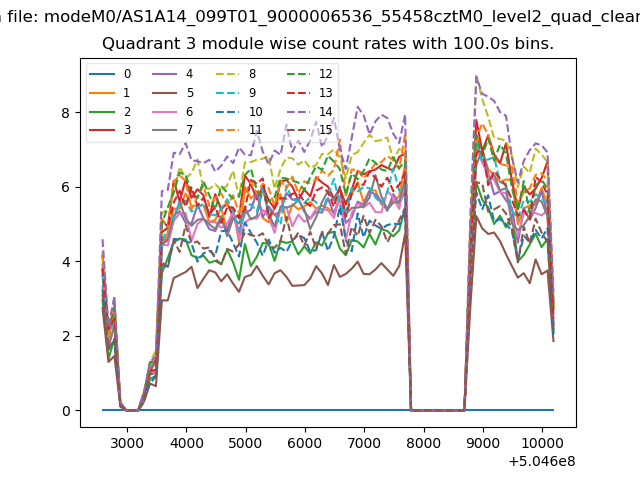
| Quadrant-wise count rates Data is divided into 100 sec bins |
 |
|
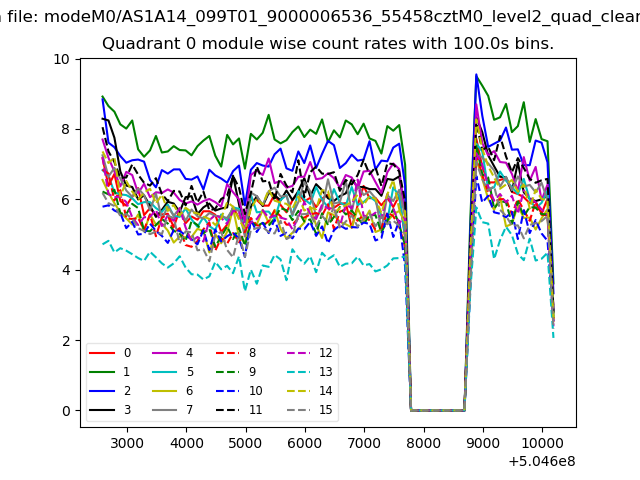
| Module-wise count rates for Quadrant A Data is divided into 100 sec bins |
 |
 |
| Module-wise count rates for Quadrant B Data is divided into 100 sec bins |
 |
 |
| Module-wise count rates for Quadrant C Data is divided into 100 sec bins |
 |
 |
| Module-wise count rates for Quadrant D Data is divided into 100 sec bins |
 |
 |
| Parameter | Plot |
|---|---|
| CZT HV Monitor | 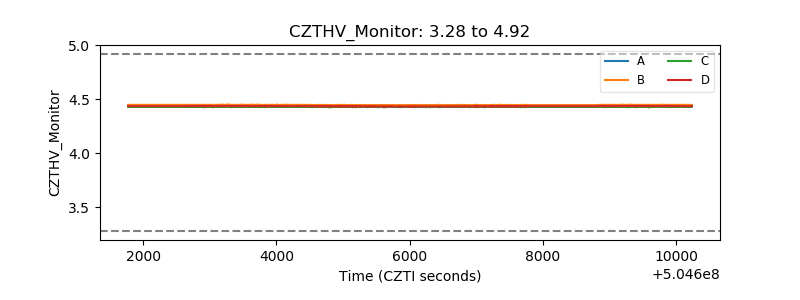 |
| D_VDD | 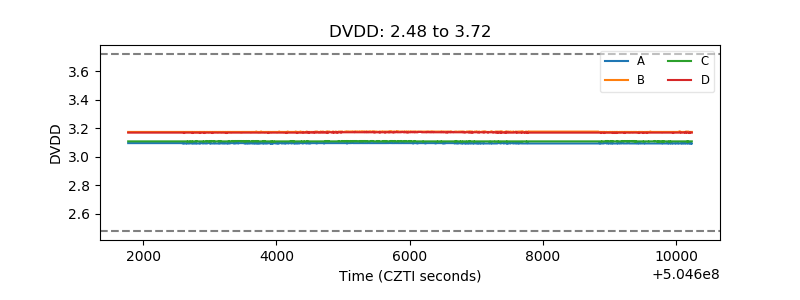 |
| Temperature 1 | 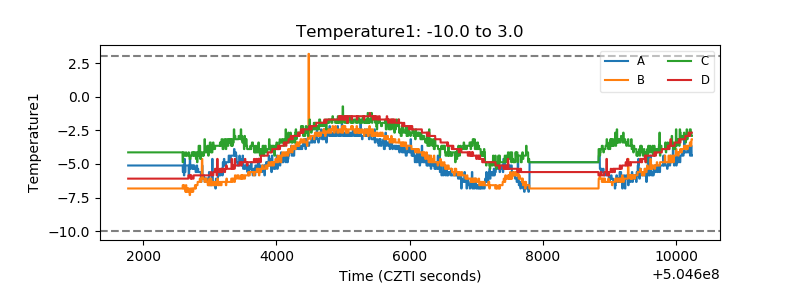 |
| Veto HV Monitor | 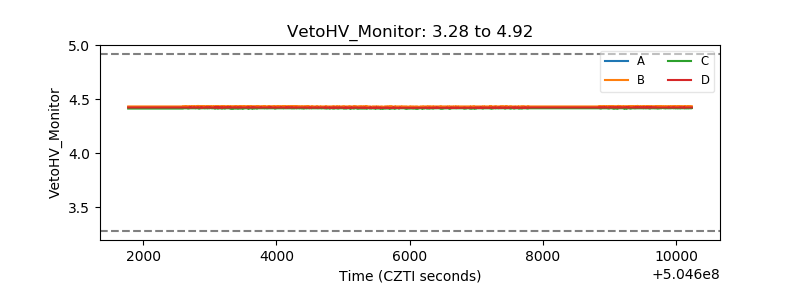 |
| Veto LLD | 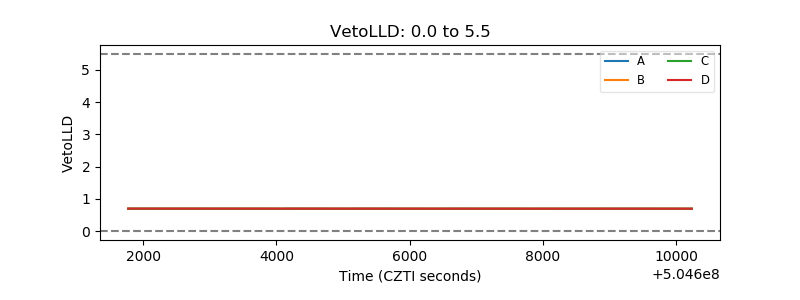 |
| Alpha Counter | 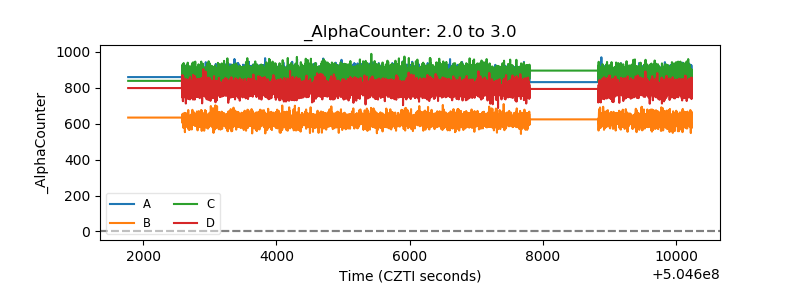 |
| _CPM_Rate | 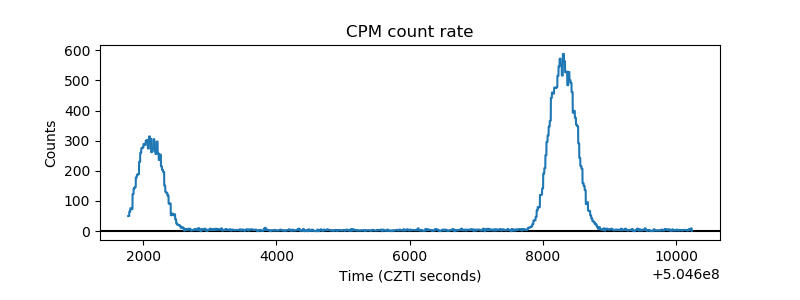 |
| CZT Counter | 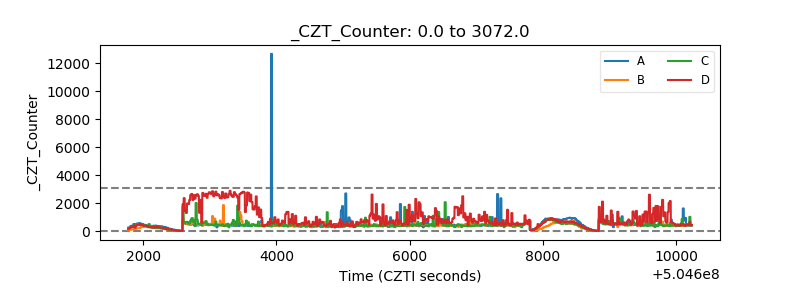 |
| +2.5 Volts monitor | 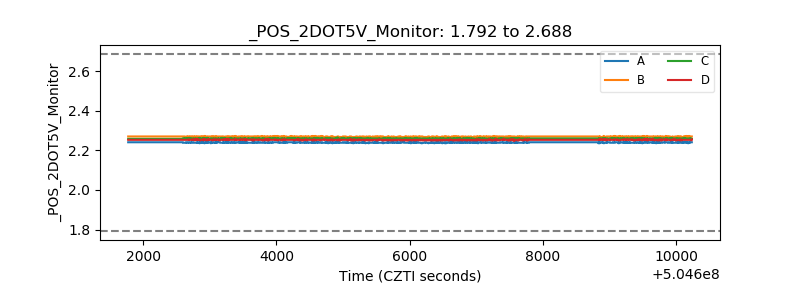 |
| +5 Volts monitor | 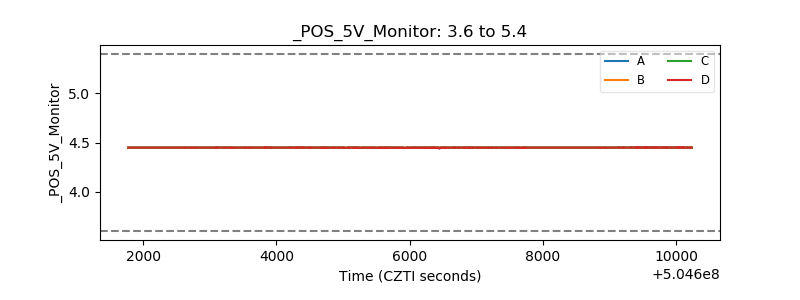 |
| _ROLL_ROT | 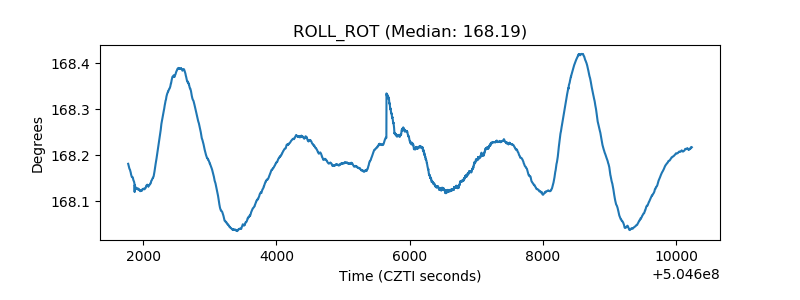 |
| _Roll_DEC | 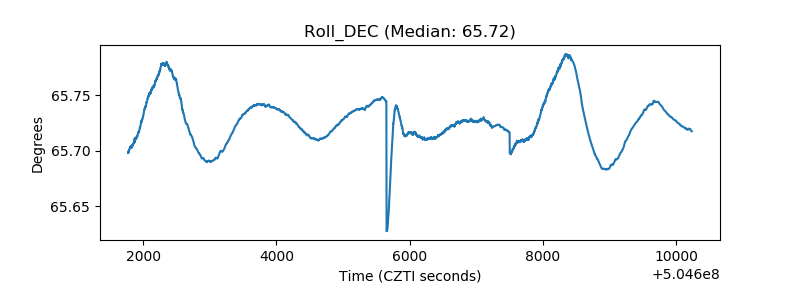 |
| _Roll_RA | 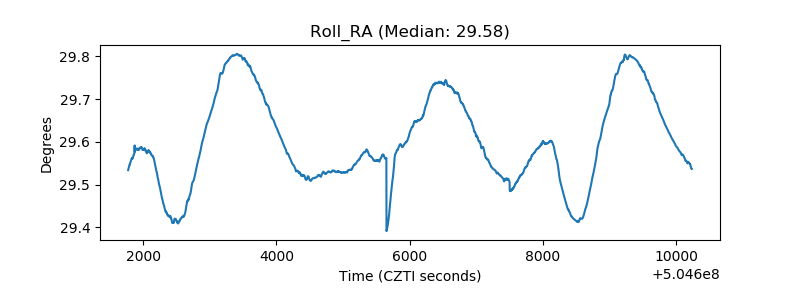 |
| Veto Counter | 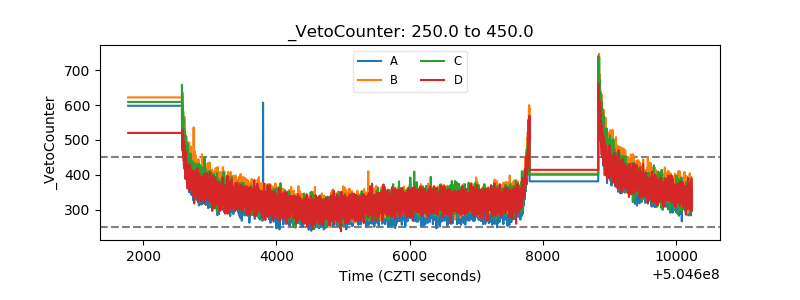 |