| Param | Original file | Final file |
|---|---|---|
| Filename | modeM0/AS1A14_099T01_9000006536_55460cztM0_level2.fits | modeM0/AS1A14_099T01_9000006536_55460cztM0_level2_quad_clean.evt |
| Size (bytes) | 445,916,160 | 96,520,320 |
| Size | 425.3 MB | 92.0 MB |
| Events in quadrant A | 4,155,766 | 630,092 |
| Events in quadrant B | 3,494,080 | 680,448 |
| Events in quadrant C | 3,720,755 | 602,446 |
| Events in quadrant D | 4,632,231 | 558,692 |
| Mode M9 | |||
|---|---|---|---|
| Quadrant | BADHDUFLAG | Total packets | Discarded packets |
| A | 0 | 16 | 0 |
| B | 0 | 16 | 0 |
| C | 0 | 17 | 0 |
| D | 0 | 17 | 0 |
| Mode SS | |||
|---|---|---|---|
| Quadrant | BADHDUFLAG | Total packets | Discarded packets |
| A | 0 | 130 | 0 |
| B | 0 | 130 | 0 |
| C | 0 | 130 | 0 |
| D | 0 | 130 | 0 |
| Mode M0 | |||
|---|---|---|---|
| Quadrant | BADHDUFLAG | Total packets | Discarded packets |
| A | 0 | 16887 | 2 |
| B | 0 | 15070 | 2 |
| C | 0 | 15828 | 2 |
| D | 0 | 18195 | 2 |
| Quadrant | Total seconds | Saturated seconds | Saturation percentage |
|---|---|---|---|
| A | 6470 | 406 | 6.275116% |
| B | 6470 | 321 | 4.961360% |
| C | 6470 | 282 | 4.358578% |
| D | 6470 | 483 | 7.465224% |
Noise dominated data is calculated using 1-second bins in cleaned event files. If a bin has >2000 counts, and if more than 50% of those come from <1% of pixels, then it is considered to be noise-dominated and hence unusable.
| Quadrant | # 1 sec bins | Bins with >0 counts | Bins with >2000 counts | High rate bins dominated by noise | Noise dominated (total time) | Noise dominated (detector-on time) | Marked lightcurve |
|---|---|---|---|---|---|---|---|
| A | 7605 | 6470 | 234 | 234 | 3.08% | 3.62% | 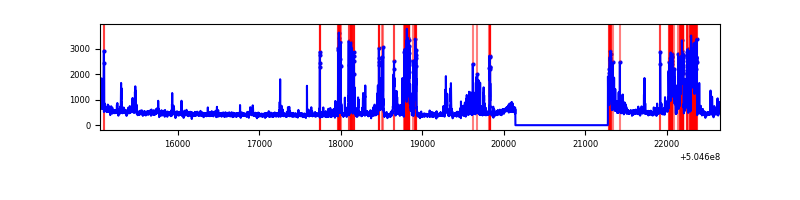 |
| B | 7605 | 6470 | 188 | 188 | 2.47% | 2.91% | 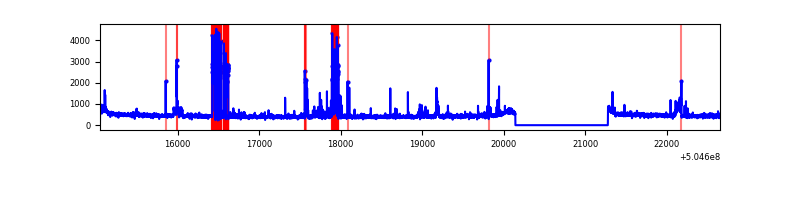 |
| C | 7605 | 6470 | 170 | 170 | 2.24% | 2.63% | 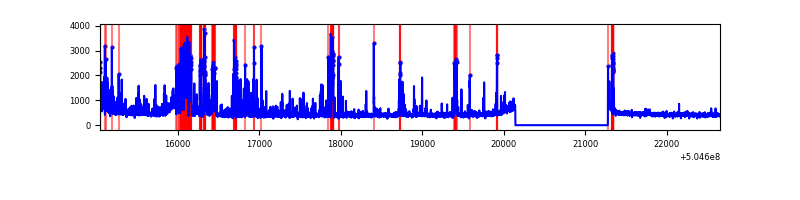 |
| D | 7605 | 6470 | 362 | 362 | 4.76% | 5.60% | 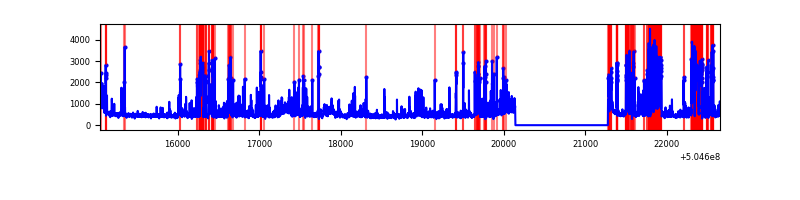 |
Top three noisy pixels from each quadrant. If the there are fewer than three noisy pixels in the level2.evt file, extra rows are filled as -1
| Pixel properties | Quadrant properties | ||||||
|---|---|---|---|---|---|---|---|
| Quadrant | DetID | PixID | Counts | Sigma | Mean | Median | Sigma |
| A | 3 | 78 | 1334390 | 7570.11 | 712 | 694 | 176.2 |
| A | 13 | 254 | 13848 | 74.66 | 712 | 694 | 176.2 |
| A | 4 | 3 | 13773 | 74.24 | 712 | 694 | 176.2 |
| B | 5 | 236 | 422088 | 2858.82 | 696 | 669 | 147.4 |
| B | 10 | 247 | 156285 | 1055.67 | 696 | 669 | 147.4 |
| B | 0 | 171 | 122538 | 826.73 | 696 | 669 | 147.4 |
| C | 13 | 3 | 731562 | 3901.02 | 686 | 679 | 187.4 |
| C | 1 | 16 | 128411 | 681.76 | 686 | 679 | 187.4 |
| C | 12 | 252 | 104434 | 553.78 | 686 | 679 | 187.4 |
| D | 8 | 160 | 734123 | 3839.32 | 681 | 650 | 191.0 |
| D | 9 | 65 | 357467 | 1867.74 | 681 | 650 | 191.0 |
| D | 2 | 31 | 209844 | 1095.01 | 681 | 650 | 191.0 |
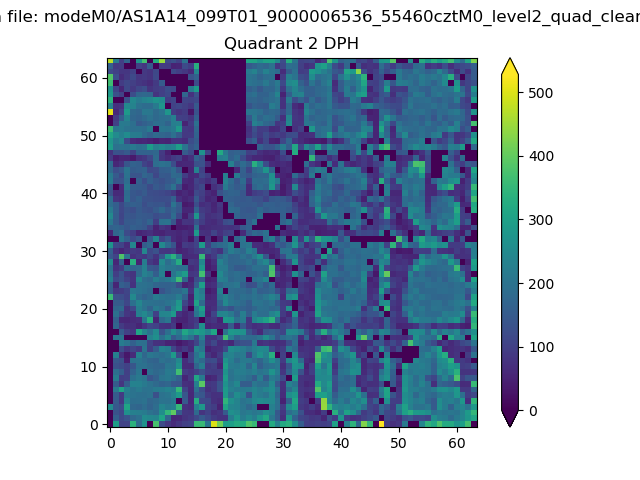
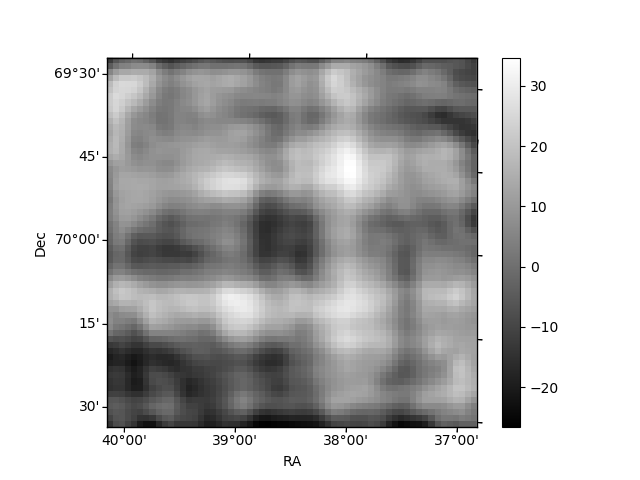
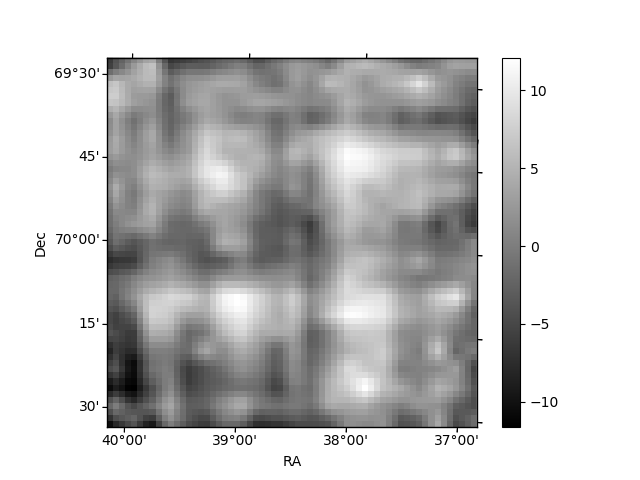
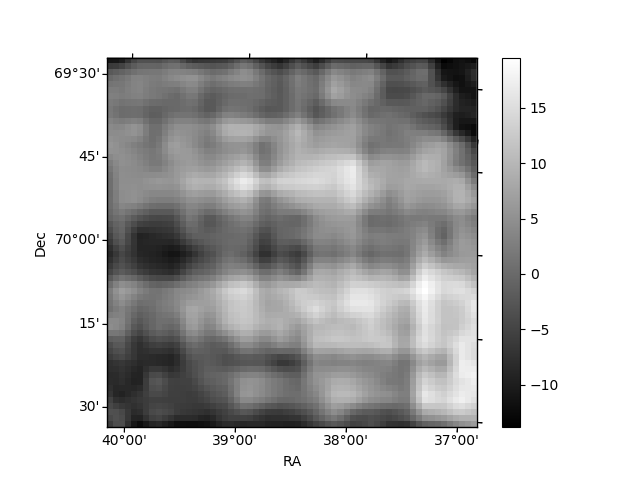
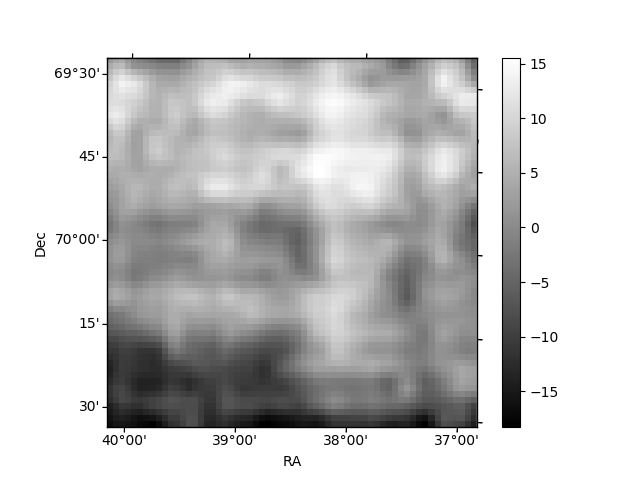
Histogram calculated using DETX and DETY for each event in the final _common_clean file
| Quadrant A | 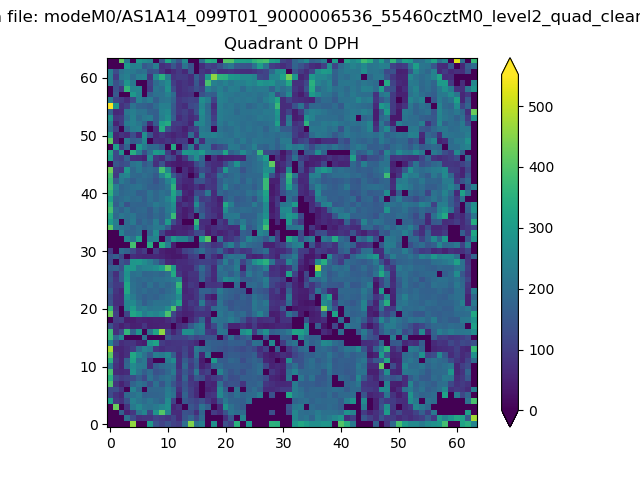 |
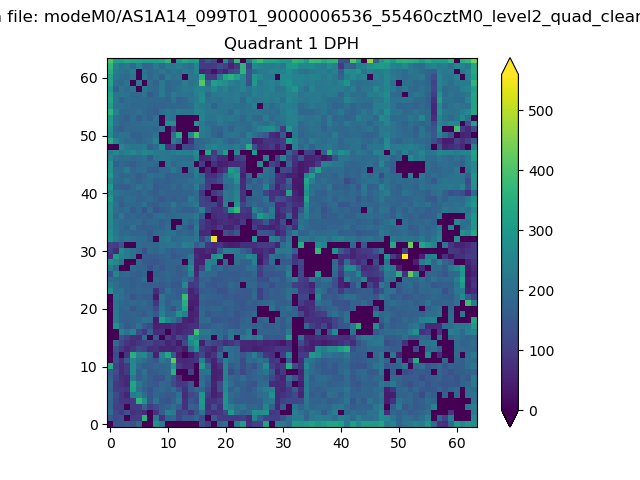 |
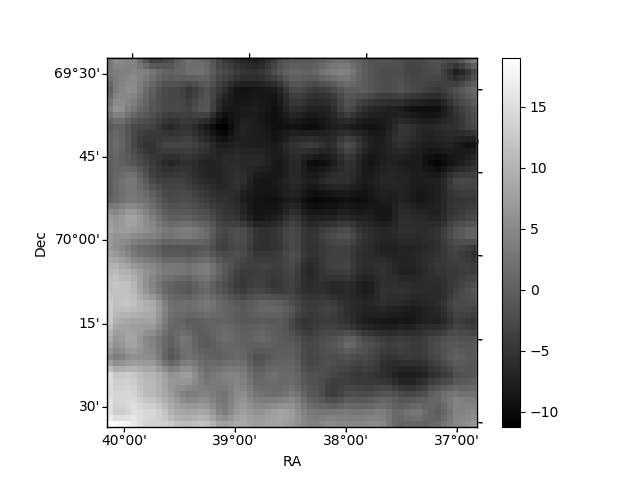
Quadrant B |
|---|---|---|---|
| Quadrant D | 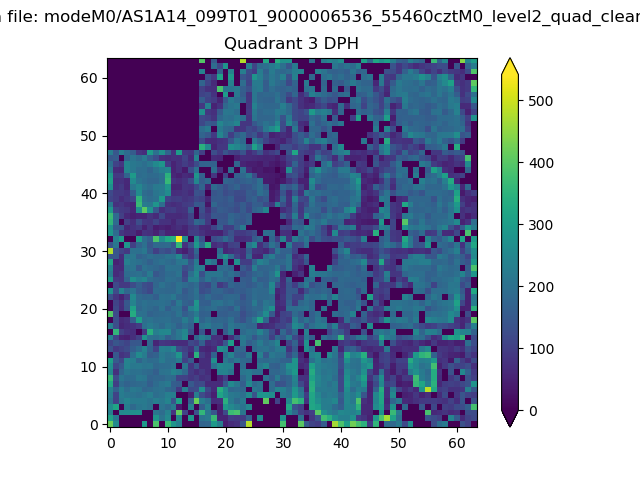 |
 |
Quadrant C |
| Plot type | Count rate plots | Images |
|---|---|---|
| Comparison with Poisson distribution Blue bars denote a histogram of data divided into 1 sec bins. Red curve is a Poisson curve with rate = median count rate of data. |
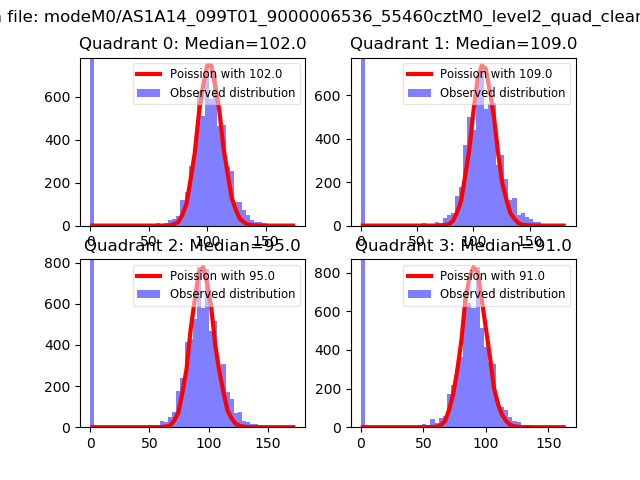 |
 |
| Quadrant-wise count rates Data is divided into 100 sec bins |
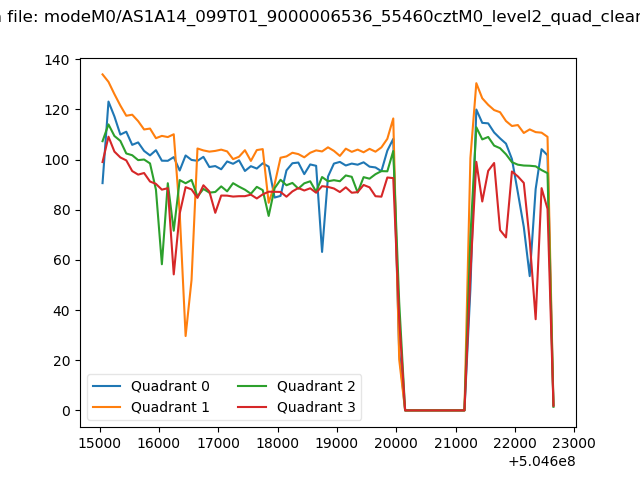 |
|
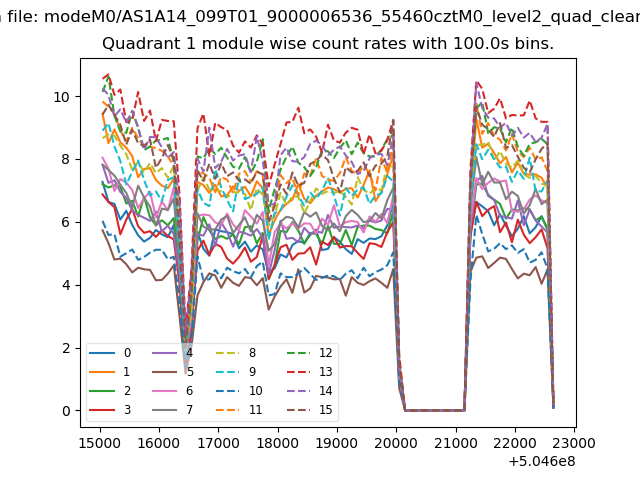
| Module-wise count rates for Quadrant A Data is divided into 100 sec bins |
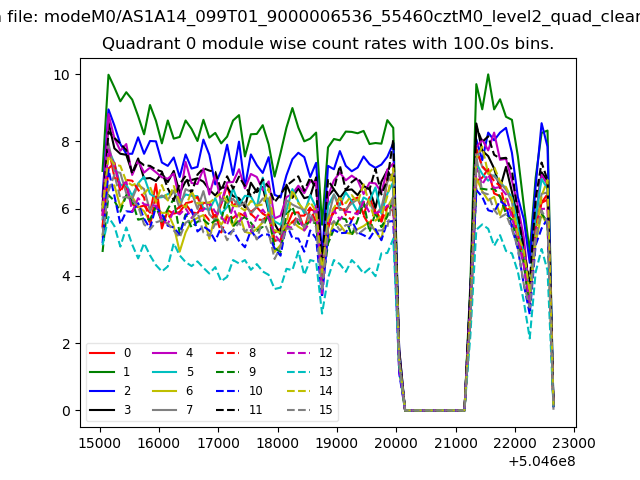 |
 |
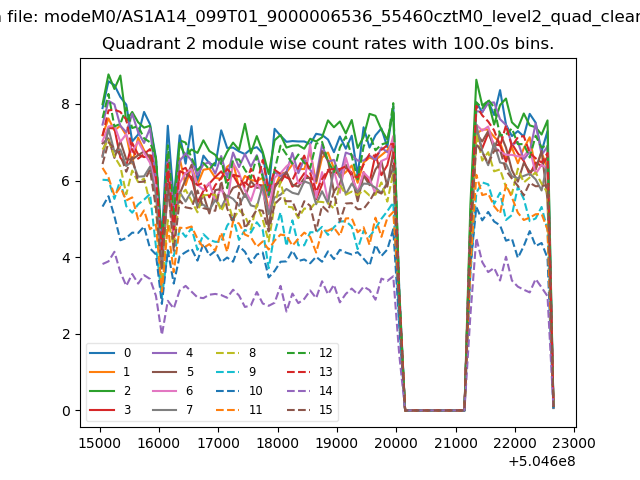
| Module-wise count rates for Quadrant B Data is divided into 100 sec bins |
 |
 |
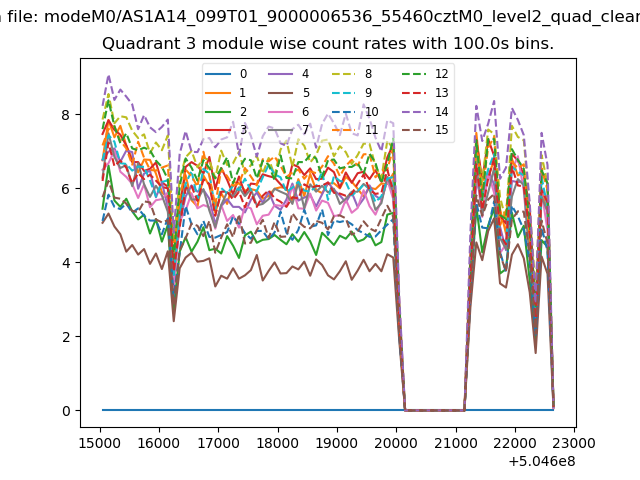
| Module-wise count rates for Quadrant C Data is divided into 100 sec bins |
 |
 |
| Module-wise count rates for Quadrant D Data is divided into 100 sec bins |
 |
 |
| Parameter | Plot |
|---|---|
| CZT HV Monitor | 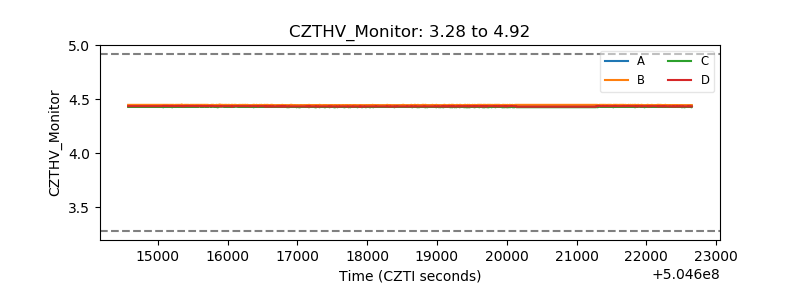 |
| D_VDD | 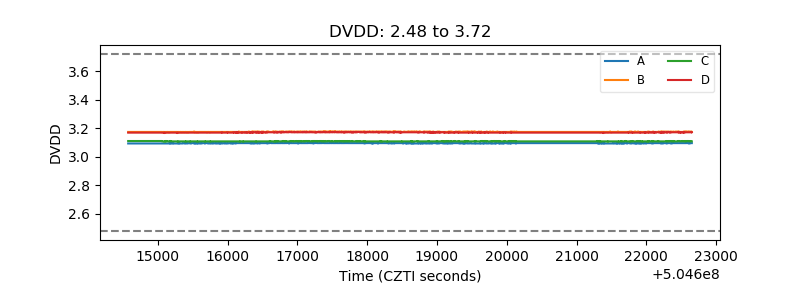 |
| Temperature 1 | 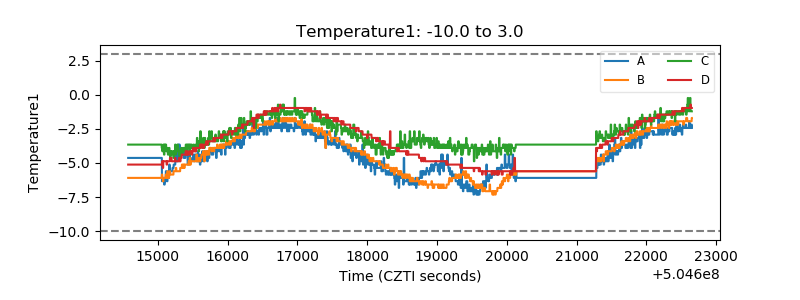 |
| Veto HV Monitor | 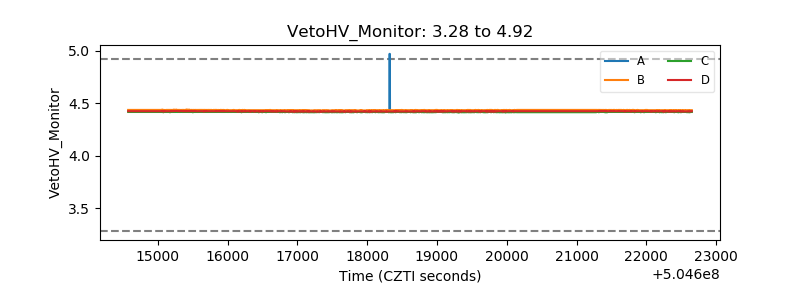 |
| Veto LLD | 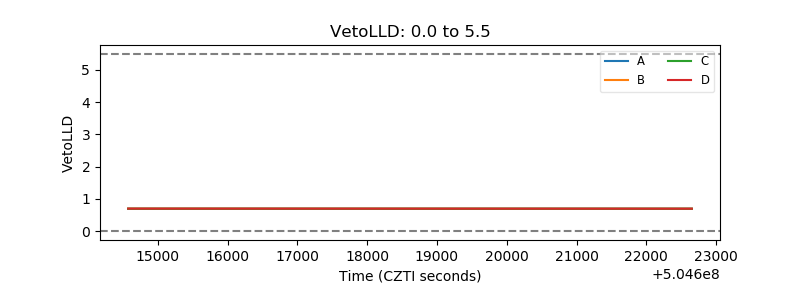 |
| Alpha Counter | 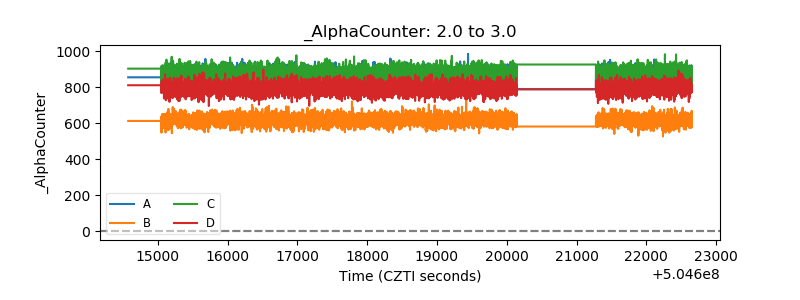 |
| _CPM_Rate | 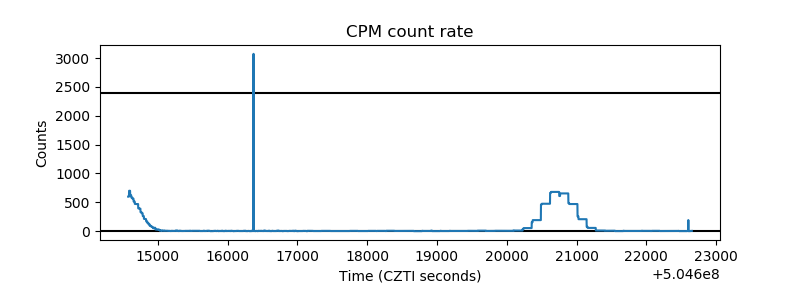 |
| CZT Counter | 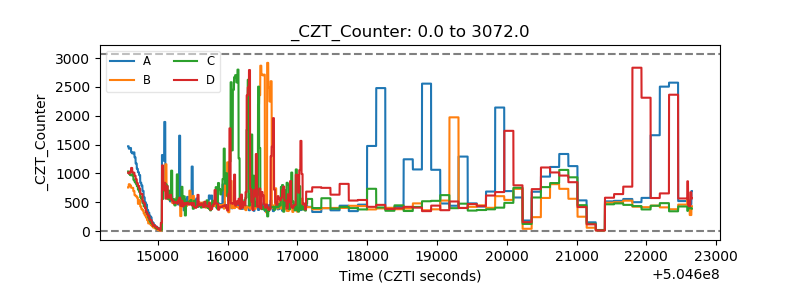 |
| +2.5 Volts monitor | 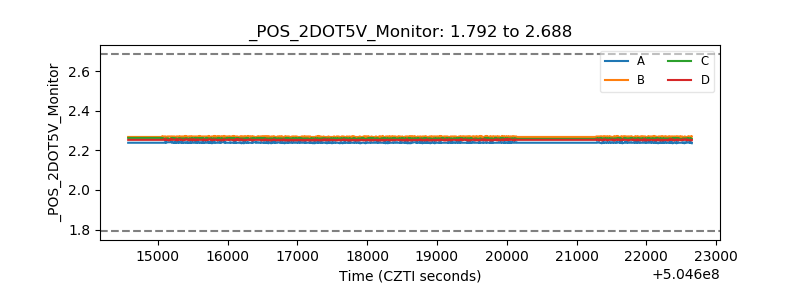 |
| +5 Volts monitor |  |
| _ROLL_ROT | 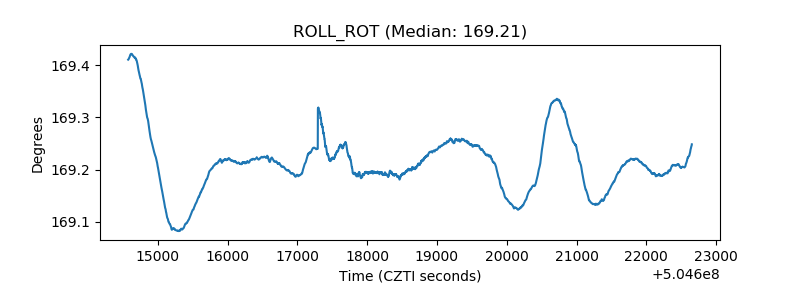 |
| _Roll_DEC | 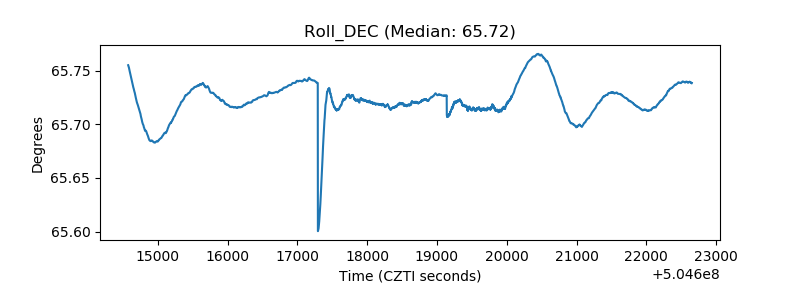 |
| _Roll_RA | 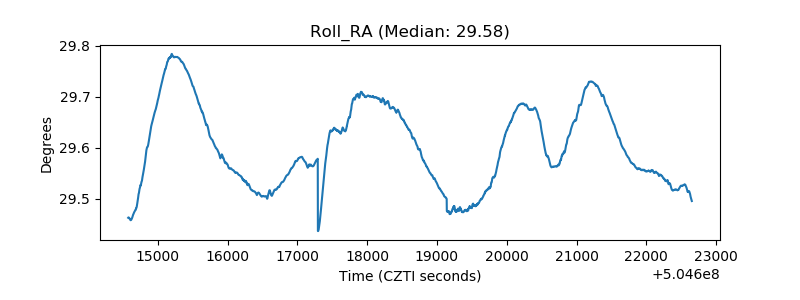 |
| Veto Counter | 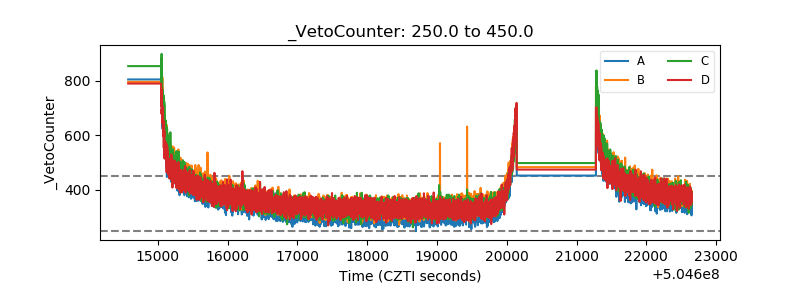 |