| Param | Original file | Final file |
|---|---|---|
| Filename | modeM0/AS1A14_099T01_9000006536_55461cztM0_level2.fits | modeM0/AS1A14_099T01_9000006536_55461cztM0_level2_quad_clean.evt |
| Size (bytes) | 456,724,800 | 98,789,760 |
| Size | 435.6 MB | 94.2 MB |
| Events in quadrant A | 4,784,487 | 636,369 |
| Events in quadrant B | 3,559,875 | 701,298 |
| Events in quadrant C | 3,152,908 | 623,071 |
| Events in quadrant D | 4,895,331 | 570,339 |
| Mode M9 | |||
|---|---|---|---|
| Quadrant | BADHDUFLAG | Total packets | Discarded packets |
| A | 0 | 12 | 0 |
| B | 0 | 12 | 0 |
| C | 0 | 12 | 0 |
| D | 0 | 12 | 0 |
| Mode SS | |||
|---|---|---|---|
| Quadrant | BADHDUFLAG | Total packets | Discarded packets |
| A | 0 | 132 | 0 |
| B | 0 | 132 | 0 |
| C | 0 | 132 | 0 |
| D | 0 | 132 | 0 |
| Mode M0 | |||
|---|---|---|---|
| Quadrant | BADHDUFLAG | Total packets | Discarded packets |
| A | 0 | 18805 | 2 |
| B | 0 | 15378 | 2 |
| C | 0 | 14380 | 2 |
| D | 0 | 19121 | 3 |
| Quadrant | Total seconds | Saturated seconds | Saturation percentage |
|---|---|---|---|
| A | 6607 | 522 | 7.900711% |
| B | 6607 | 225 | 3.405479% |
| C | 6608 | 140 | 2.118644% |
| D | 6607 | 475 | 7.189345% |
Noise dominated data is calculated using 1-second bins in cleaned event files. If a bin has >2000 counts, and if more than 50% of those come from <1% of pixels, then it is considered to be noise-dominated and hence unusable.
| Quadrant | # 1 sec bins | Bins with >0 counts | Bins with >2000 counts | High rate bins dominated by noise | Noise dominated (total time) | Noise dominated (detector-on time) | Marked lightcurve |
|---|---|---|---|---|---|---|---|
| A | 7757 | 6607 | 422 | 422 | 5.44% | 6.39% | 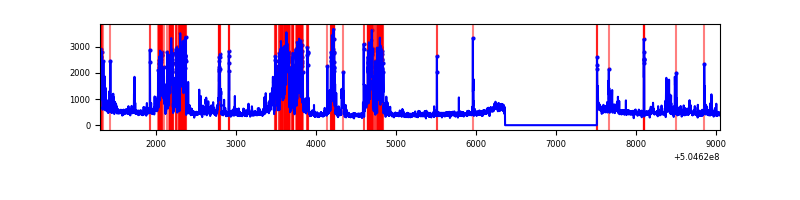 |
| B | 7757 | 6607 | 46 | 46 | 0.59% | 0.70% | 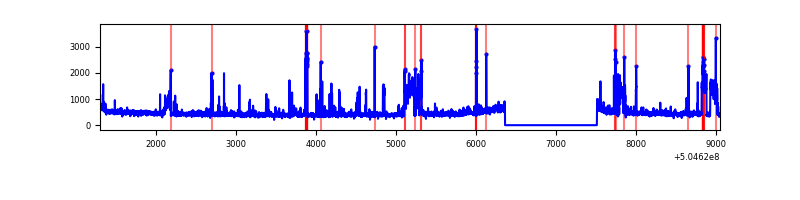 |
| C | 7758 | 6608 | 68 | 68 | 0.88% | 1.03% | 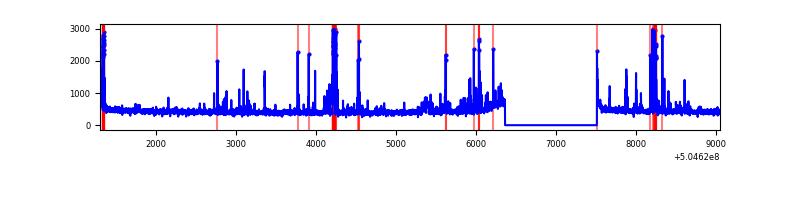 |
| D | 7757 | 6607 | 378 | 378 | 4.87% | 5.72% | 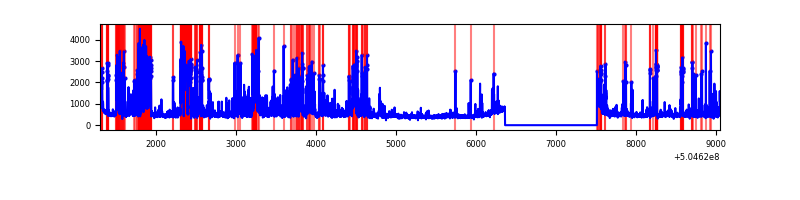 |
Top three noisy pixels from each quadrant. If the there are fewer than three noisy pixels in the level2.evt file, extra rows are filled as -1
| Pixel properties | Quadrant properties | ||||||
|---|---|---|---|---|---|---|---|
| Quadrant | DetID | PixID | Counts | Sigma | Mean | Median | Sigma |
| A | 3 | 78 | 1918903 | 10765.39 | 714 | 695 | 178.2 |
| A | 0 | 8 | 42274 | 233.35 | 714 | 695 | 178.2 |
| A | 7 | 243 | 14490 | 77.42 | 714 | 695 | 178.2 |
| B | 5 | 236 | 453128 | 2996.27 | 711 | 685 | 151.0 |
| B | 0 | 171 | 144570 | 952.87 | 711 | 685 | 151.0 |
| B | 10 | 247 | 49577 | 323.78 | 711 | 685 | 151.0 |
| C | 13 | 3 | 351248 | 1820.81 | 701 | 693 | 192.5 |
| C | 1 | 16 | 24142 | 121.8 | 701 | 693 | 192.5 |
| C | 12 | 252 | 16958 | 84.48 | 701 | 693 | 192.5 |
| D | 8 | 160 | 622550 | 3195.15 | 691 | 659 | 194.6 |
| D | 9 | 65 | 357414 | 1832.93 | 691 | 659 | 194.6 |
| D | 6 | 239 | 351642 | 1803.28 | 691 | 659 | 194.6 |
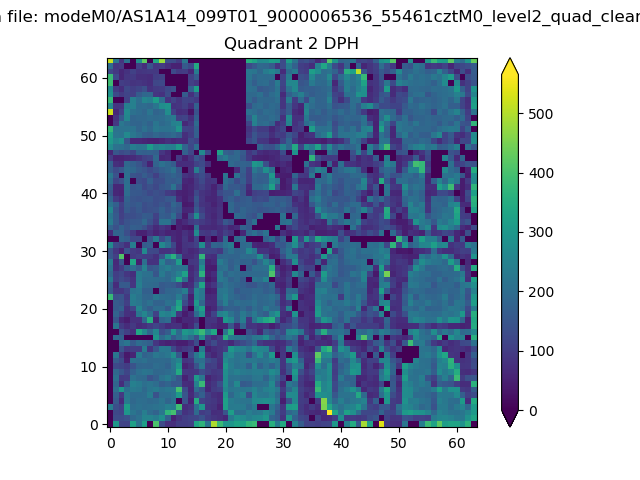
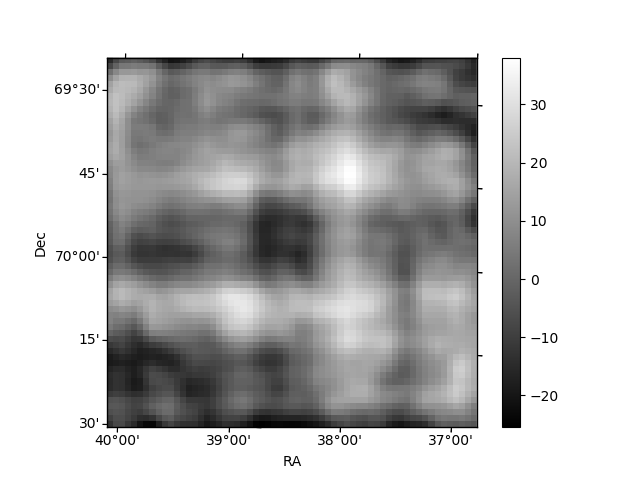
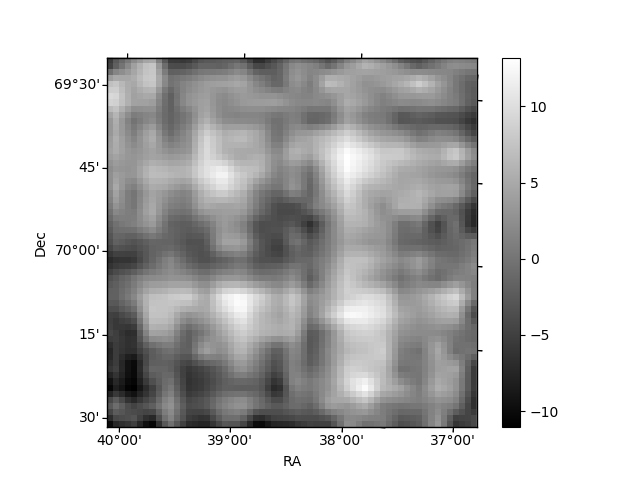
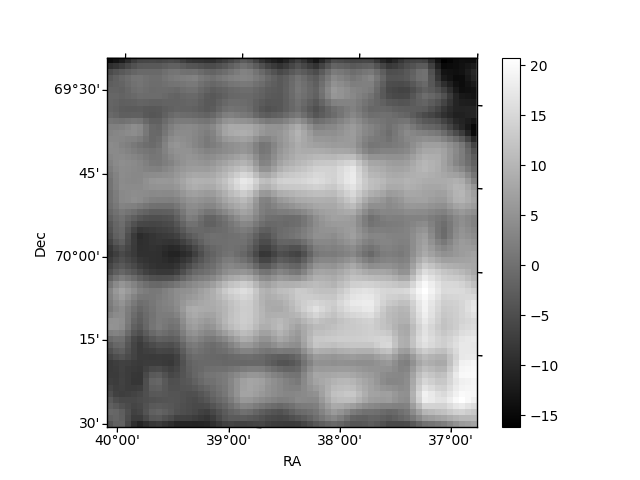
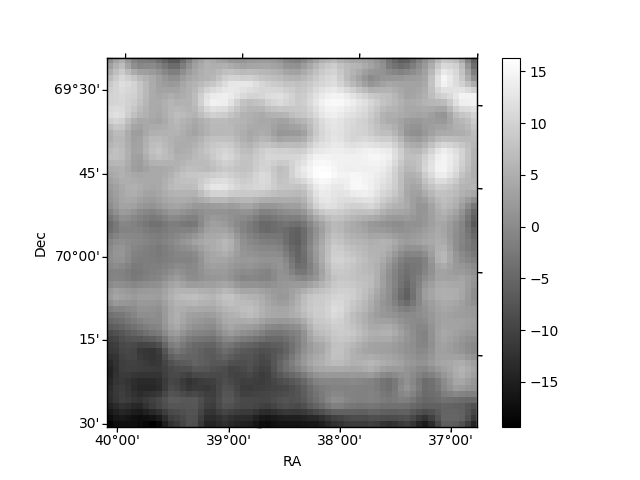
Histogram calculated using DETX and DETY for each event in the final _common_clean file
| Quadrant A | 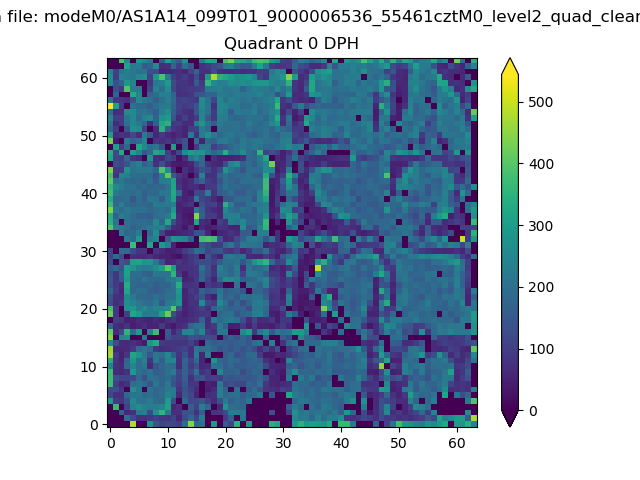 |
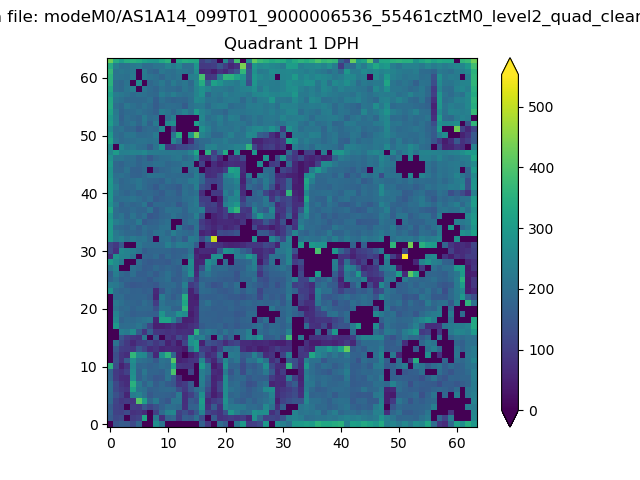 |
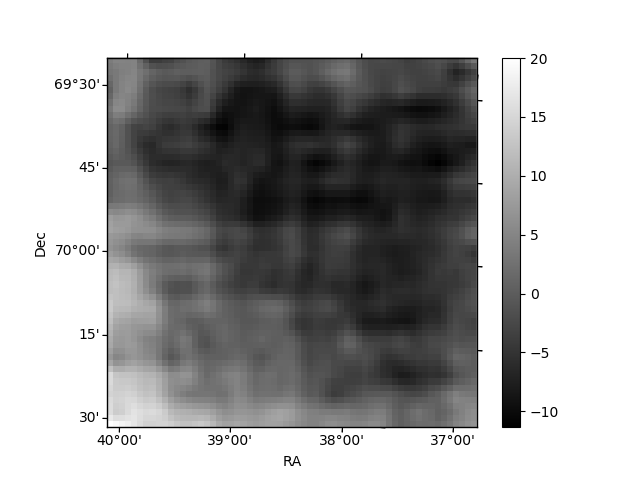
Quadrant B |
|---|---|---|---|
| Quadrant D | 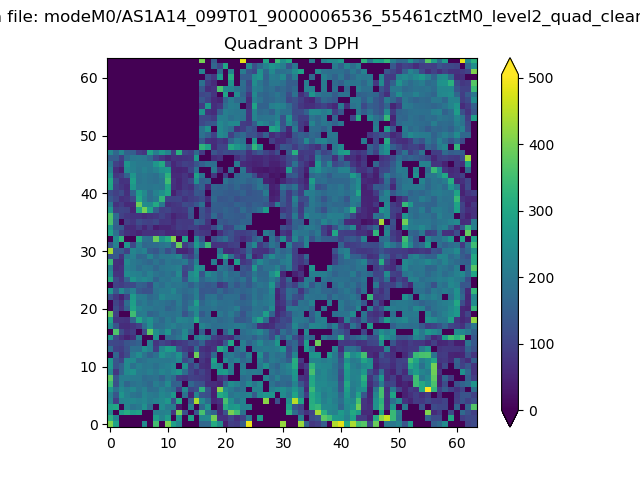 |
 |
Quadrant C |
| Plot type | Count rate plots | Images |
|---|---|---|
| Comparison with Poisson distribution Blue bars denote a histogram of data divided into 1 sec bins. Red curve is a Poisson curve with rate = median count rate of data. |
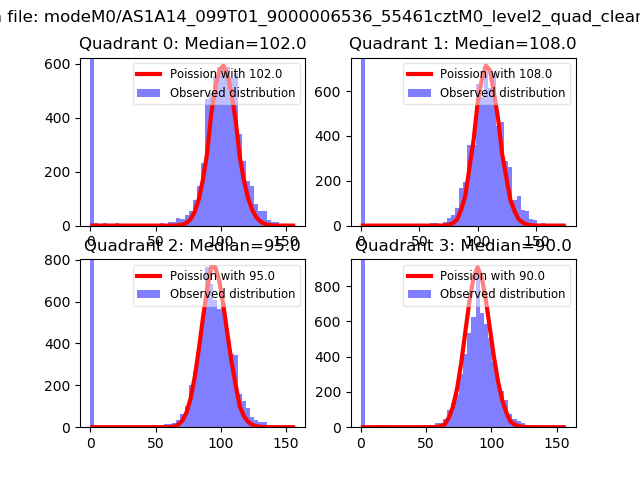 |
 |
| Quadrant-wise count rates Data is divided into 100 sec bins |
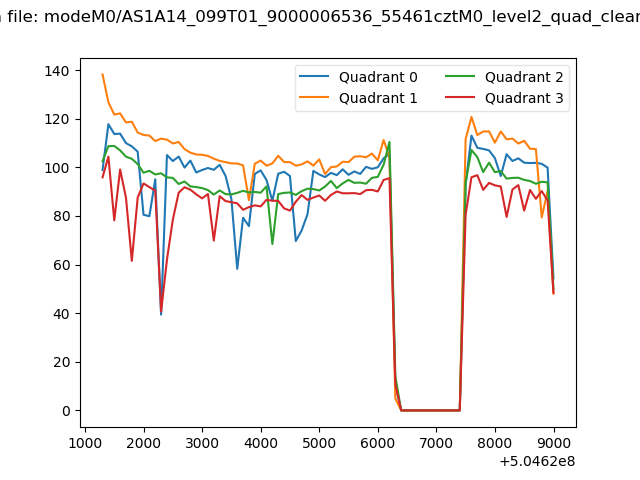 |
|
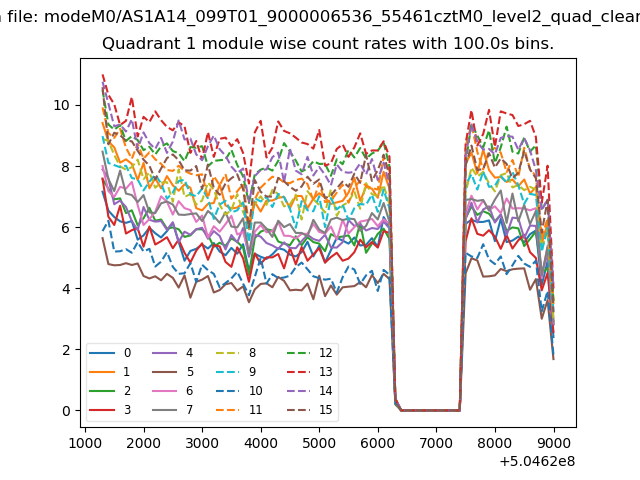
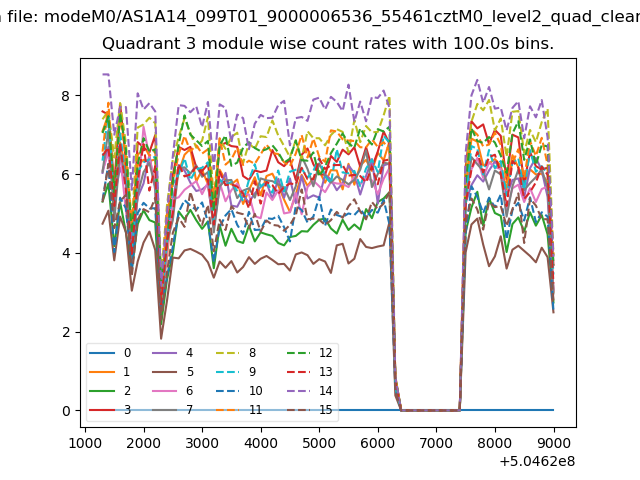
| Module-wise count rates for Quadrant A Data is divided into 100 sec bins |
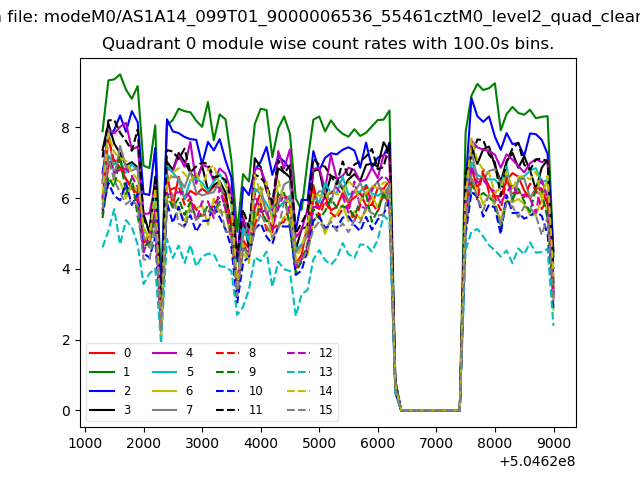 |
 |
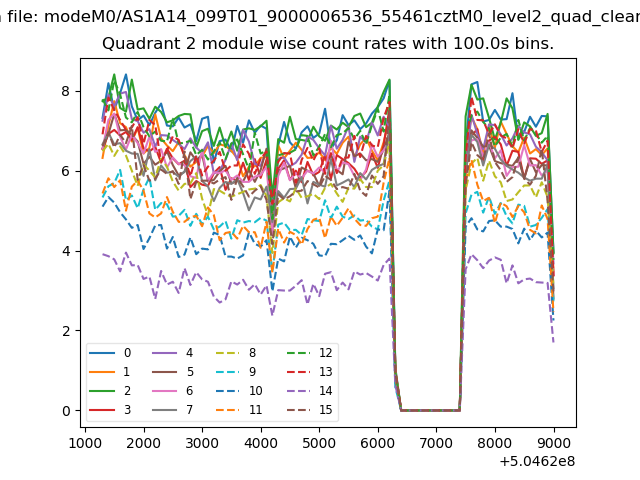
| Module-wise count rates for Quadrant B Data is divided into 100 sec bins |
 |
 |
| Module-wise count rates for Quadrant C Data is divided into 100 sec bins |
 |
 |
| Module-wise count rates for Quadrant D Data is divided into 100 sec bins |
 |
 |
| Parameter | Plot |
|---|---|
| CZT HV Monitor | 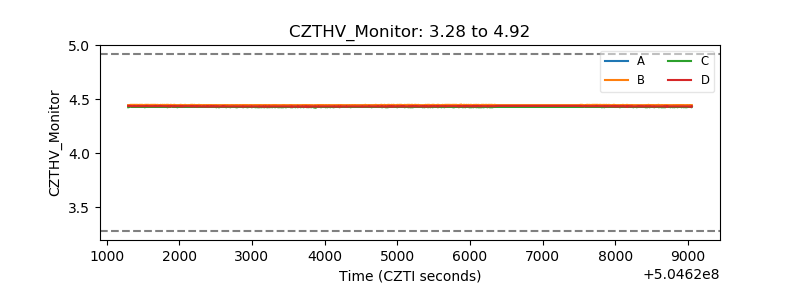 |
| D_VDD | 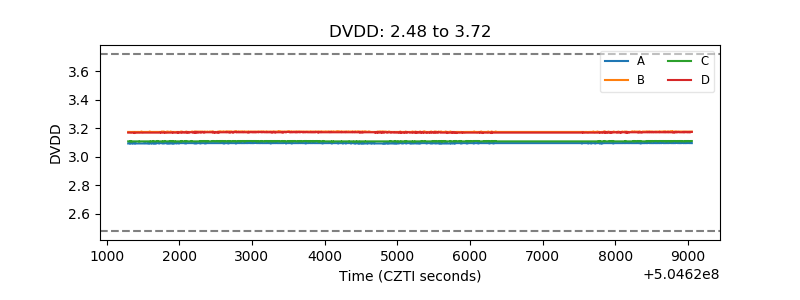 |
| Temperature 1 | 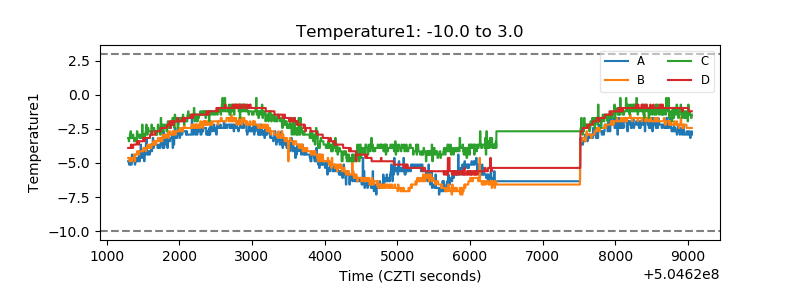 |
| Veto HV Monitor | 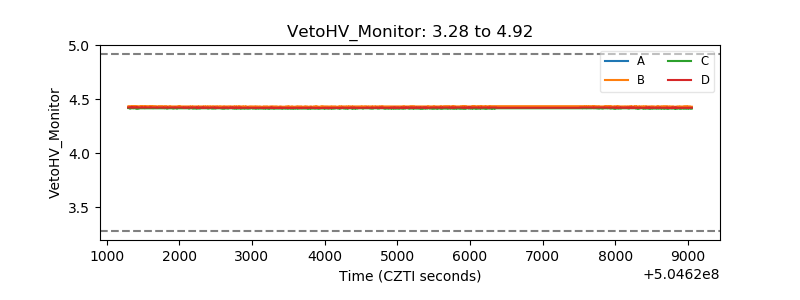 |
| Veto LLD | 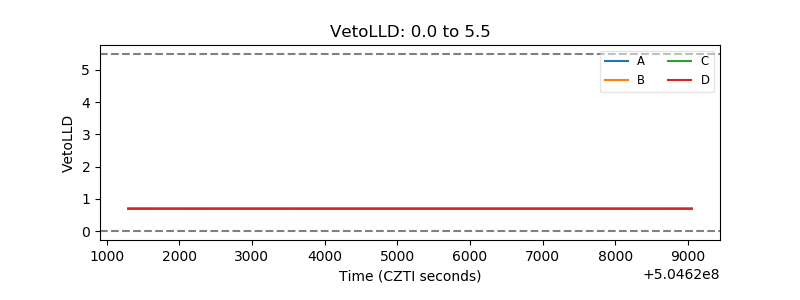 |
| Alpha Counter | 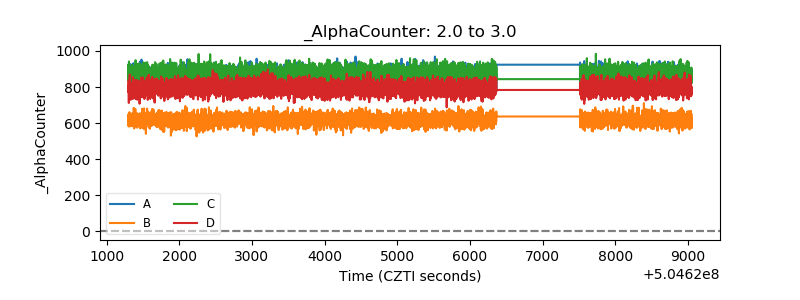 |
| _CPM_Rate | 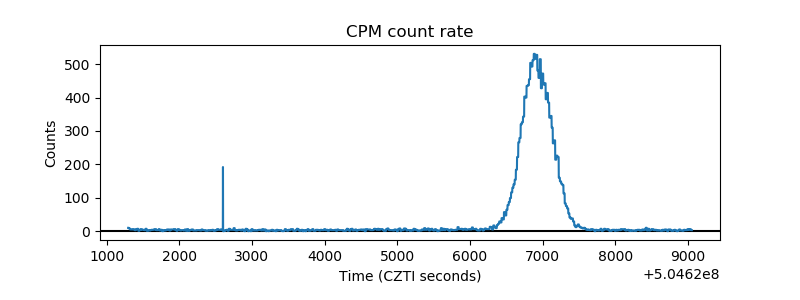 |
| CZT Counter | 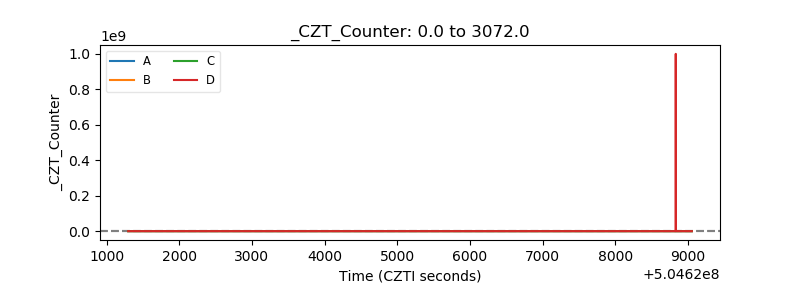 |
| +2.5 Volts monitor |  |
| +5 Volts monitor | 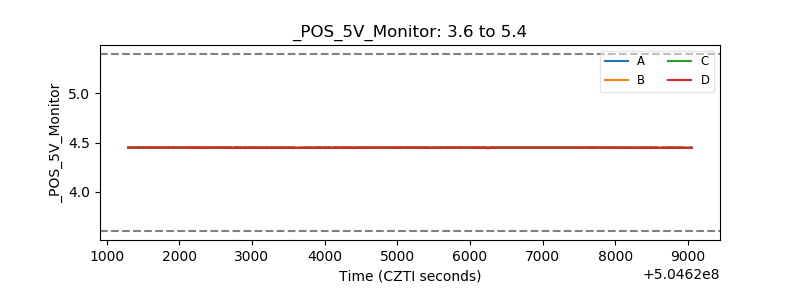 |
| _ROLL_ROT | 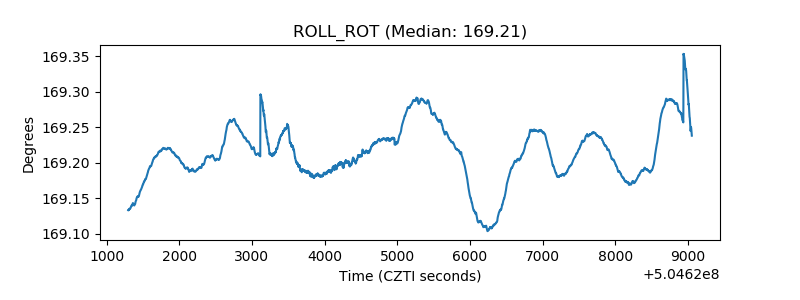 |
| _Roll_DEC | 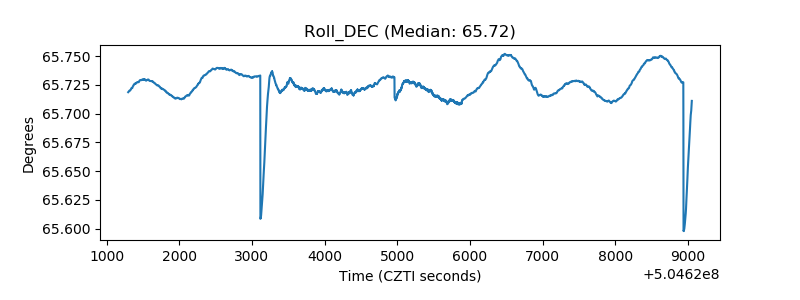 |
| _Roll_RA | 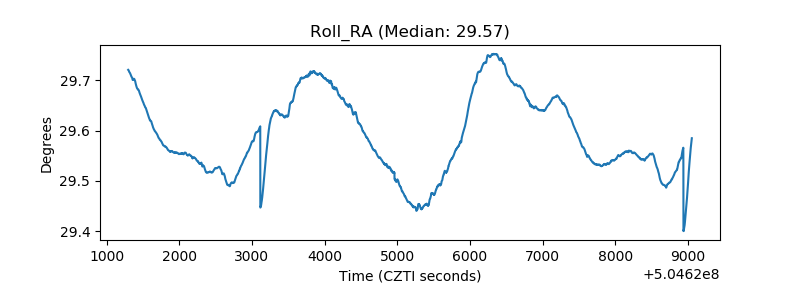 |
| Veto Counter | 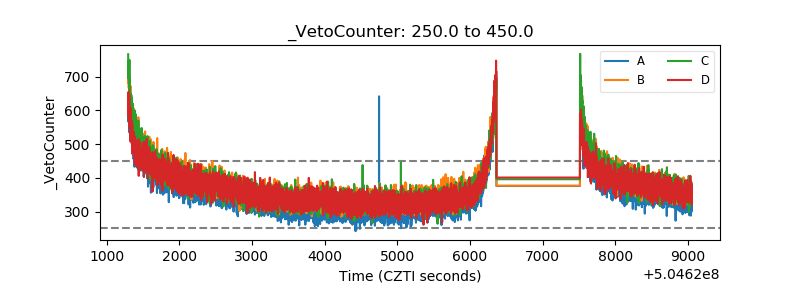 |