| Param | Original file | Final file |
|---|---|---|
| Filename | modeM0/AS1A14_099T01_9000006536_55463cztM0_level2.fits | modeM0/AS1A14_099T01_9000006536_55463cztM0_level2_quad_clean.evt |
| Size (bytes) | 496,759,680 | 99,541,440 |
| Size | 473.7 MB | 94.9 MB |
| Events in quadrant A | 3,568,049 | 669,469 |
| Events in quadrant B | 3,546,532 | 713,207 |
| Events in quadrant C | 5,833,713 | 563,703 |
| Events in quadrant D | 4,898,588 | 581,599 |
| Mode M9 | |||
|---|---|---|---|
| Quadrant | BADHDUFLAG | Total packets | Discarded packets |
| A | 0 | 8 | 0 |
| B | 0 | 8 | 0 |
| C | 0 | 8 | 0 |
| D | 0 | 9 | 0 |
| Mode SS | |||
|---|---|---|---|
| Quadrant | BADHDUFLAG | Total packets | Discarded packets |
| A | 0 | 144 | 0 |
| B | 0 | 144 | 0 |
| C | 0 | 144 | 0 |
| D | 0 | 144 | 0 |
| Mode M0 | |||
|---|---|---|---|
| Quadrant | BADHDUFLAG | Total packets | Discarded packets |
| A | 0 | 15721 | 3 |
| B | 0 | 15671 | 3 |
| C | 0 | 22303 | 3 |
| D | 0 | 19608 | 6 |
| Quadrant | Total seconds | Saturated seconds | Saturation percentage |
|---|---|---|---|
| A | 6967 | 113 | 1.621932% |
| B | 6967 | 108 | 1.550165% |
| C | 6967 | 901 | 12.932396% |
| D | 6966 | 392 | 5.627333% |
Noise dominated data is calculated using 1-second bins in cleaned event files. If a bin has >2000 counts, and if more than 50% of those come from <1% of pixels, then it is considered to be noise-dominated and hence unusable.
| Quadrant | # 1 sec bins | Bins with >0 counts | Bins with >2000 counts | High rate bins dominated by noise | Noise dominated (total time) | Noise dominated (detector-on time) | Marked lightcurve |
|---|---|---|---|---|---|---|---|
| A | 7812 | 6969 | 69 | 69 | 0.88% | 0.99% | 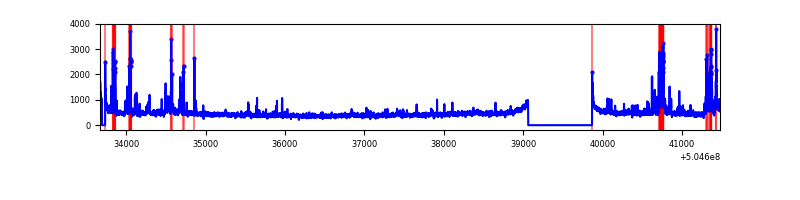 |
| B | 7812 | 6969 | 30 | 30 | 0.38% | 0.43% | 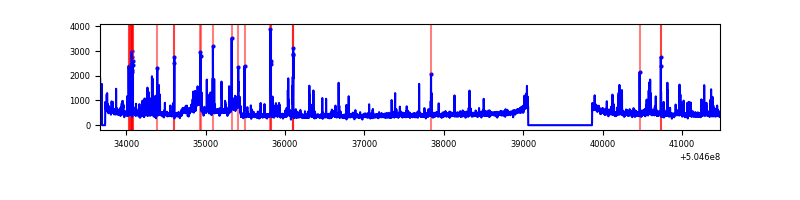 |
| C | 7812 | 6969 | 739 | 739 | 9.46% | 10.60% | 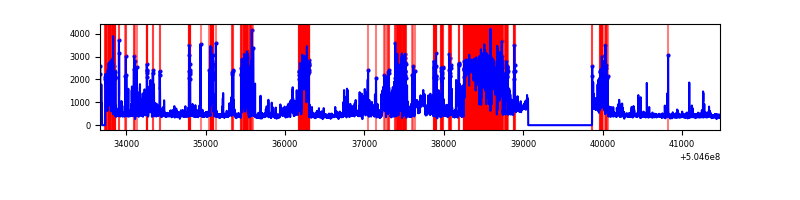 |
| D | 7811 | 6968 | 322 | 322 | 4.12% | 4.62% | 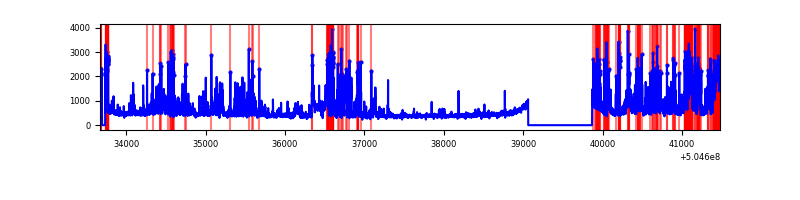 |
Top three noisy pixels from each quadrant. If the there are fewer than three noisy pixels in the level2.evt file, extra rows are filled as -1
| Pixel properties | Quadrant properties | ||||||
|---|---|---|---|---|---|---|---|
| Quadrant | DetID | PixID | Counts | Sigma | Mean | Median | Sigma |
| A | 3 | 78 | 393968 | 2157.87 | 742 | 720 | 182.2 |
| A | 0 | 8 | 158560 | 866.11 | 742 | 720 | 182.2 |
| A | 4 | 3 | 40616 | 218.92 | 742 | 720 | 182.2 |
| B | 5 | 236 | 244508 | 1556.78 | 731 | 704 | 156.6 |
| B | 0 | 171 | 167793 | 1066.93 | 731 | 704 | 156.6 |
| B | 10 | 247 | 75725 | 479.04 | 731 | 704 | 156.6 |
| C | 9 | 38 | 2041709 | 10885.9 | 686 | 675 | 187.5 |
| C | 13 | 3 | 1014227 | 5405.8 | 686 | 675 | 187.5 |
| C | 1 | 16 | 31137 | 162.47 | 686 | 675 | 187.5 |
| D | 11 | 129 | 721746 | 3585.65 | 711 | 680 | 201.1 |
| D | 8 | 160 | 439519 | 2182.22 | 711 | 680 | 201.1 |
| D | 6 | 239 | 286064 | 1419.13 | 711 | 680 | 201.1 |
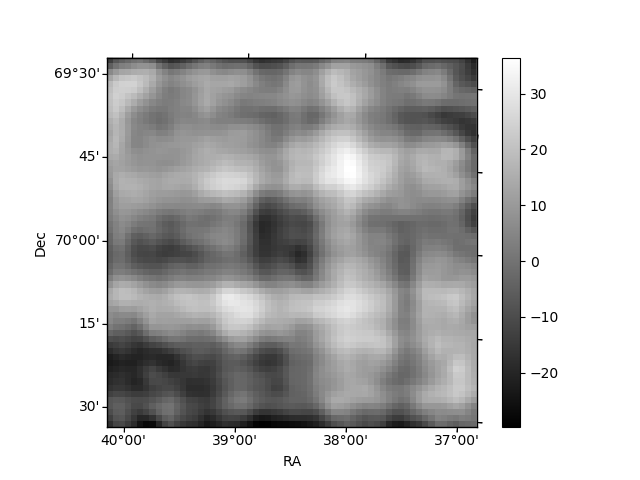
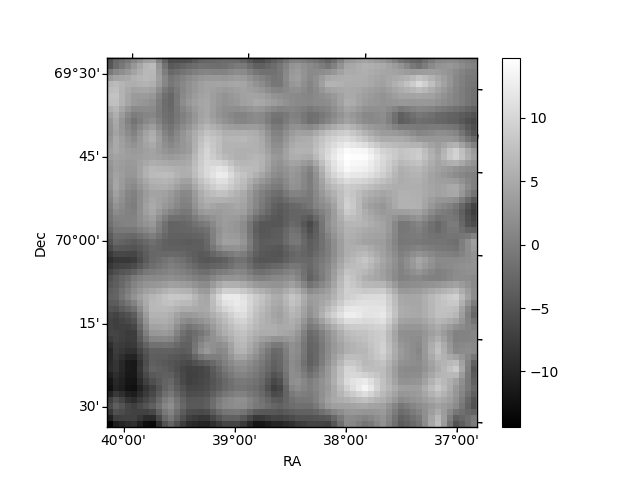
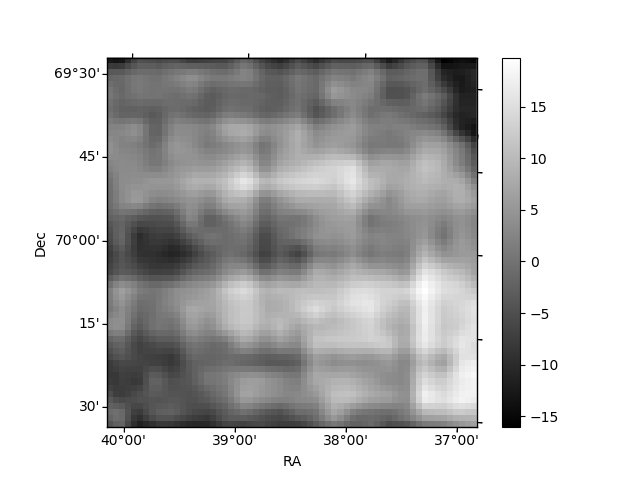
Histogram calculated using DETX and DETY for each event in the final _common_clean file
| Quadrant A | 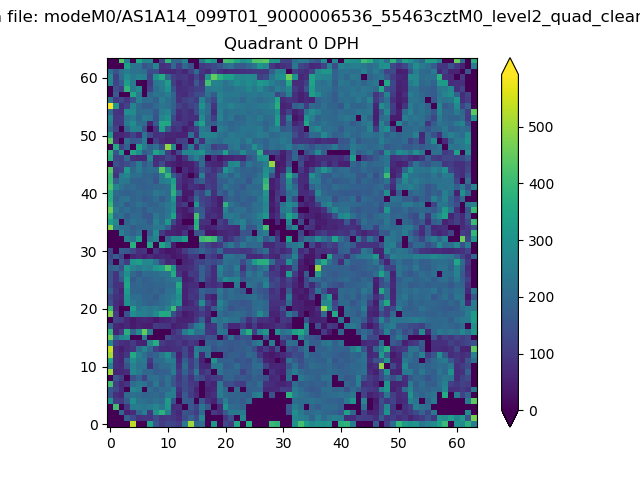 |
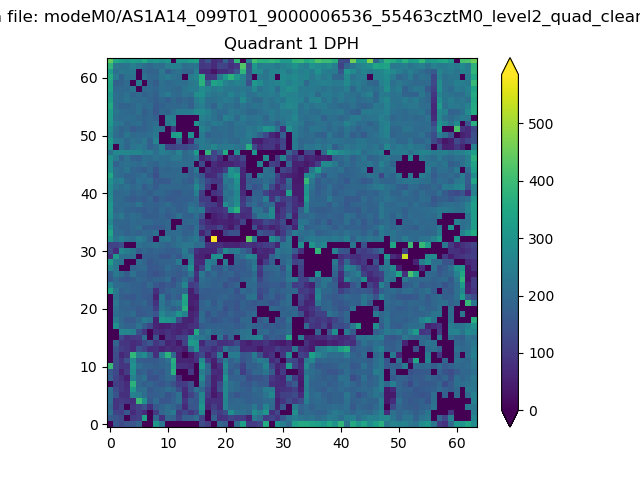 |
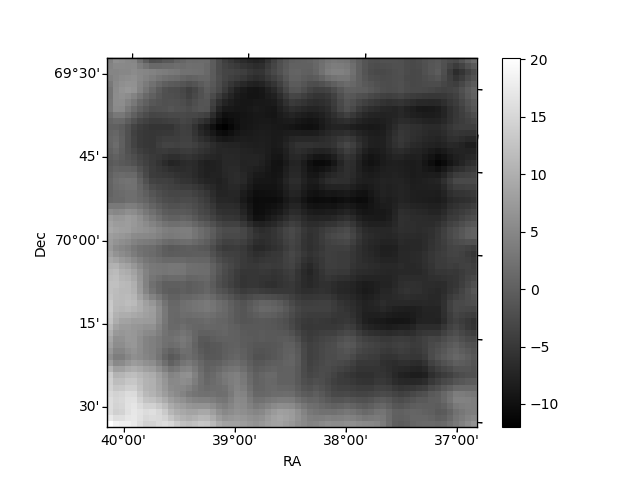
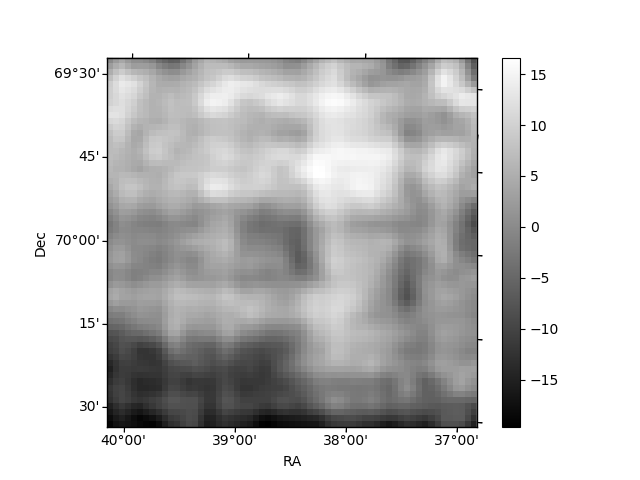
Quadrant B |
|---|---|---|---|
| Quadrant D | 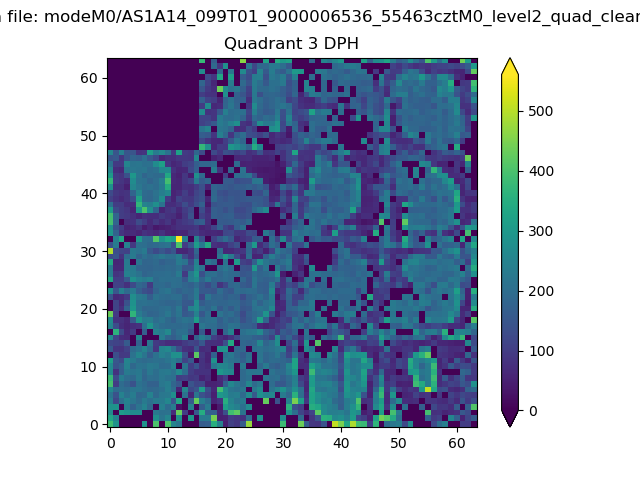 |
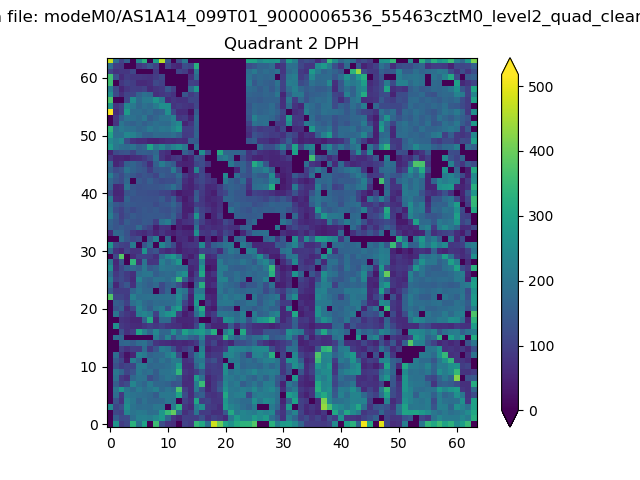 |
Quadrant C |
| Plot type | Count rate plots | Images |
|---|---|---|
| Comparison with Poisson distribution Blue bars denote a histogram of data divided into 1 sec bins. Red curve is a Poisson curve with rate = median count rate of data. |
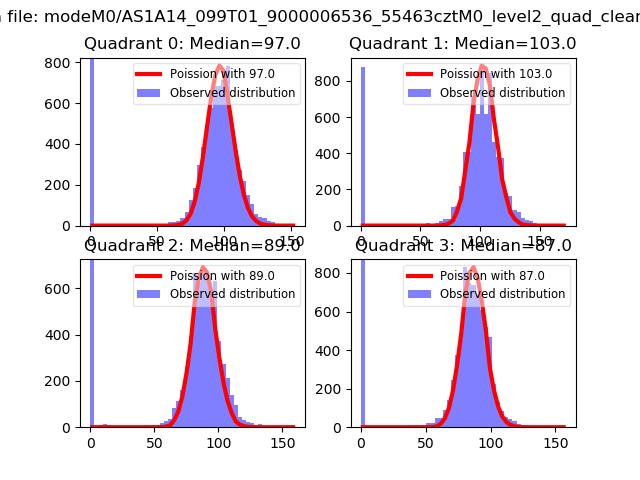 |
 |
| Quadrant-wise count rates Data is divided into 100 sec bins |
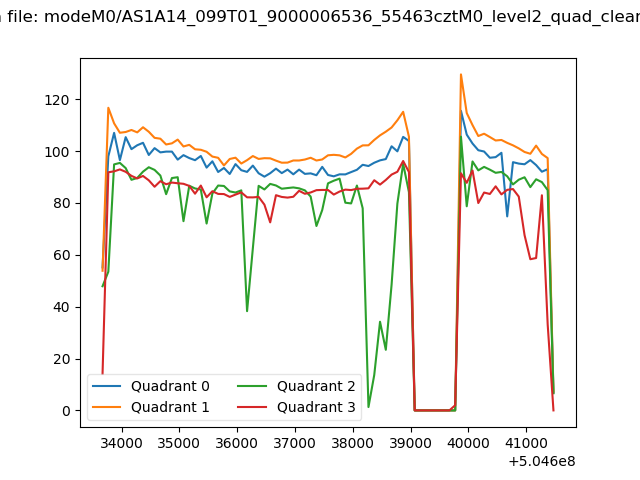 |
|
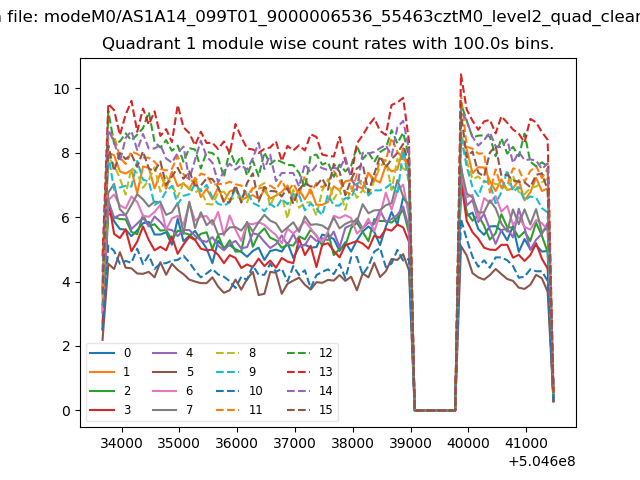
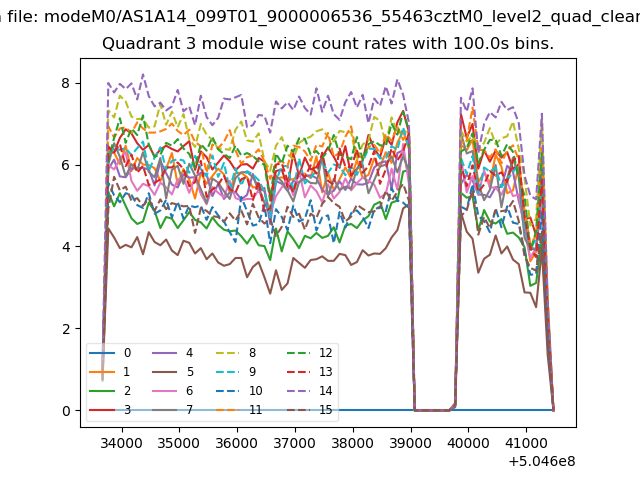
| Module-wise count rates for Quadrant A Data is divided into 100 sec bins |
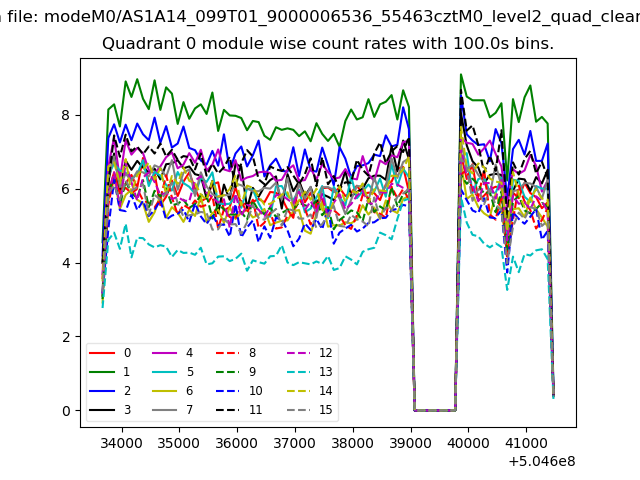 |
 |
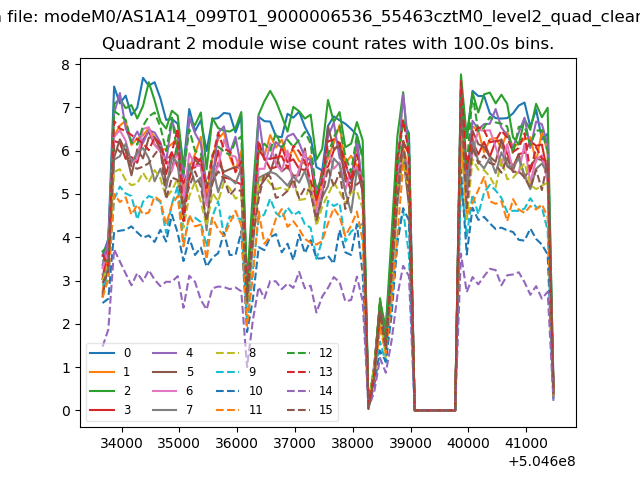
| Module-wise count rates for Quadrant B Data is divided into 100 sec bins |
 |
 |
| Module-wise count rates for Quadrant C Data is divided into 100 sec bins |
 |
 |
| Module-wise count rates for Quadrant D Data is divided into 100 sec bins |
 |
 |
| Parameter | Plot |
|---|---|
| CZT HV Monitor | 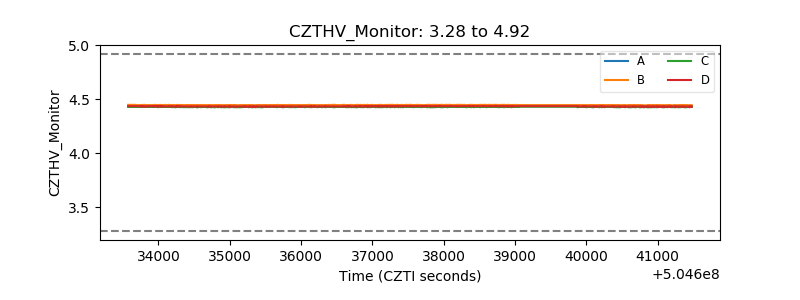 |
| D_VDD | 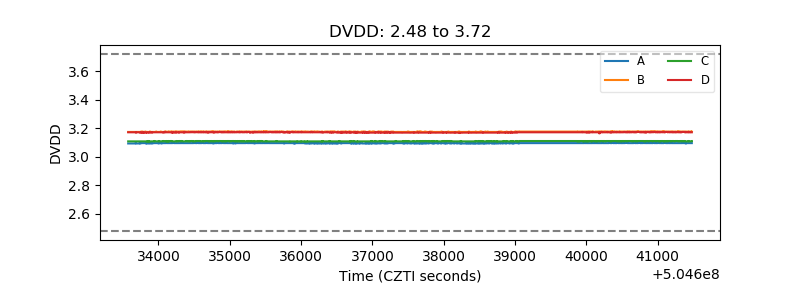 |
| Temperature 1 | 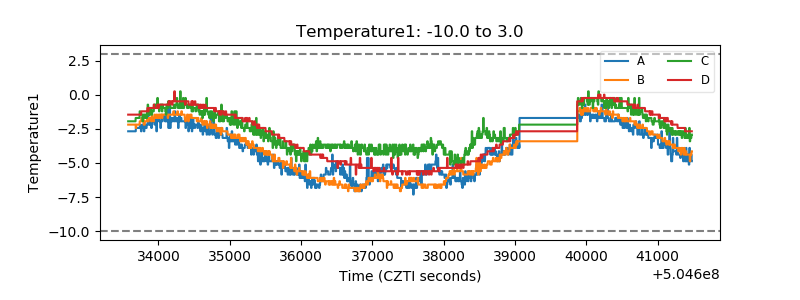 |
| Veto HV Monitor | 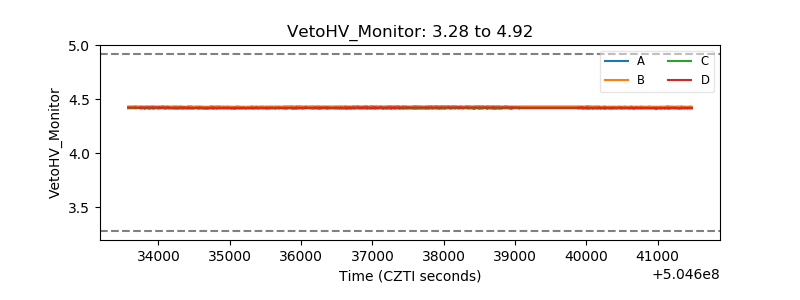 |
| Veto LLD | 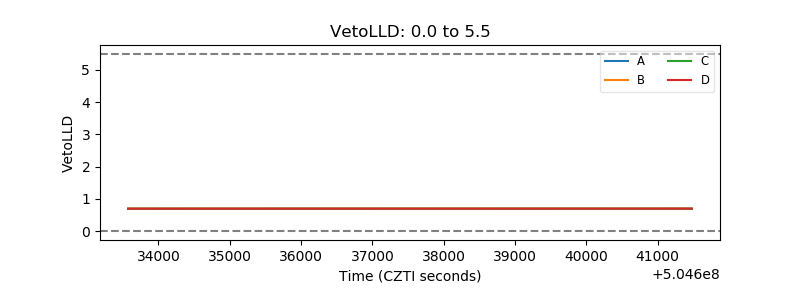 |
| Alpha Counter | 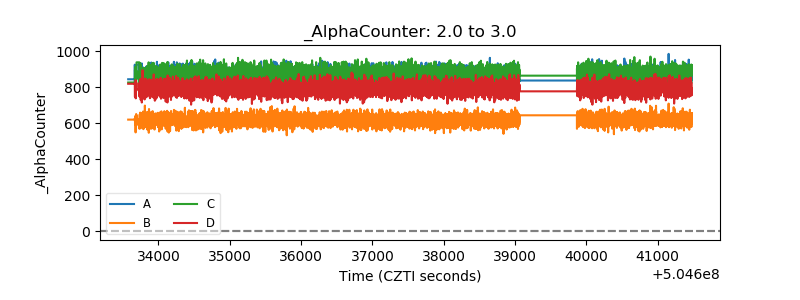 |
| _CPM_Rate | 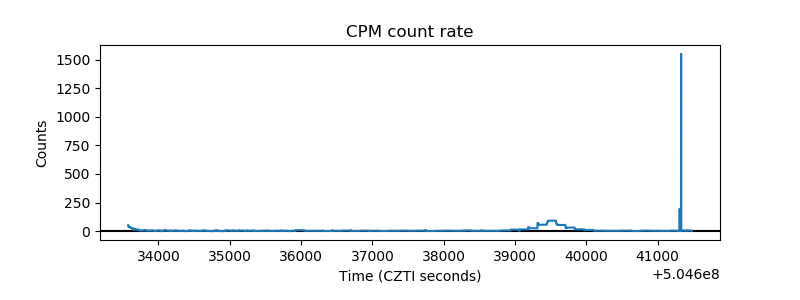 |
| CZT Counter | 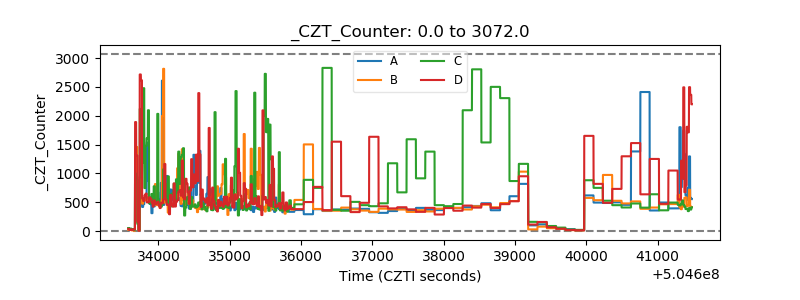 |
| +2.5 Volts monitor | 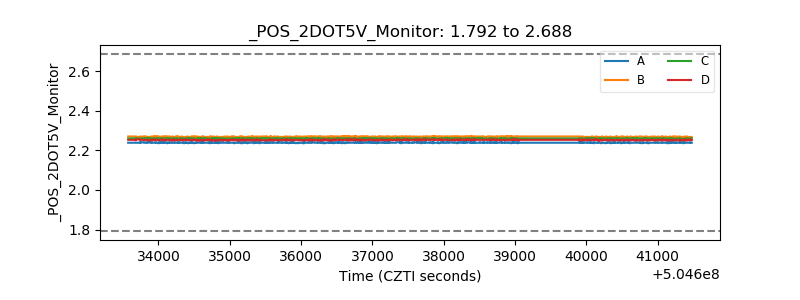 |
| +5 Volts monitor | 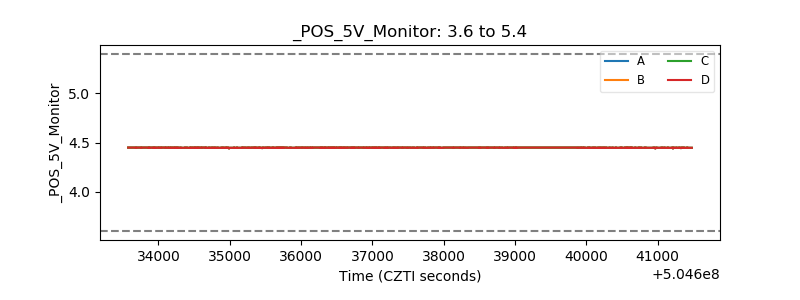 |
| _ROLL_ROT | 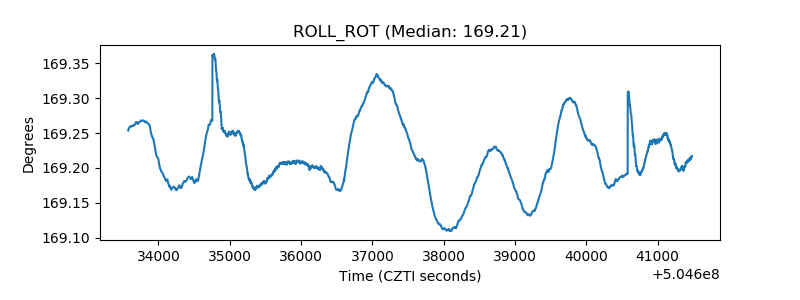 |
| _Roll_DEC | 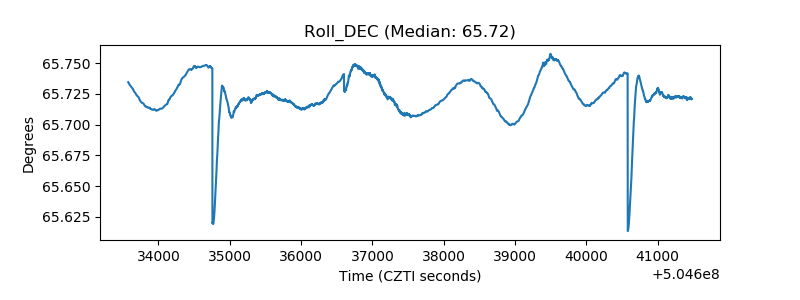 |
| _Roll_RA | 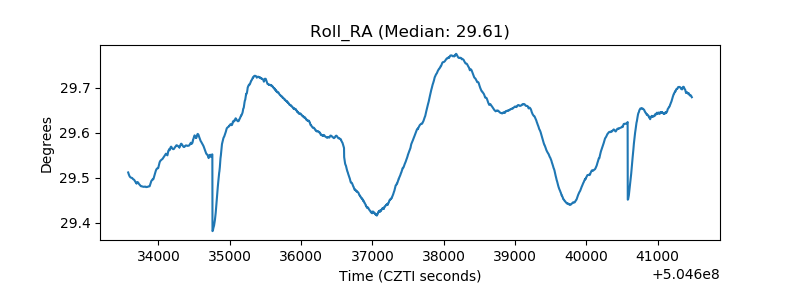 |
| Veto Counter | 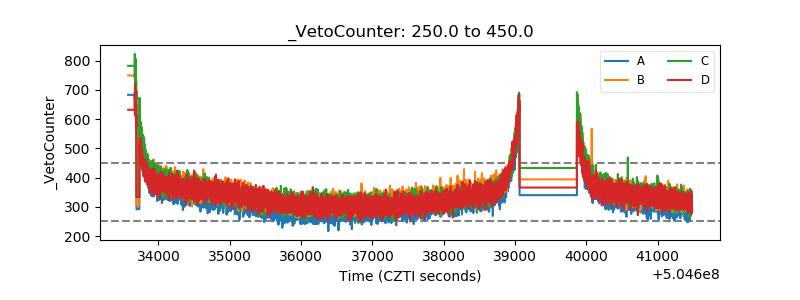 |