| Param | Original file | Final file |
|---|---|---|
| Filename | modeM0/AS1A14_099T01_9000006536_55464cztM0_level2.fits | modeM0/AS1A14_099T01_9000006536_55464cztM0_level2_quad_clean.evt |
| Size (bytes) | 532,843,200 | 104,722,560 |
| Size | 508.2 MB | 99.9 MB |
| Events in quadrant A | 5,950,333 | 625,704 |
| Events in quadrant B | 3,778,810 | 751,816 |
| Events in quadrant C | 3,582,301 | 670,916 |
| Events in quadrant D | 5,833,754 | 603,864 |
| Mode M9 | |||
|---|---|---|---|
| Quadrant | BADHDUFLAG | Total packets | Discarded packets |
| A | 0 | 5 | 0 |
| B | 0 | 5 | 0 |
| C | 0 | 5 | 1 |
| D | 0 | 5 | 0 |
| Mode SS | |||
|---|---|---|---|
| Quadrant | BADHDUFLAG | Total packets | Discarded packets |
| A | 0 | 152 | 0 |
| B | 0 | 152 | 0 |
| C | 0 | 152 | 0 |
| D | 0 | 152 | 0 |
| Mode M0 | |||
|---|---|---|---|
| Quadrant | BADHDUFLAG | Total packets | Discarded packets |
| A | 0 | 23149 | 2 |
| B | 0 | 16576 | 2 |
| C | 0 | 16521 | 2 |
| D | 0 | 22573 | 2 |
| Quadrant | Total seconds | Saturated seconds | Saturation percentage |
|---|---|---|---|
| A | 7448 | 909 | 12.204619% |
| B | 7448 | 142 | 1.906552% |
| C | 7447 | 109 | 1.463677% |
| D | 7447 | 562 | 7.546663% |
Noise dominated data is calculated using 1-second bins in cleaned event files. If a bin has >2000 counts, and if more than 50% of those come from <1% of pixels, then it is considered to be noise-dominated and hence unusable.
| Quadrant | # 1 sec bins | Bins with >0 counts | Bins with >2000 counts | High rate bins dominated by noise | Noise dominated (total time) | Noise dominated (detector-on time) | Marked lightcurve |
|---|---|---|---|---|---|---|---|
| A | 7688 | 7449 | 801 | 801 | 10.42% | 10.75% | 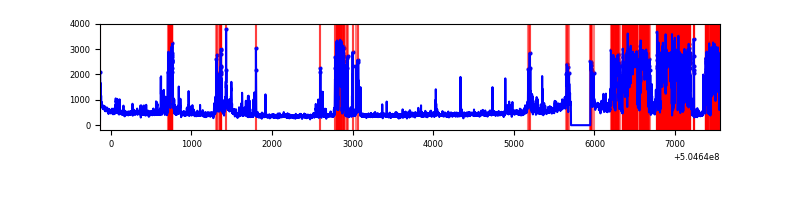 |
| B | 7688 | 7449 | 38 | 38 | 0.49% | 0.51% | 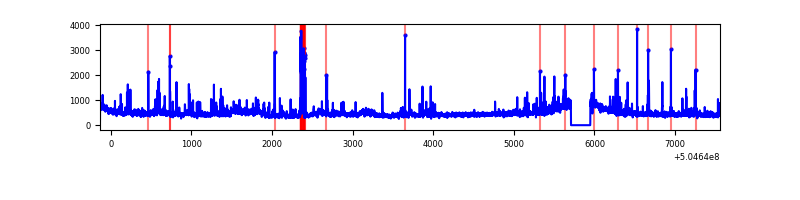 |
| C | 7687 | 7448 | 53 | 53 | 0.69% | 0.71% | 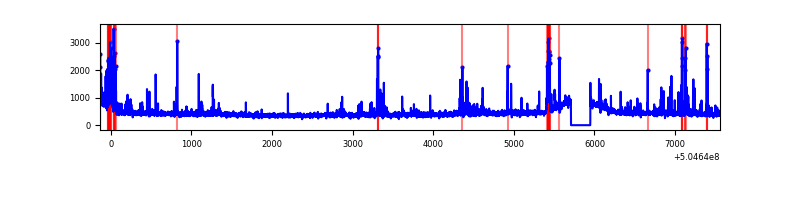 |
| D | 7687 | 7448 | 480 | 480 | 6.24% | 6.44% | 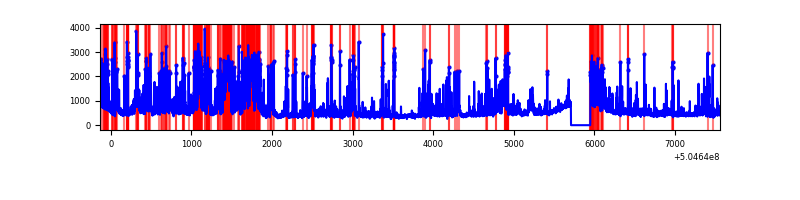 |
Top three noisy pixels from each quadrant. If the there are fewer than three noisy pixels in the level2.evt file, extra rows are filled as -1
| Pixel properties | Quadrant properties | ||||||
|---|---|---|---|---|---|---|---|
| Quadrant | DetID | PixID | Counts | Sigma | Mean | Median | Sigma |
| A | 3 | 78 | 2523802 | 13468.14 | 759 | 739 | 187.3 |
| A | 7 | 14 | 256940 | 1367.6 | 759 | 739 | 187.3 |
| A | 4 | 3 | 63570 | 335.39 | 759 | 739 | 187.3 |
| B | 5 | 236 | 153297 | 899.27 | 795 | 766 | 169.6 |
| B | 0 | 171 | 143084 | 839.05 | 795 | 766 | 169.6 |
| B | 5 | 172 | 90341 | 528.1 | 795 | 766 | 169.6 |
| C | 13 | 3 | 305670 | 1419.96 | 788 | 779 | 214.7 |
| C | 9 | 38 | 115824 | 535.8 | 788 | 779 | 214.7 |
| C | 1 | 16 | 46467 | 212.78 | 788 | 779 | 214.7 |
| D | 11 | 129 | 1443257 | 6747.63 | 763 | 729 | 213.8 |
| D | 8 | 160 | 350461 | 1635.92 | 763 | 729 | 213.8 |
| D | 2 | 31 | 346845 | 1619.01 | 763 | 729 | 213.8 |
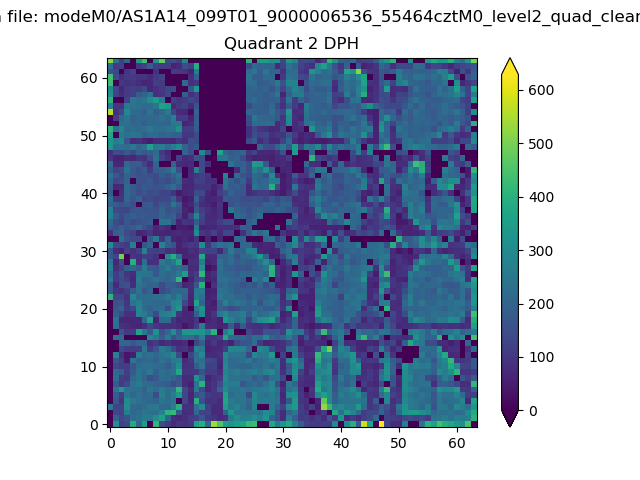
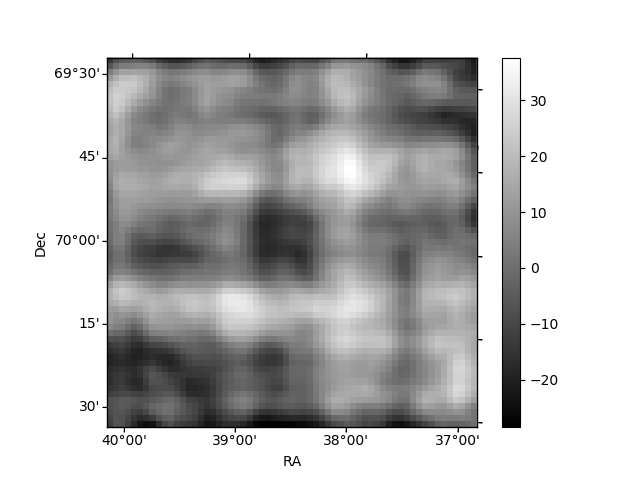
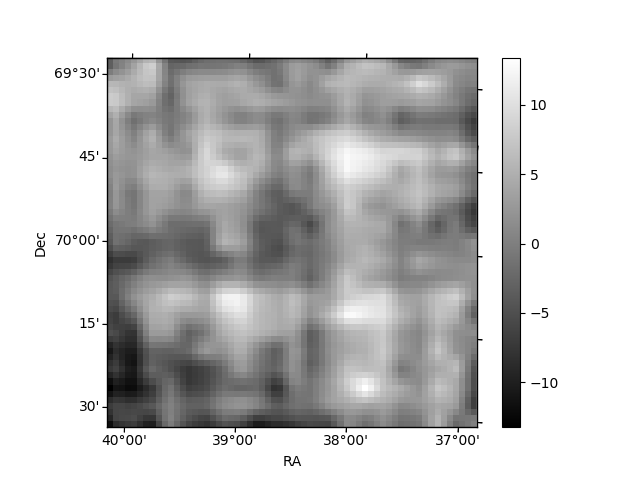
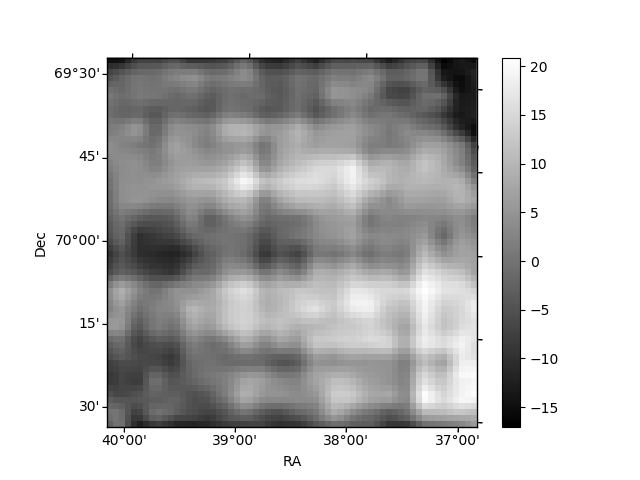
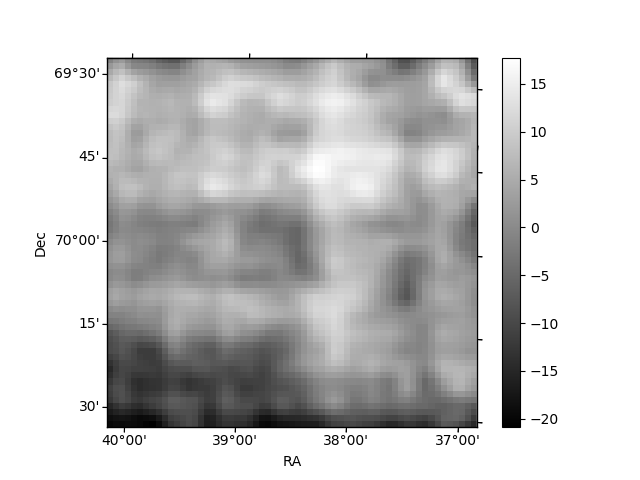
Histogram calculated using DETX and DETY for each event in the final _common_clean file
| Quadrant A | 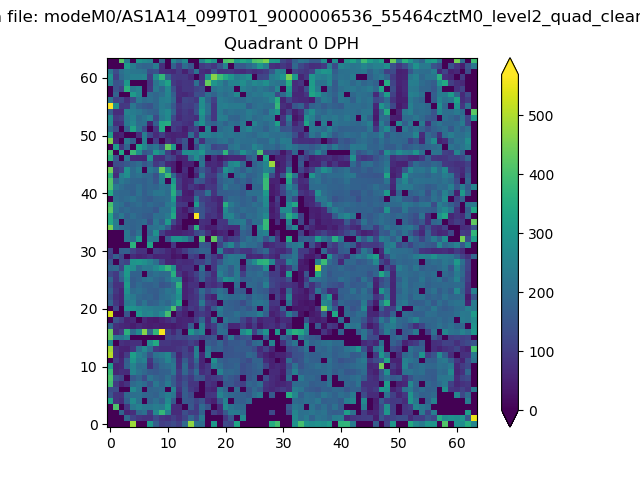 |
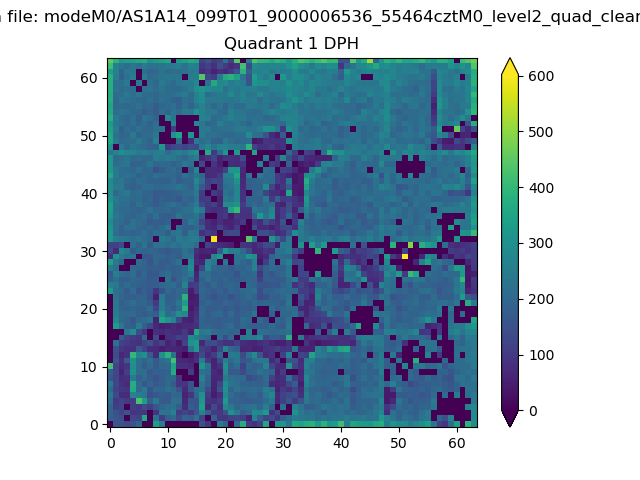 |
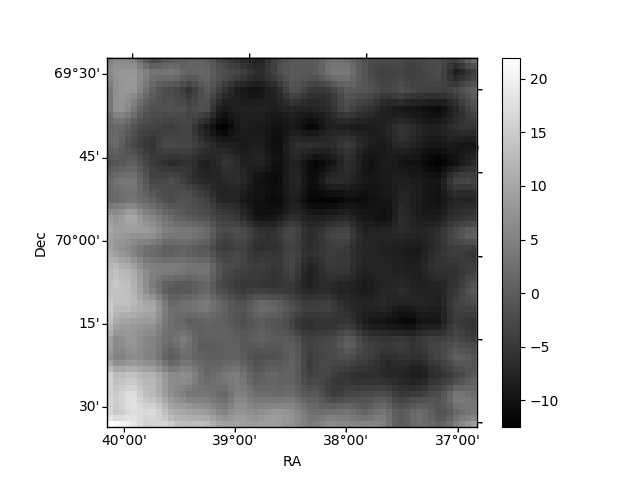
Quadrant B |
|---|---|---|---|
| Quadrant D | 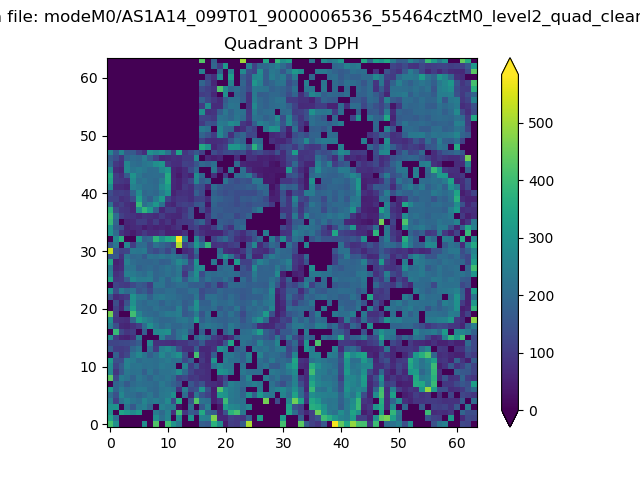 |
 |
Quadrant C |
| Plot type | Count rate plots | Images |
|---|---|---|
| Comparison with Poisson distribution Blue bars denote a histogram of data divided into 1 sec bins. Red curve is a Poisson curve with rate = median count rate of data. |
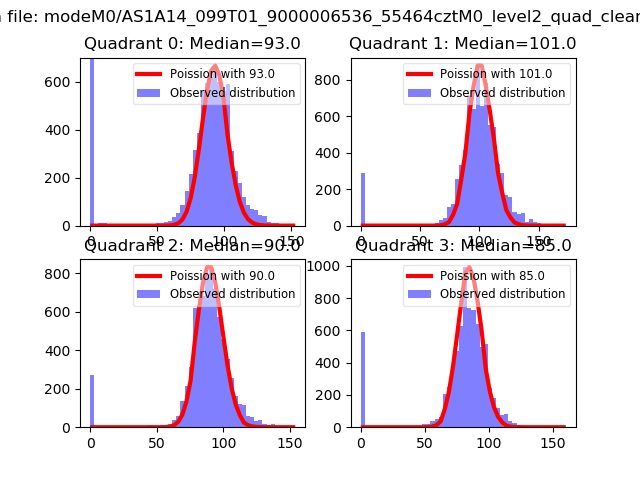 |
 |
| Quadrant-wise count rates Data is divided into 100 sec bins |
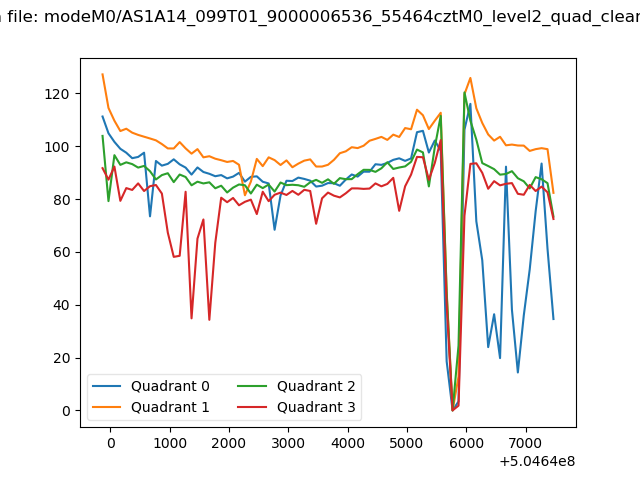 |
|
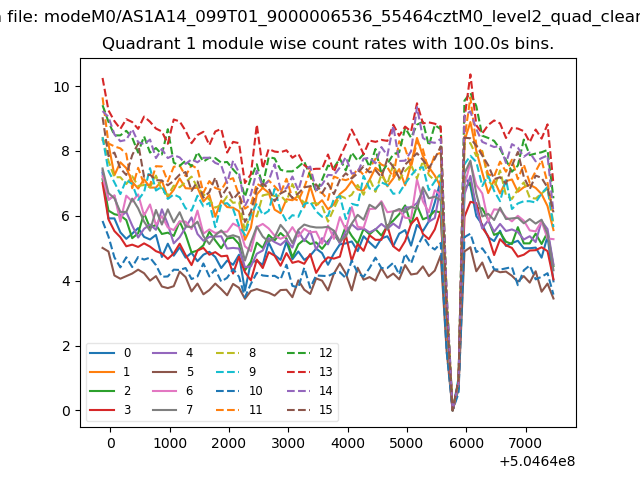
| Module-wise count rates for Quadrant A Data is divided into 100 sec bins |
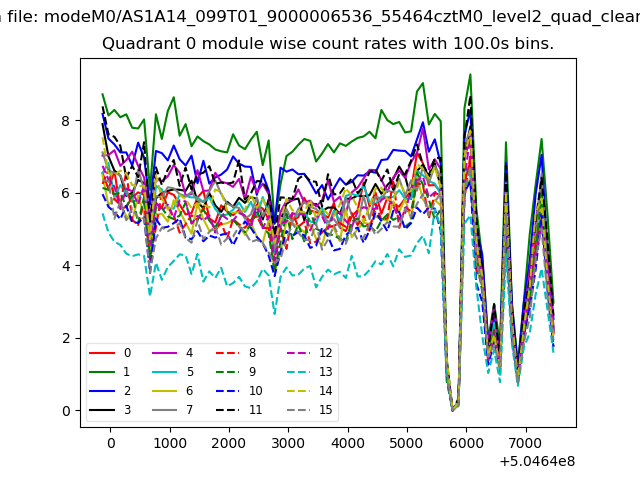 |
 |
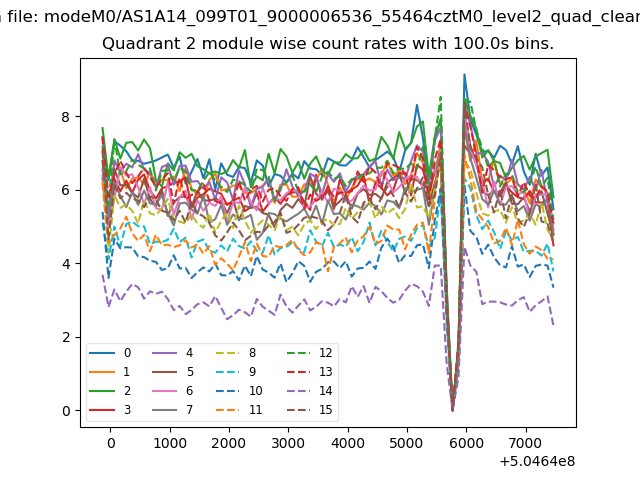
| Module-wise count rates for Quadrant B Data is divided into 100 sec bins |
 |
 |
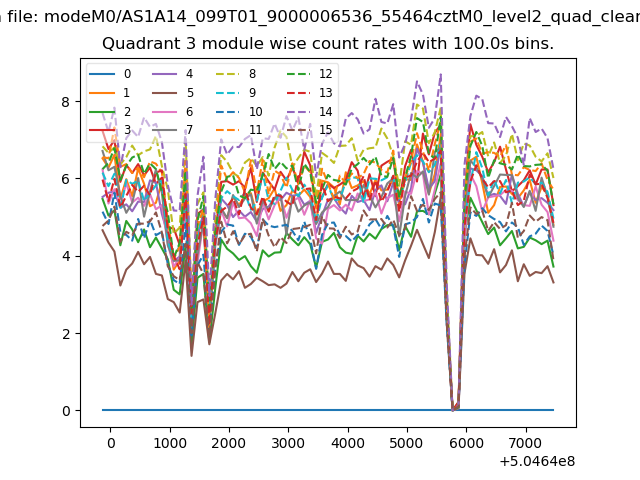
| Module-wise count rates for Quadrant C Data is divided into 100 sec bins |
 |
 |
| Module-wise count rates for Quadrant D Data is divided into 100 sec bins |
 |
 |
| Parameter | Plot |
|---|---|
| CZT HV Monitor | 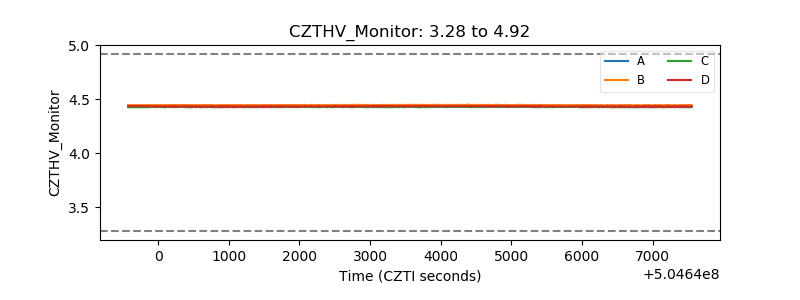 |
| D_VDD | 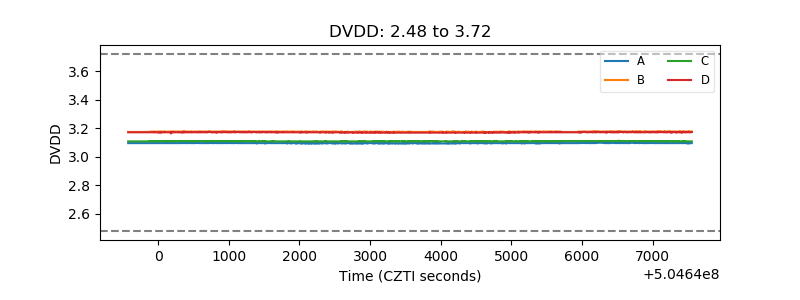 |
| Temperature 1 | 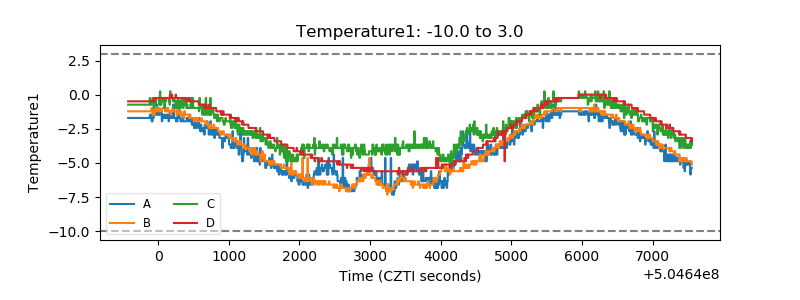 |
| Veto HV Monitor | 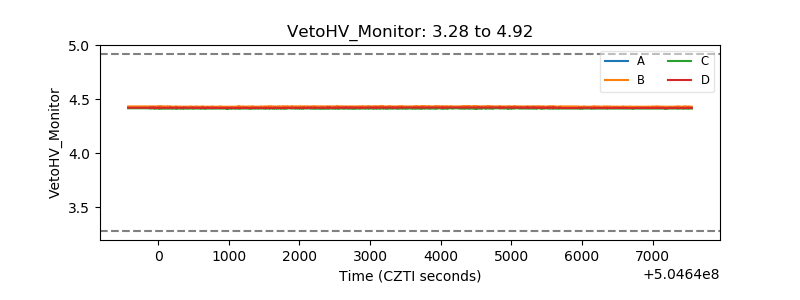 |
| Veto LLD | 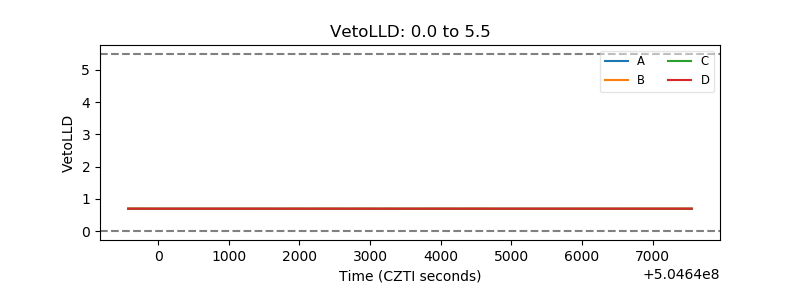 |
| Alpha Counter | 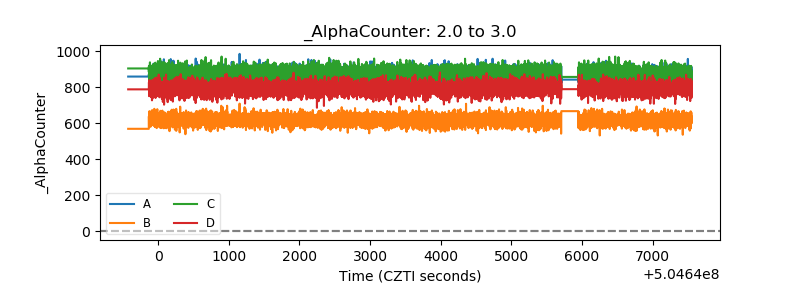 |
| _CPM_Rate | 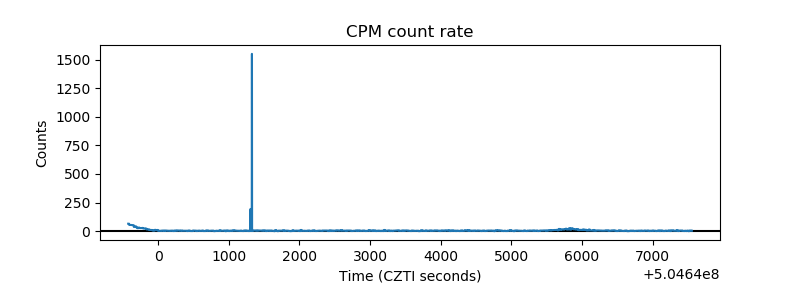 |
| CZT Counter | 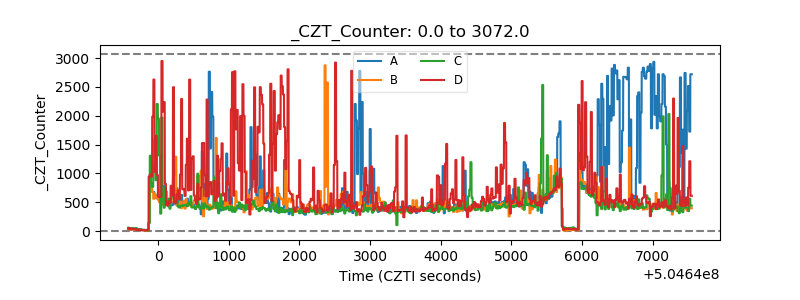 |
| +2.5 Volts monitor |  |
| +5 Volts monitor | 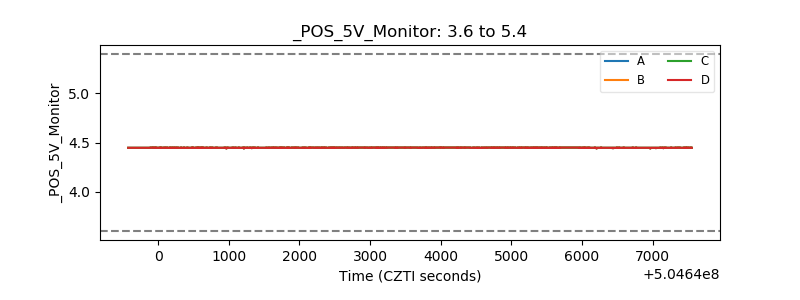 |
| _ROLL_ROT | 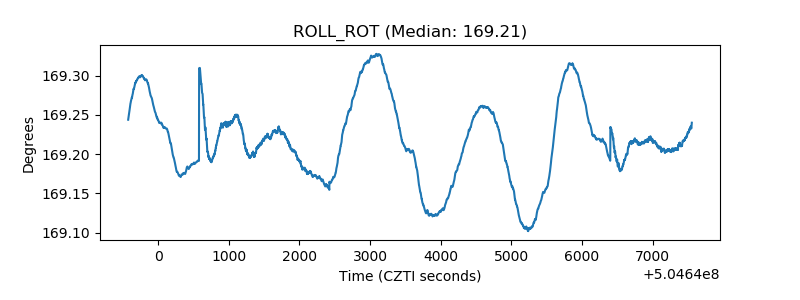 |
| _Roll_DEC | 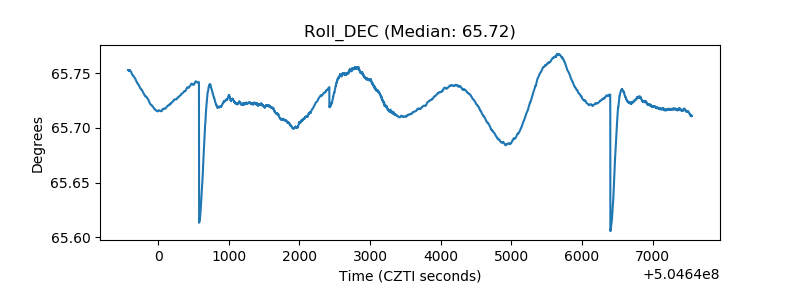 |
| _Roll_RA | 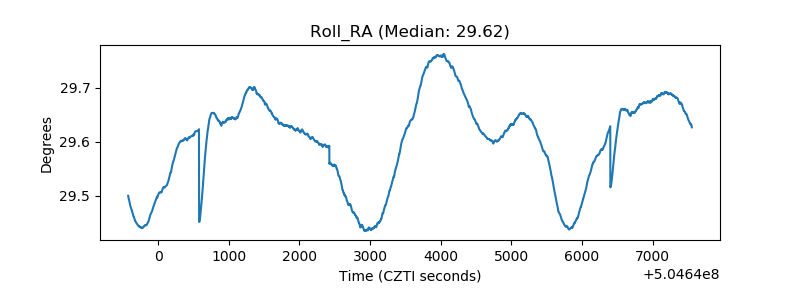 |
| Veto Counter | 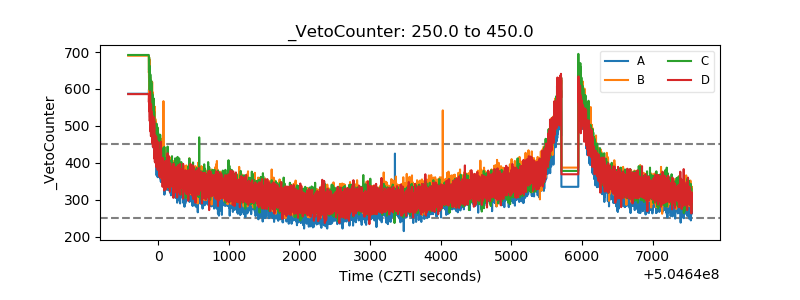 |