| Param | Original file | Final file |
|---|---|---|
| Filename | modeM0/AS1A14_099T01_9000006536_55465cztM0_level2.fits | modeM0/AS1A14_099T01_9000006536_55465cztM0_level2_quad_clean.evt |
| Size (bytes) | 596,064,960 | 111,525,120 |
| Size | 568.5 MB | 106.4 MB |
| Events in quadrant A | 6,245,104 | 687,024 |
| Events in quadrant B | 5,927,851 | 736,278 |
| Events in quadrant C | 3,838,058 | 725,241 |
| Events in quadrant D | 5,426,568 | 666,897 |
| Mode M9 | |||
|---|---|---|---|
| Quadrant | BADHDUFLAG | Total packets | Discarded packets |
| A | 0 | 2 | 0 |
| B | 0 | 2 | 0 |
| C | 0 | 2 | 0 |
| D | 0 | 2 | 0 |
| Mode SS | |||
|---|---|---|---|
| Quadrant | BADHDUFLAG | Total packets | Discarded packets |
| A | 0 | 166 | 2 |
| B | 0 | 166 | 2 |
| C | 0 | 166 | 2 |
| D | 0 | 166 | 2 |
| Mode M0 | |||
|---|---|---|---|
| Quadrant | BADHDUFLAG | Total packets | Discarded packets |
| A | 0 | 24483 | 123 |
| B | 0 | 23666 | 125 |
| C | 0 | 17753 | 126 |
| D | 0 | 22103 | 128 |
| Quadrant | Total seconds | Saturated seconds | Saturation percentage |
|---|---|---|---|
| A | 8070 | 883 | 10.941760% |
| B | 8071 | 883 | 10.940404% |
| C | 8071 | 86 | 1.065543% |
| D | 8070 | 372 | 4.609665% |
Noise dominated data is calculated using 1-second bins in cleaned event files. If a bin has >2000 counts, and if more than 50% of those come from <1% of pixels, then it is considered to be noise-dominated and hence unusable.
| Quadrant | # 1 sec bins | Bins with >0 counts | Bins with >2000 counts | High rate bins dominated by noise | Noise dominated (total time) | Noise dominated (detector-on time) | Marked lightcurve |
|---|---|---|---|---|---|---|---|
| A | 8328 | 8079 | 776 | 776 | 9.32% | 9.61% | 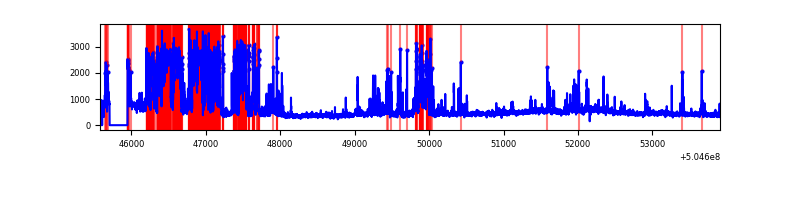 |
| B | 8322 | 8081 | 644 | 644 | 7.74% | 7.97% | 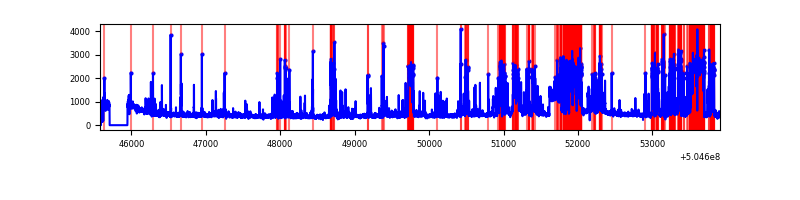 |
| C | 8322 | 8079 | 50 | 50 | 0.60% | 0.62% | 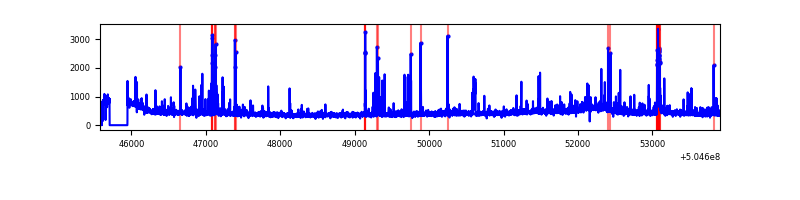 |
| D | 8329 | 8082 | 271 | 271 | 3.25% | 3.35% | 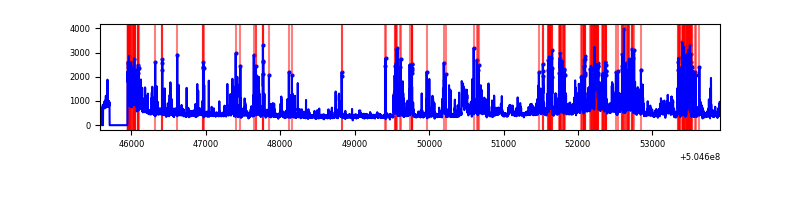 |
Top three noisy pixels from each quadrant. If the there are fewer than three noisy pixels in the level2.evt file, extra rows are filled as -1
| Pixel properties | Quadrant properties | ||||||
|---|---|---|---|---|---|---|---|
| Quadrant | DetID | PixID | Counts | Sigma | Mean | Median | Sigma |
| A | 3 | 78 | 2437078 | 11841.5 | 826 | 806 | 205.7 |
| A | 7 | 14 | 310169 | 1503.66 | 826 | 806 | 205.7 |
| A | 0 | 8 | 126643 | 611.63 | 826 | 806 | 205.7 |
| B | 5 | 172 | 2219960 | 12768.13 | 822 | 793 | 173.8 |
| B | 5 | 185 | 121276 | 693.21 | 822 | 793 | 173.8 |
| B | 7 | 252 | 114570 | 654.62 | 822 | 793 | 173.8 |
| C | 13 | 3 | 230544 | 984.22 | 854 | 844 | 233.4 |
| C | 15 | 147 | 92981 | 394.79 | 854 | 844 | 233.4 |
| C | 1 | 16 | 78390 | 332.27 | 854 | 844 | 233.4 |
| D | 8 | 160 | 339401 | 1428.64 | 838 | 802 | 237.0 |
| D | 6 | 239 | 337971 | 1422.61 | 838 | 802 | 237.0 |
| D | 15 | 107 | 336542 | 1416.58 | 838 | 802 | 237.0 |
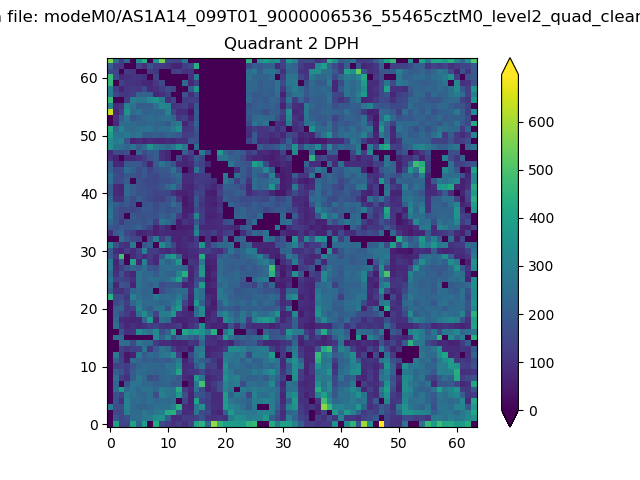
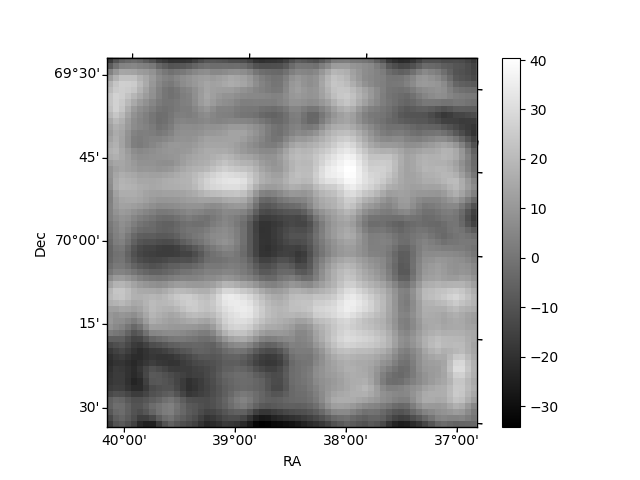
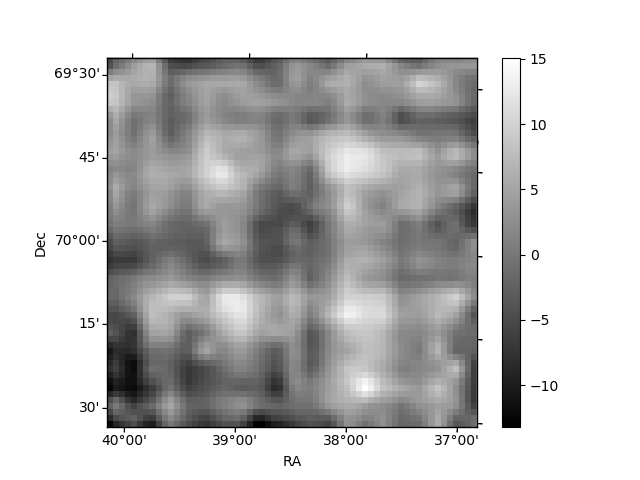
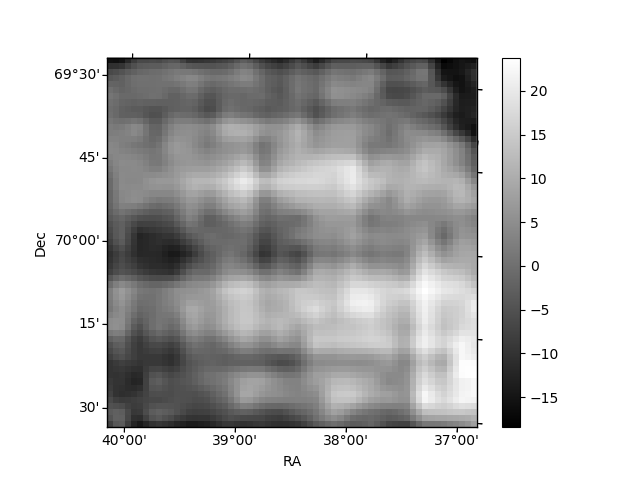
Histogram calculated using DETX and DETY for each event in the final _common_clean file
| Quadrant A | 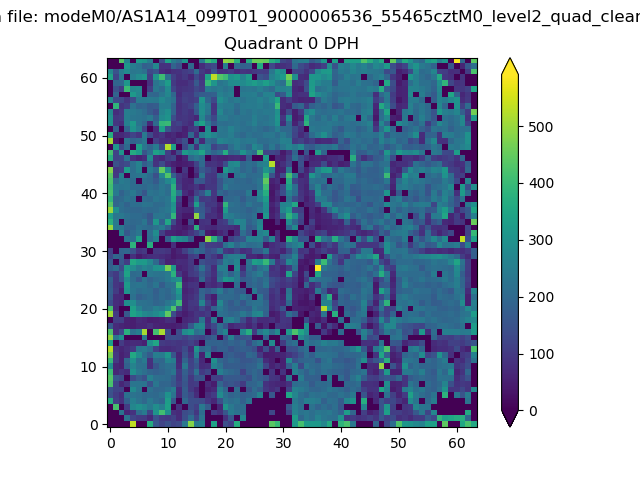 |
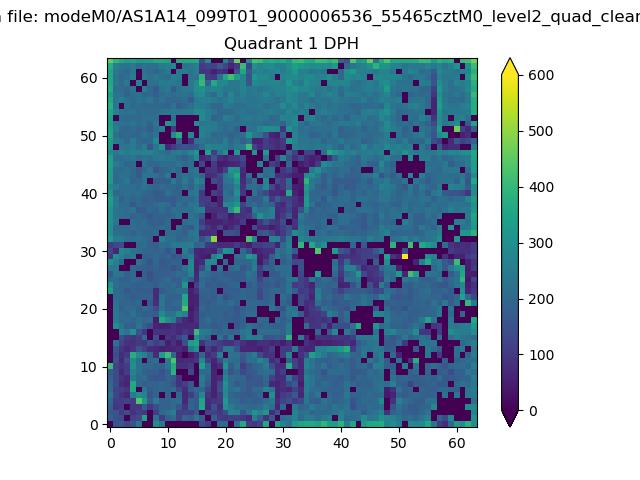 |
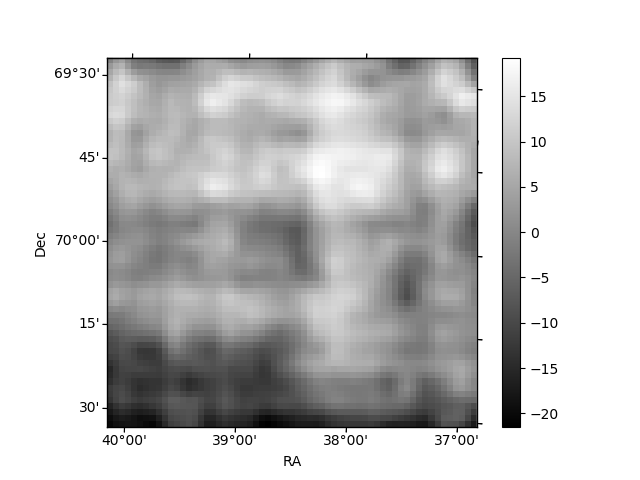
Quadrant B |
|---|---|---|---|
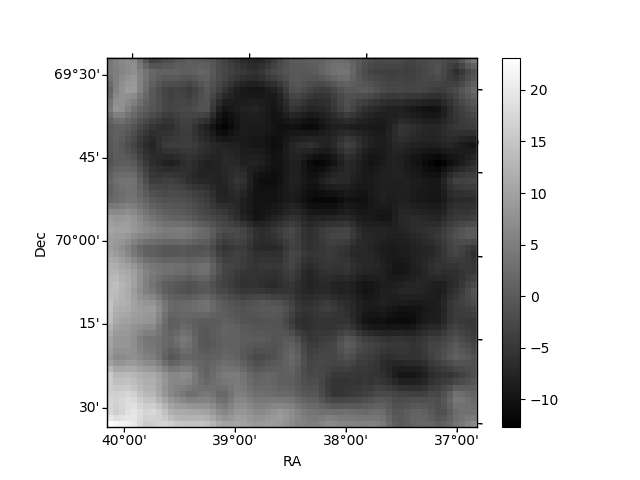
| Quadrant D | 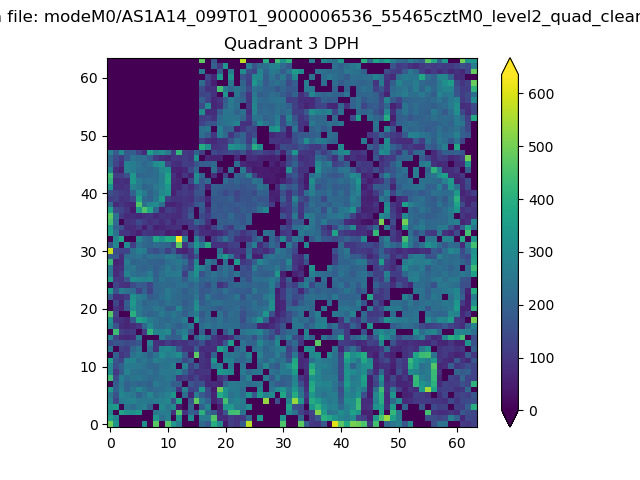 |
 |
Quadrant C |
| Plot type | Count rate plots | Images |
|---|---|---|
| Comparison with Poisson distribution Blue bars denote a histogram of data divided into 1 sec bins. Red curve is a Poisson curve with rate = median count rate of data. |
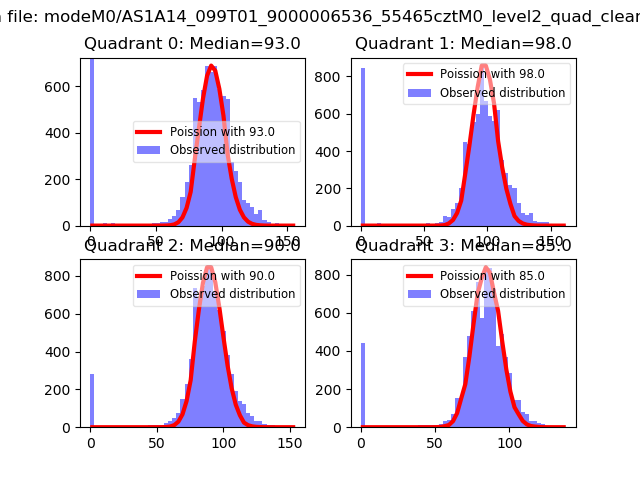 |
 |
| Quadrant-wise count rates Data is divided into 100 sec bins |
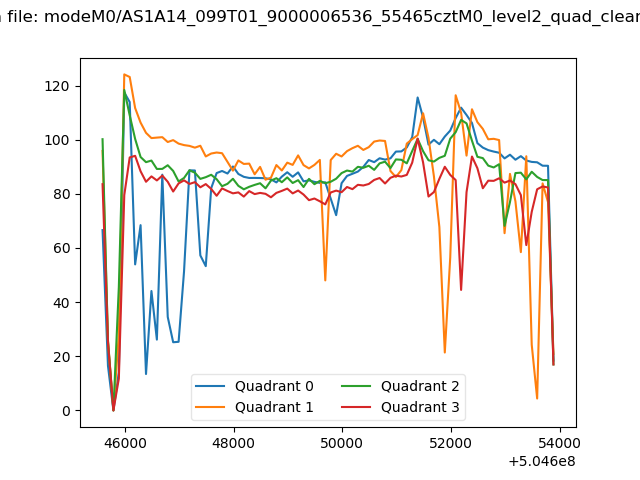 |
|
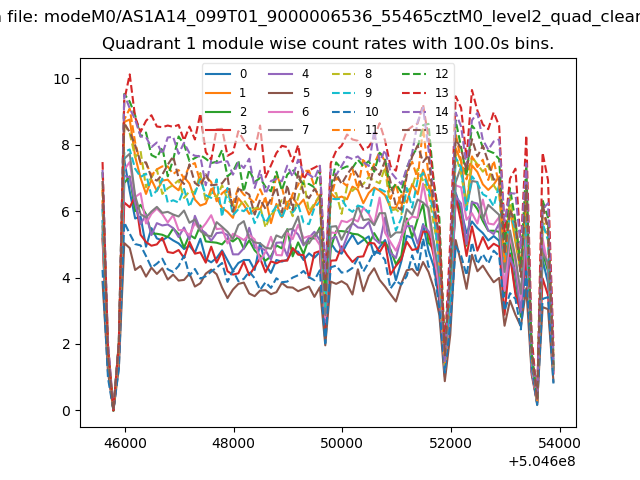
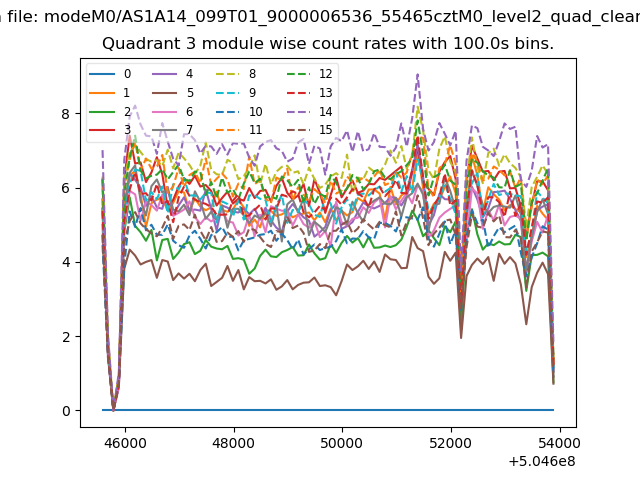
| Module-wise count rates for Quadrant A Data is divided into 100 sec bins |
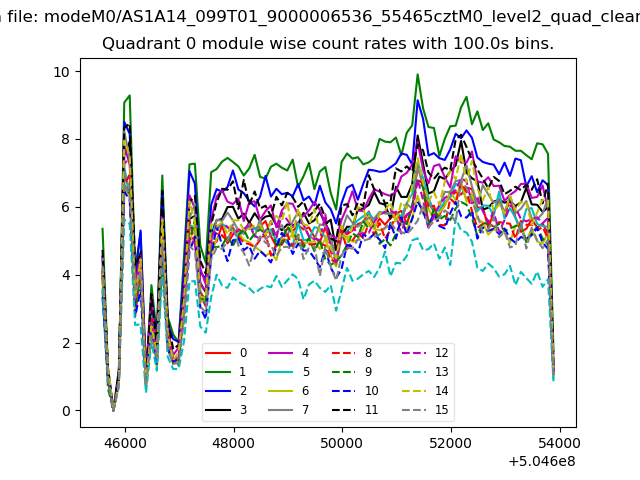 |
 |
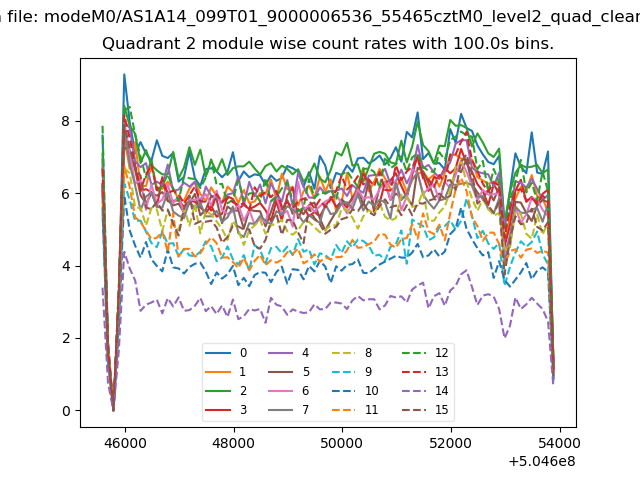
| Module-wise count rates for Quadrant B Data is divided into 100 sec bins |
 |
 |
| Module-wise count rates for Quadrant C Data is divided into 100 sec bins |
 |
 |
| Module-wise count rates for Quadrant D Data is divided into 100 sec bins |
 |
 |
| Parameter | Plot |
|---|---|
| CZT HV Monitor | 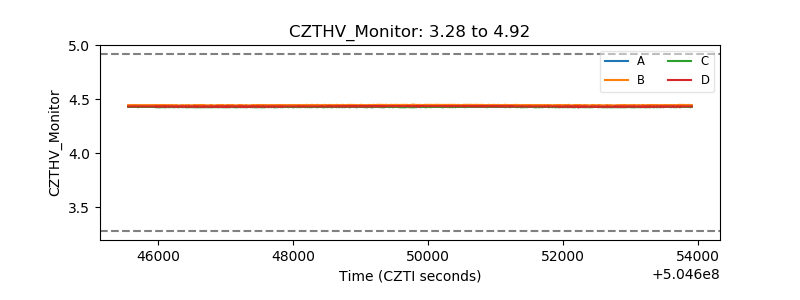 |
| D_VDD | 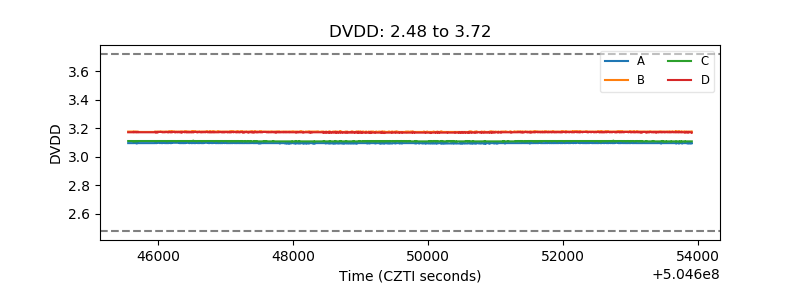 |
| Temperature 1 | 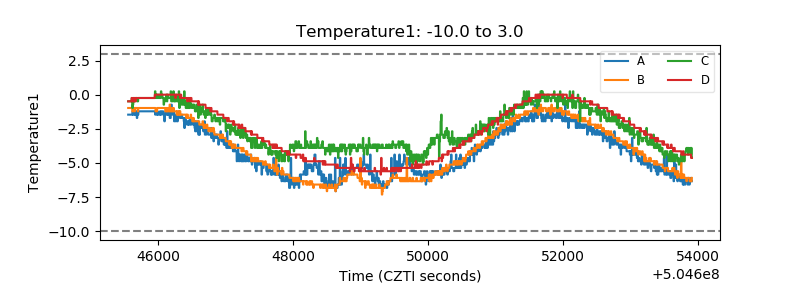 |
| Veto HV Monitor | 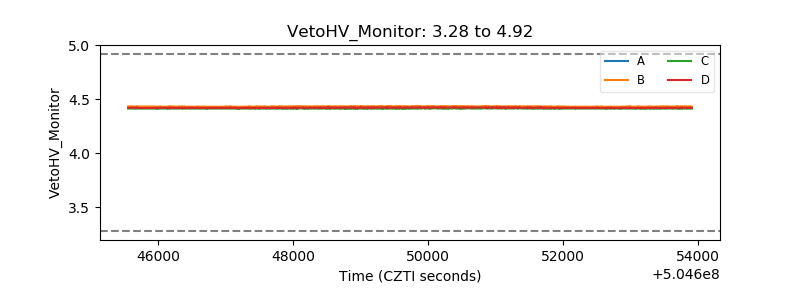 |
| Veto LLD | 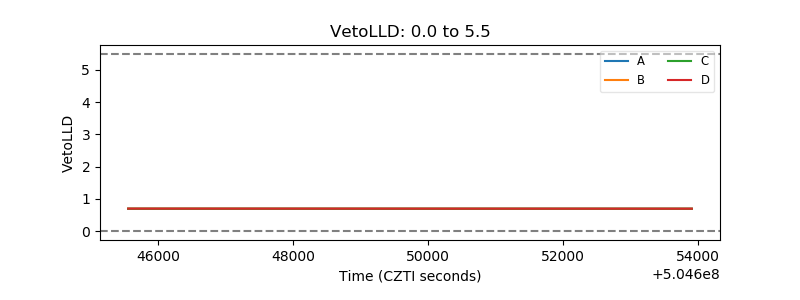 |
| Alpha Counter | 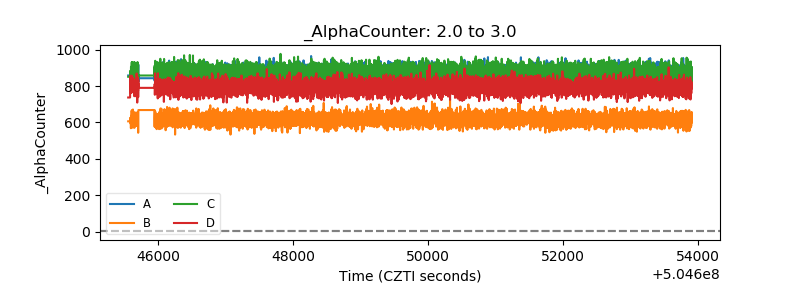 |
| _CPM_Rate | 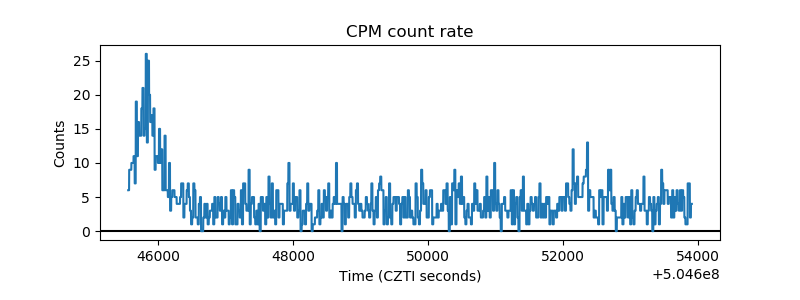 |
| CZT Counter | 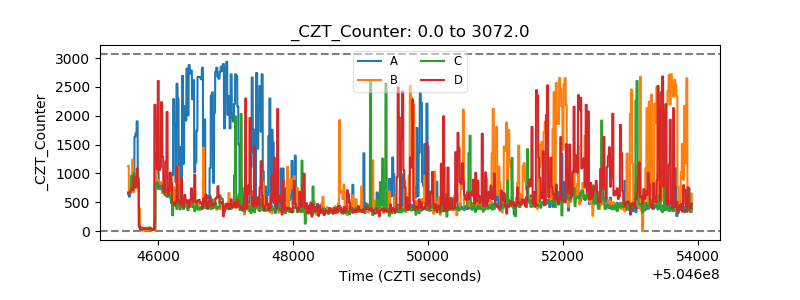 |
| +2.5 Volts monitor |  |
| +5 Volts monitor |  |
| _ROLL_ROT | 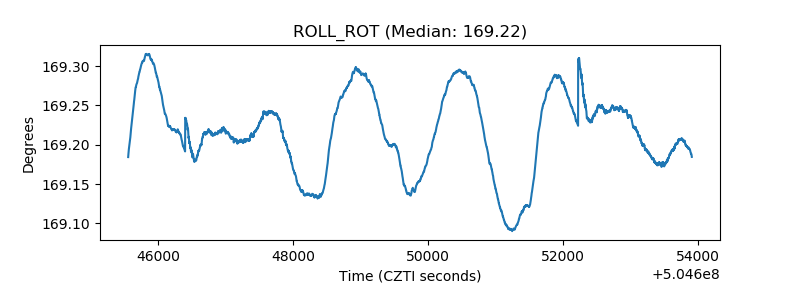 |
| _Roll_DEC | 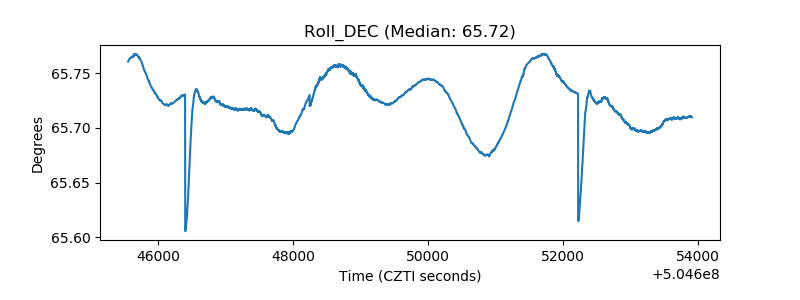 |
| _Roll_RA | 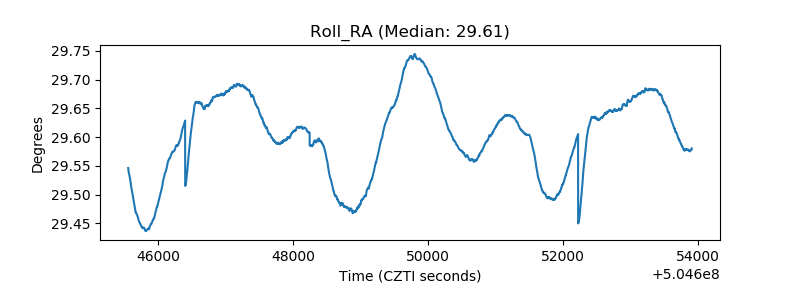 |
| Veto Counter | 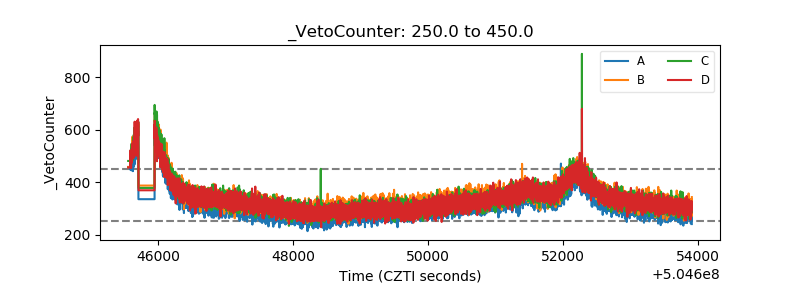 |