| Param | Original file | Final file |
|---|---|---|
| Filename | modeM0/AS1A14_099T01_9000006536_55466cztM0_level2.fits | modeM0/AS1A14_099T01_9000006536_55466cztM0_level2_quad_clean.evt |
| Size (bytes) | 543,827,520 | 108,264,960 |
| Size | 518.6 MB | 103.2 MB |
| Events in quadrant A | 4,329,159 | 721,120 |
| Events in quadrant B | 6,162,955 | 688,511 |
| Events in quadrant C | 3,770,658 | 685,732 |
| Events in quadrant D | 5,262,253 | 640,593 |
| Mode SS | |||
|---|---|---|---|
| Quadrant | BADHDUFLAG | Total packets | Discarded packets |
| A | 0 | 156 | 0 |
| B | 0 | 156 | 0 |
| C | 0 | 156 | 0 |
| D | 0 | 156 | 0 |
| Mode M0 | |||
|---|---|---|---|
| Quadrant | BADHDUFLAG | Total packets | Discarded packets |
| A | 0 | 18529 | 0 |
| B | 0 | 23790 | 3 |
| C | 0 | 17123 | 0 |
| D | 0 | 21144 | 0 |
| Quadrant | Total seconds | Saturated seconds | Saturation percentage |
|---|---|---|---|
| A | 7795 | 181 | 2.322001% |
| B | 7794 | 1050 | 13.471901% |
| C | 7795 | 126 | 1.616421% |
| D | 7795 | 333 | 4.271969% |
Noise dominated data is calculated using 1-second bins in cleaned event files. If a bin has >2000 counts, and if more than 50% of those come from <1% of pixels, then it is considered to be noise-dominated and hence unusable.
| Quadrant | # 1 sec bins | Bins with >0 counts | Bins with >2000 counts | High rate bins dominated by noise | Noise dominated (total time) | Noise dominated (detector-on time) | Marked lightcurve |
|---|---|---|---|---|---|---|---|
| A | 7795 | 7795 | 178 | 178 | 2.28% | 2.28% | 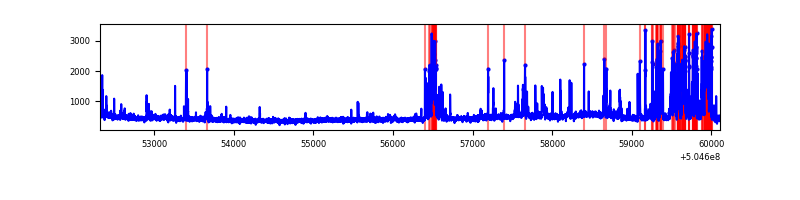 |
| B | 7795 | 7795 | 829 | 829 | 10.64% | 10.64% | 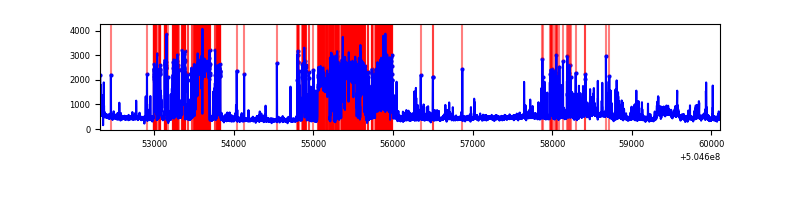 |
| C | 7795 | 7795 | 106 | 106 | 1.36% | 1.36% | 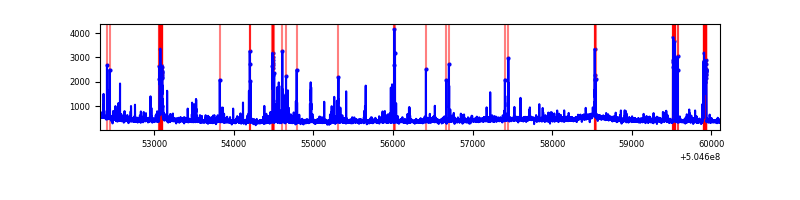 |
| D | 7795 | 7795 | 316 | 316 | 4.05% | 4.05% | 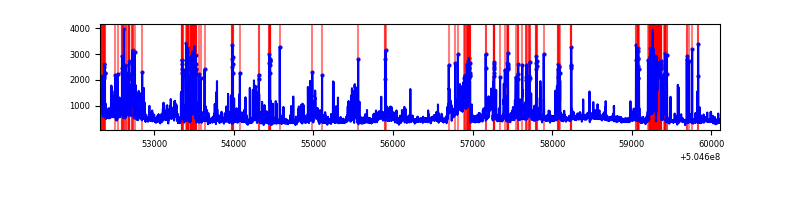 |
Top three noisy pixels from each quadrant. If the there are fewer than three noisy pixels in the level2.evt file, extra rows are filled as -1
| Pixel properties | Quadrant properties | ||||||
|---|---|---|---|---|---|---|---|
| Quadrant | DetID | PixID | Counts | Sigma | Mean | Median | Sigma |
| A | 3 | 78 | 827735 | 4074.07 | 810 | 789 | 203.0 |
| A | 0 | 8 | 150544 | 737.79 | 810 | 789 | 203.0 |
| A | 3 | 14 | 85515 | 417.42 | 810 | 789 | 203.0 |
| B | 5 | 172 | 2810262 | 17681.95 | 749 | 723 | 158.9 |
| B | 7 | 252 | 127401 | 797.25 | 749 | 723 | 158.9 |
| B | 10 | 247 | 67419 | 419.75 | 749 | 723 | 158.9 |
| C | 13 | 3 | 330270 | 1506.36 | 794 | 787 | 218.7 |
| C | 15 | 147 | 99082 | 449.39 | 794 | 787 | 218.7 |
| C | 1 | 16 | 85216 | 386.0 | 794 | 787 | 218.7 |
| D | 15 | 107 | 585955 | 2678.36 | 784 | 751 | 218.5 |
| D | 8 | 160 | 574212 | 2624.62 | 784 | 751 | 218.5 |
| D | 2 | 249 | 294991 | 1346.68 | 784 | 751 | 218.5 |
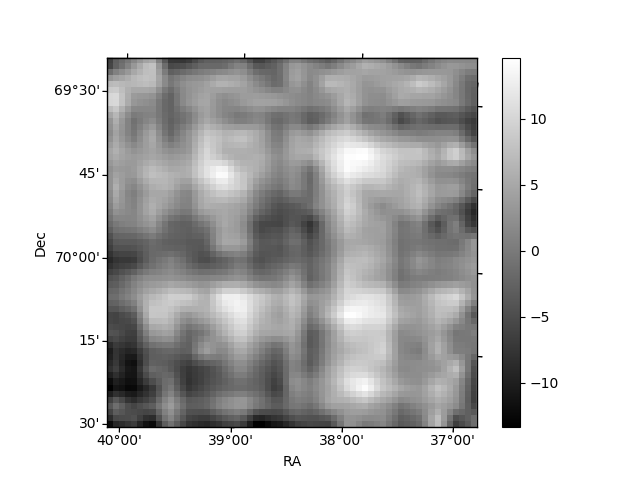
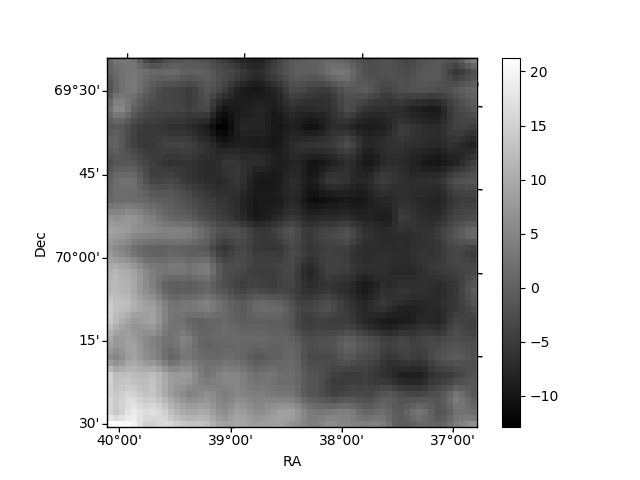
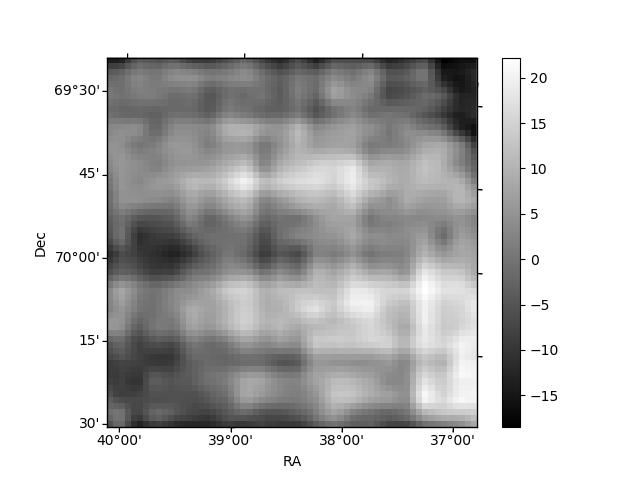
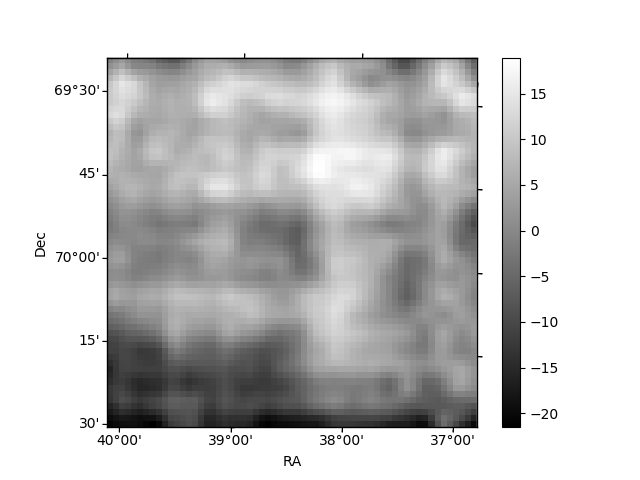
Histogram calculated using DETX and DETY for each event in the final _common_clean file
| Quadrant A | 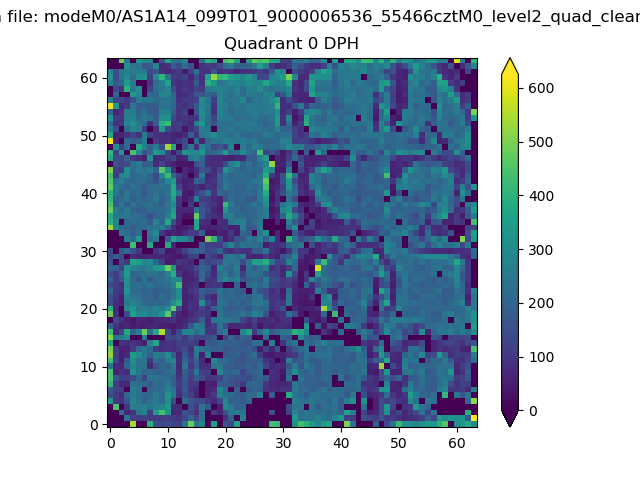 |
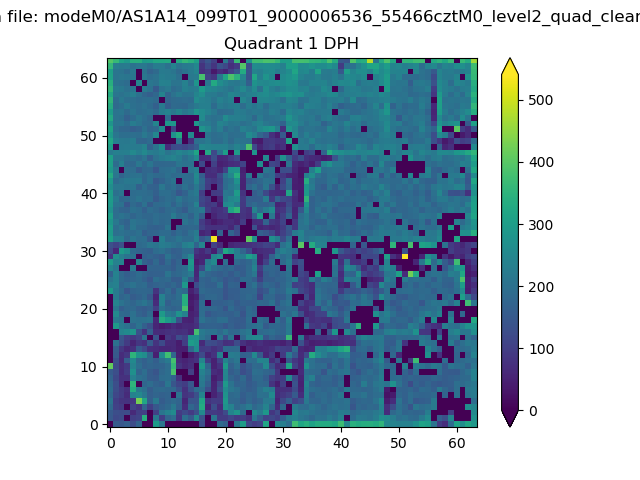 |
Quadrant B |
|---|---|---|---|
| Quadrant D | 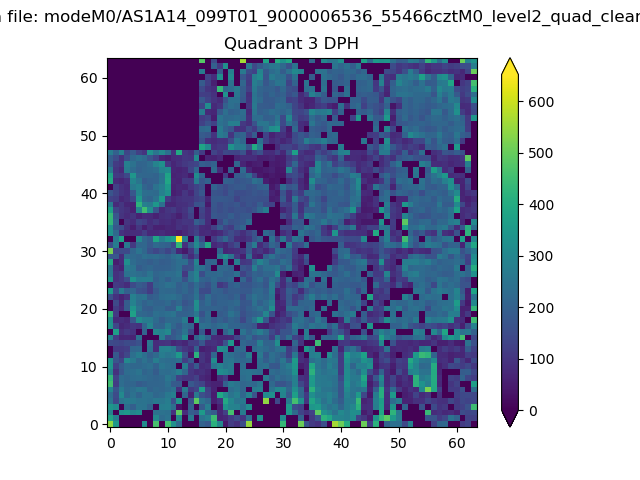 |
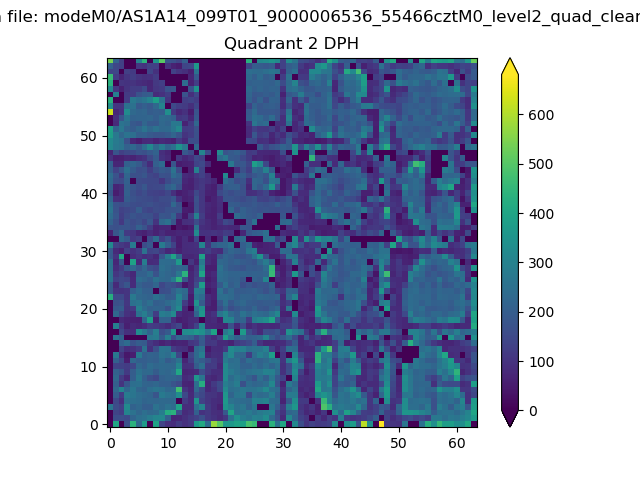 |
Quadrant C |
| Plot type | Count rate plots | Images |
|---|---|---|
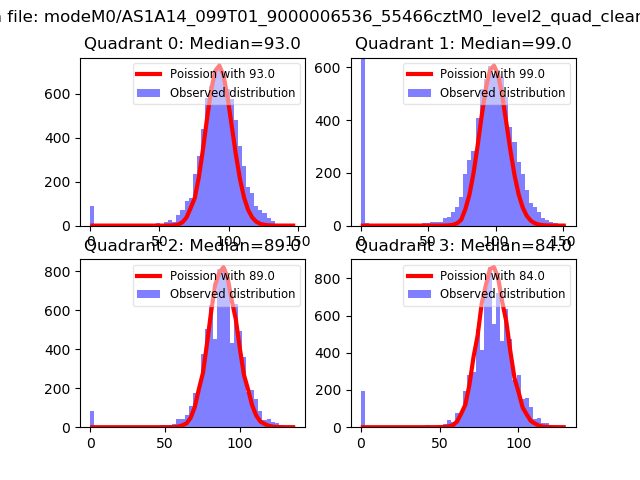
| Comparison with Poisson distribution Blue bars denote a histogram of data divided into 1 sec bins. Red curve is a Poisson curve with rate = median count rate of data. |
 |
 |
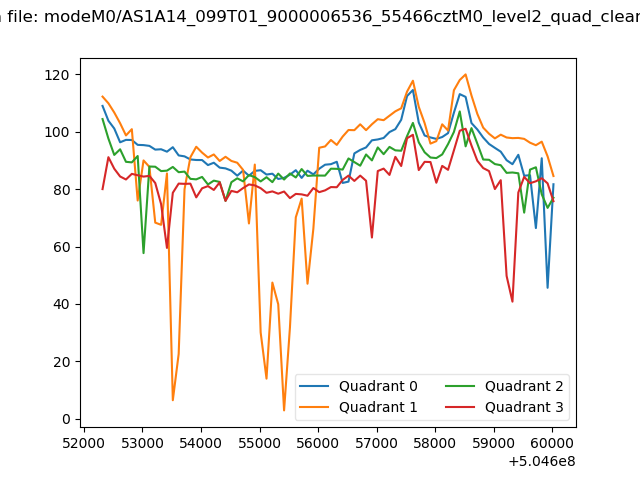
| Quadrant-wise count rates Data is divided into 100 sec bins |
 |
|
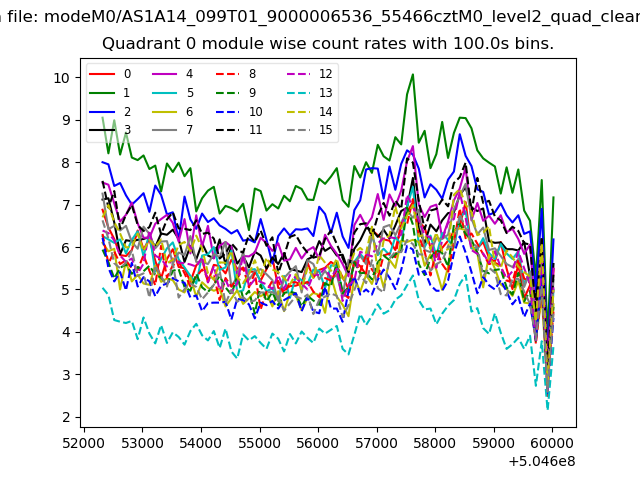
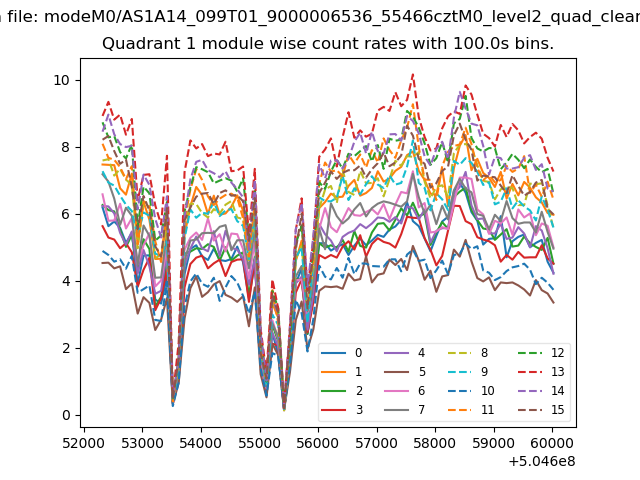
| Module-wise count rates for Quadrant A Data is divided into 100 sec bins |
 |
 |
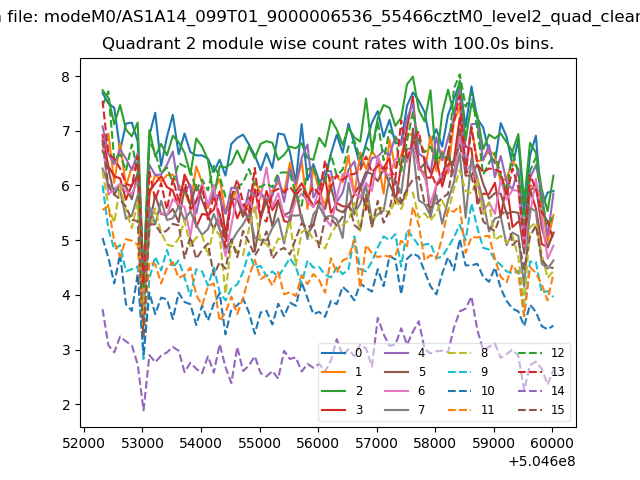
| Module-wise count rates for Quadrant B Data is divided into 100 sec bins |
 |
 |
| Module-wise count rates for Quadrant C Data is divided into 100 sec bins |
 |
 |
| Module-wise count rates for Quadrant D Data is divided into 100 sec bins |
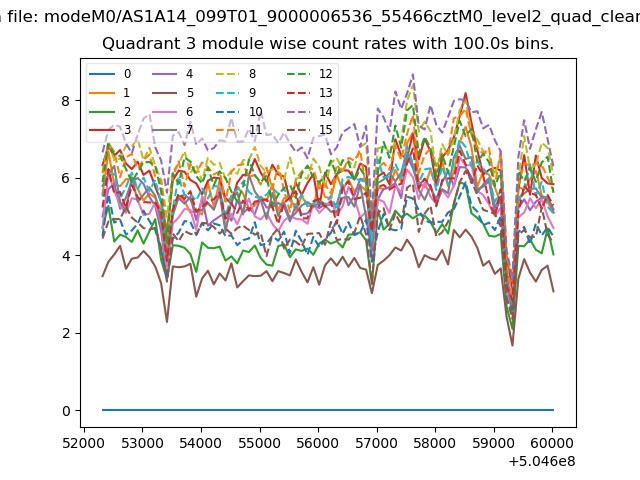 |
 |
| Parameter | Plot |
|---|---|
| CZT HV Monitor | 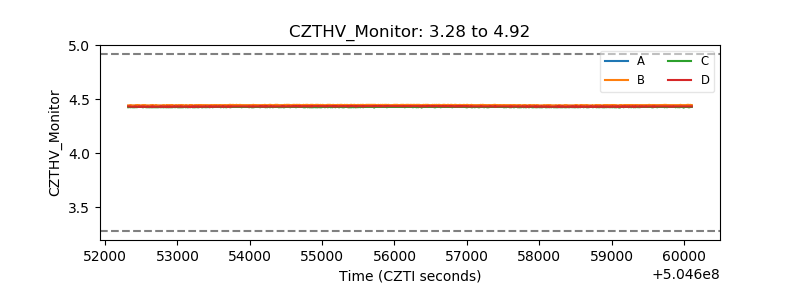 |
| D_VDD | 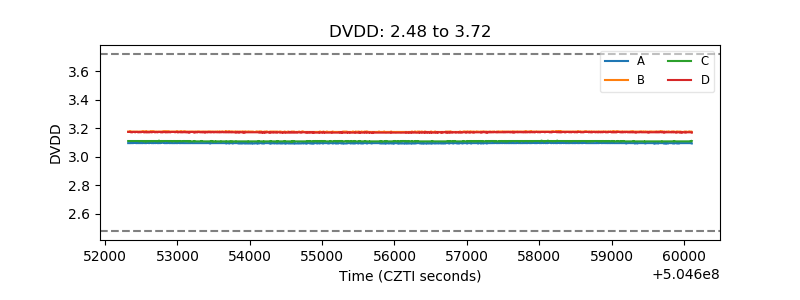 |
| Temperature 1 | 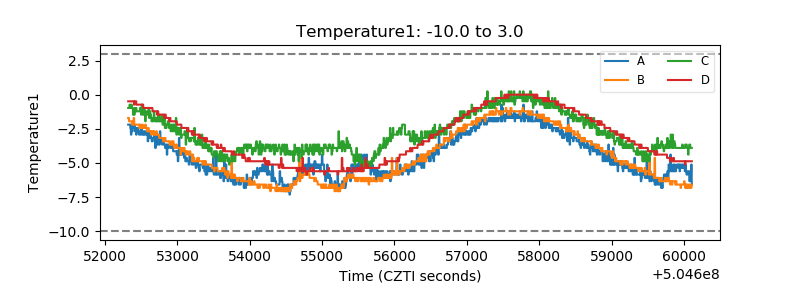 |
| Veto HV Monitor | 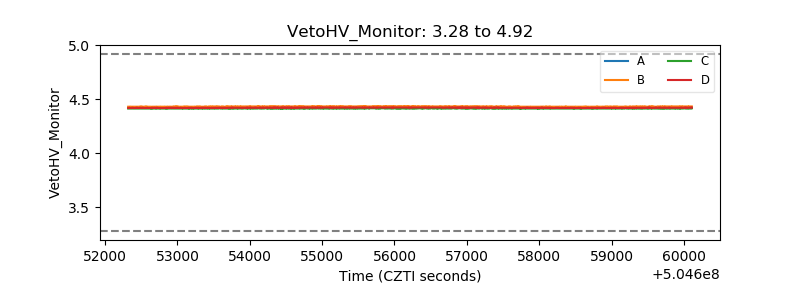 |
| Veto LLD | 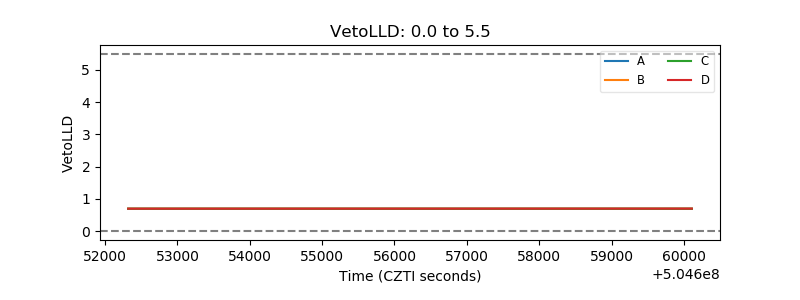 |
| Alpha Counter | 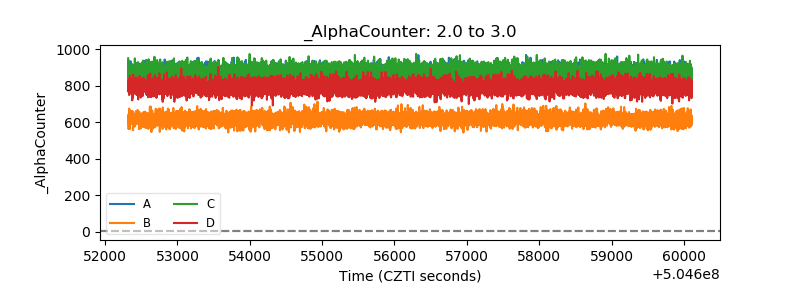 |
| _CPM_Rate | 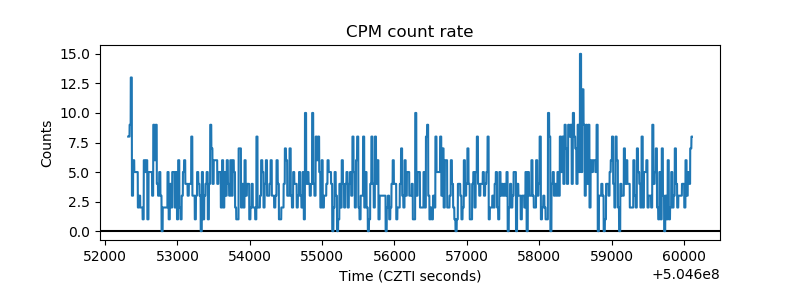 |
| CZT Counter | 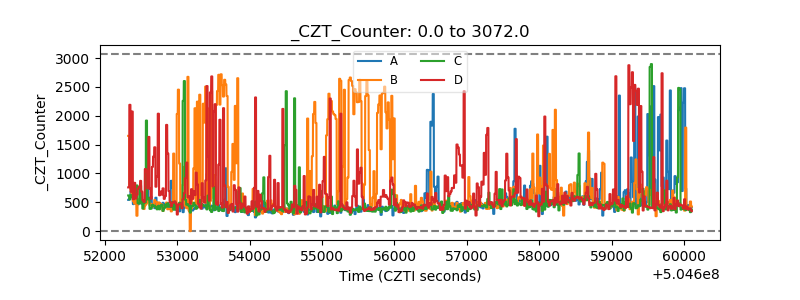 |
| +2.5 Volts monitor | 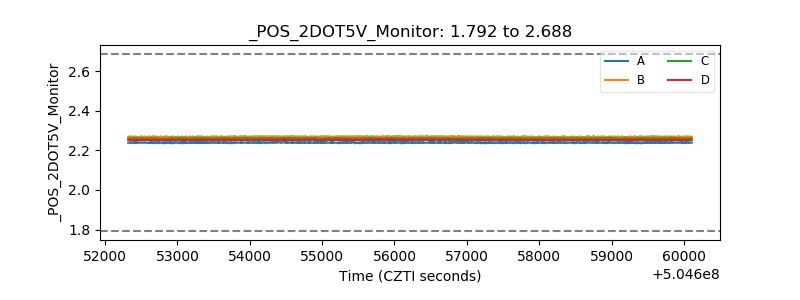 |
| +5 Volts monitor | 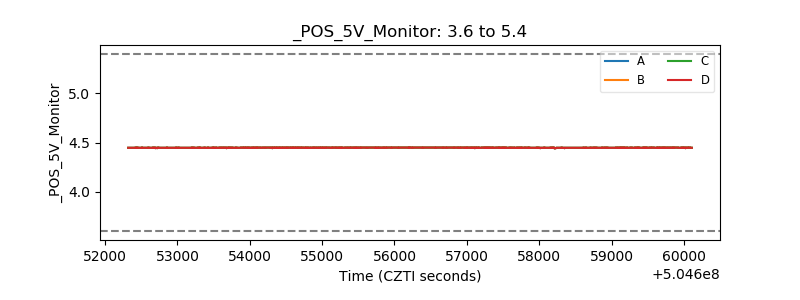 |
| _ROLL_ROT | 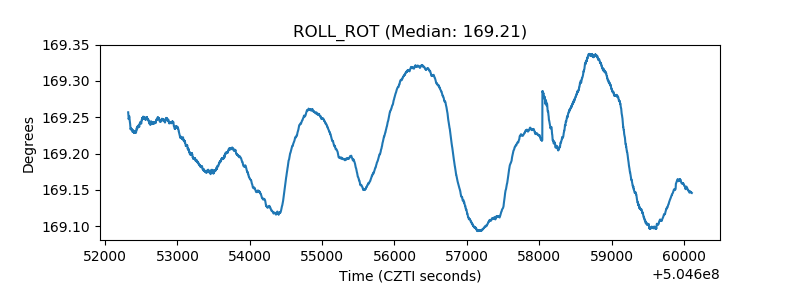 |
| _Roll_DEC | 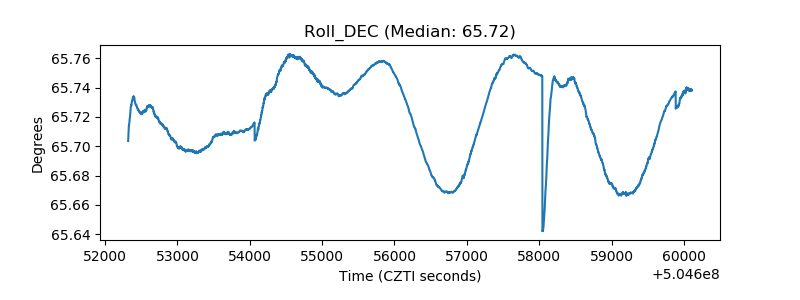 |
| _Roll_RA | 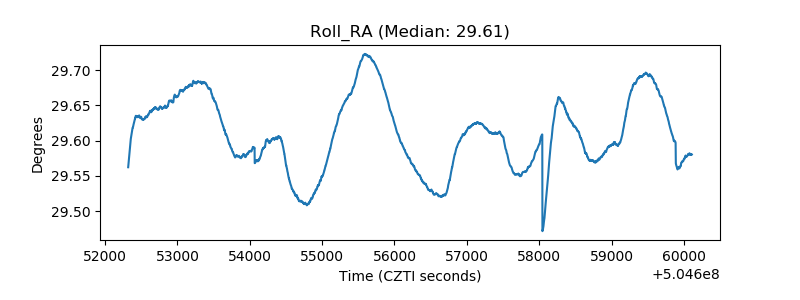 |
| Veto Counter | 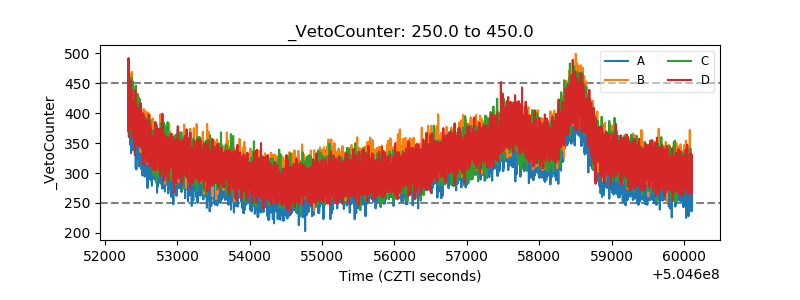 |