| Param | Original file | Final file |
|---|---|---|
| Filename | modeM0/AS1A14_099T01_9000006536_55469cztM0_level2.fits | modeM0/AS1A14_099T01_9000006536_55469cztM0_level2_quad_clean.evt |
| Size (bytes) | 1,263,271,680 | 276,949,440 |
| Size | 1.2 GB | 264.1 MB |
| Events in quadrant A | 11,163,077 | 1,796,457 |
| Events in quadrant B | 10,472,216 | 1,936,660 |
| Events in quadrant C | 10,278,881 | 1,725,841 |
| Events in quadrant D | 13,309,146 | 1,557,290 |
| Mode M9 | |||
|---|---|---|---|
| Quadrant | BADHDUFLAG | Total packets | Discarded packets |
| A | 0 | 10 | 0 |
| B | 0 | 10 | 0 |
| C | 0 | 10 | 0 |
| D | 0 | 10 | 0 |
| Mode SS | |||
|---|---|---|---|
| Quadrant | BADHDUFLAG | Total packets | Discarded packets |
| A | 0 | 402 | 0 |
| B | 0 | 402 | 0 |
| C | 0 | 402 | 0 |
| D | 0 | 402 | 0 |
| Mode M0 | |||
|---|---|---|---|
| Quadrant | BADHDUFLAG | Total packets | Discarded packets |
| A | 0 | 47484 | 0 |
| B | 0 | 45566 | 0 |
| C | 0 | 45730 | 0 |
| D | 0 | 54197 | 0 |
| Quadrant | Total seconds | Saturated seconds | Saturation percentage |
|---|---|---|---|
| A | 19869 | 546 | 2.747999% |
| B | 19866 | 463 | 2.330615% |
| C | 19870 | 504 | 2.536487% |
| D | 19870 | 1196 | 6.019124% |
Noise dominated data is calculated using 1-second bins in cleaned event files. If a bin has >2000 counts, and if more than 50% of those come from <1% of pixels, then it is considered to be noise-dominated and hence unusable.
| Quadrant | # 1 sec bins | Bins with >0 counts | Bins with >2000 counts | High rate bins dominated by noise | Noise dominated (total time) | Noise dominated (detector-on time) | Marked lightcurve |
|---|---|---|---|---|---|---|---|
| A | 20909 | 19871 | 466 | 466 | 2.23% | 2.35% | 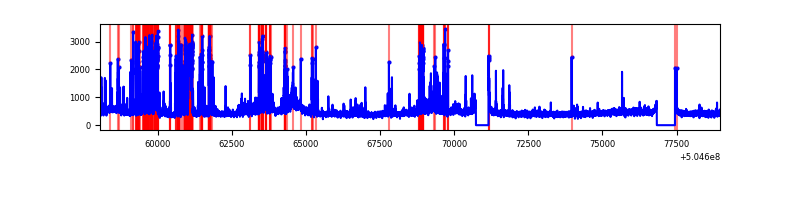 |
| B | 20909 | 19868 | 157 | 157 | 0.75% | 0.79% | 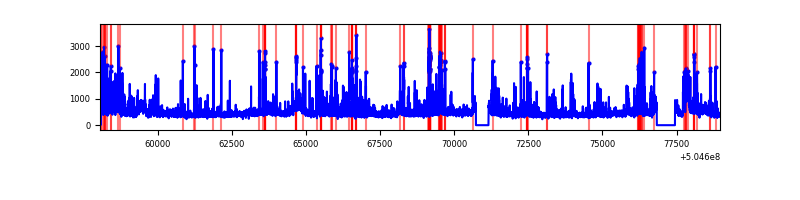 |
| C | 20910 | 19872 | 399 | 399 | 1.91% | 2.01% | 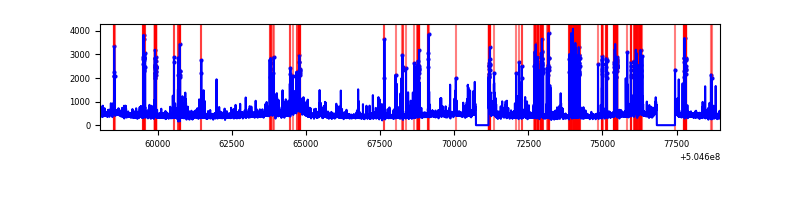 |
| D | 20910 | 19871 | 1067 | 1067 | 5.10% | 5.37% | 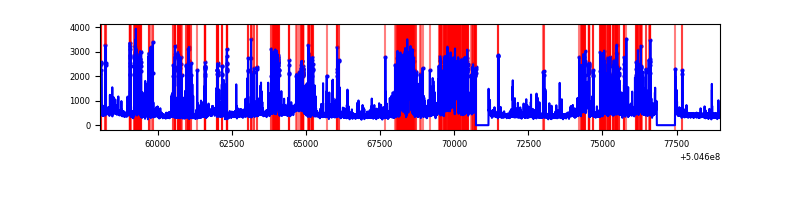 |
Top three noisy pixels from each quadrant. If the there are fewer than three noisy pixels in the level2.evt file, extra rows are filled as -1
| Pixel properties | Quadrant properties | ||||||
|---|---|---|---|---|---|---|---|
| Quadrant | DetID | PixID | Counts | Sigma | Mean | Median | Sigma |
| A | 3 | 78 | 1641925 | 3191.15 | 2078 | 2024 | 513.9 |
| A | 0 | 8 | 460187 | 891.56 | 2078 | 2024 | 513.9 |
| A | 3 | 14 | 298367 | 576.67 | 2078 | 2024 | 513.9 |
| B | 5 | 172 | 1135912 | 2580.4 | 2071 | 1989 | 439.4 |
| B | 0 | 171 | 362417 | 820.2 | 2071 | 1989 | 439.4 |
| B | 10 | 247 | 293855 | 664.18 | 2071 | 1989 | 439.4 |
| C | 13 | 3 | 765121 | 1377.16 | 2034 | 2012 | 554.1 |
| C | 12 | 252 | 550926 | 990.61 | 2034 | 2012 | 554.1 |
| C | 9 | 38 | 508768 | 914.53 | 2034 | 2012 | 554.1 |
| D | 15 | 58 | 1097719 | 1938.85 | 2002 | 1914 | 565.2 |
| D | 11 | 129 | 830328 | 1465.75 | 2002 | 1914 | 565.2 |
| D | 8 | 160 | 818421 | 1444.68 | 2002 | 1914 | 565.2 |
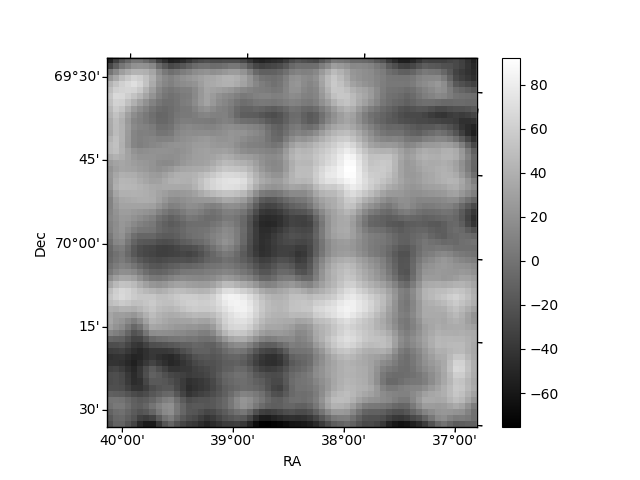
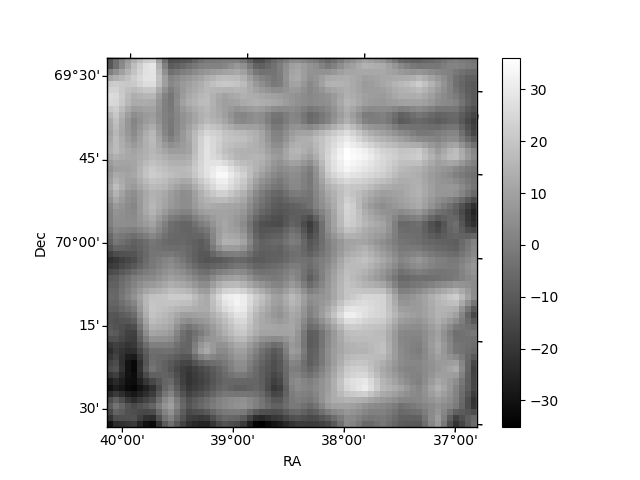
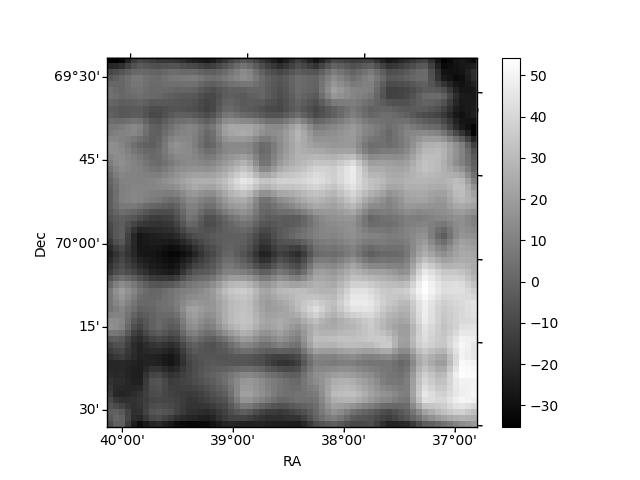
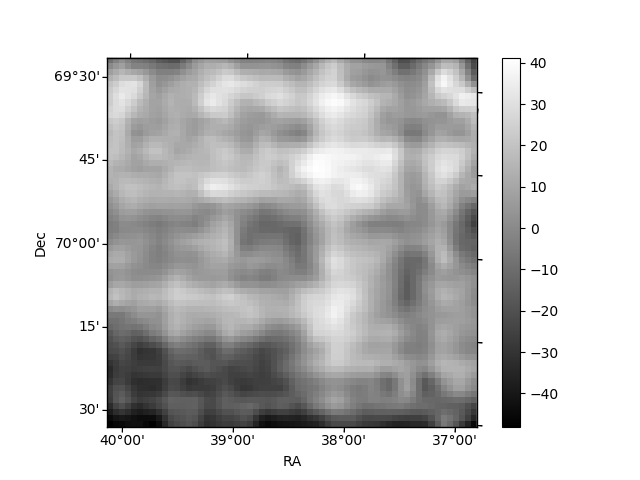
Histogram calculated using DETX and DETY for each event in the final _common_clean file
| Quadrant A | 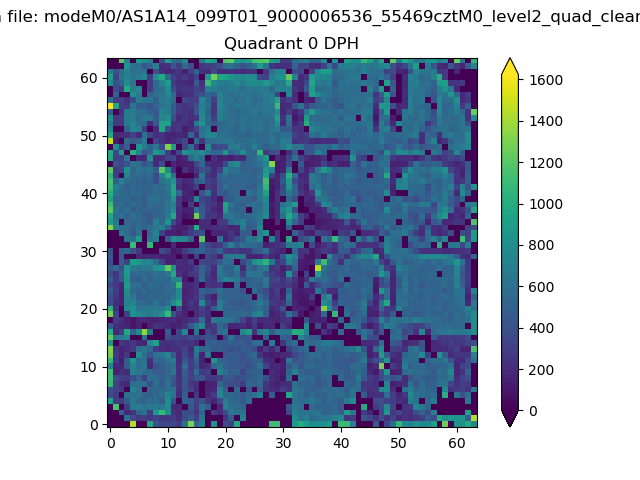 |
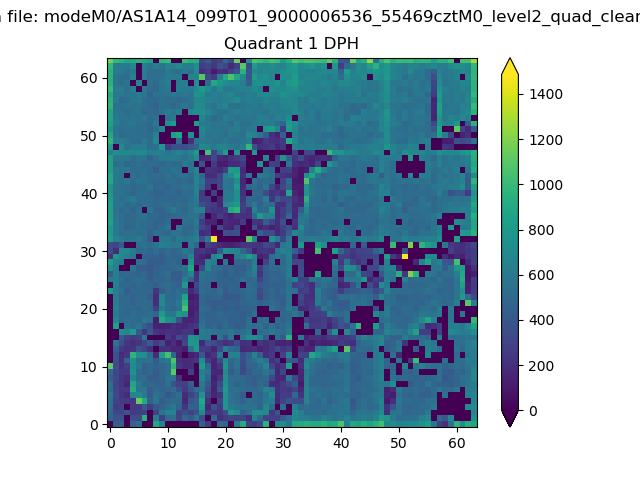 |
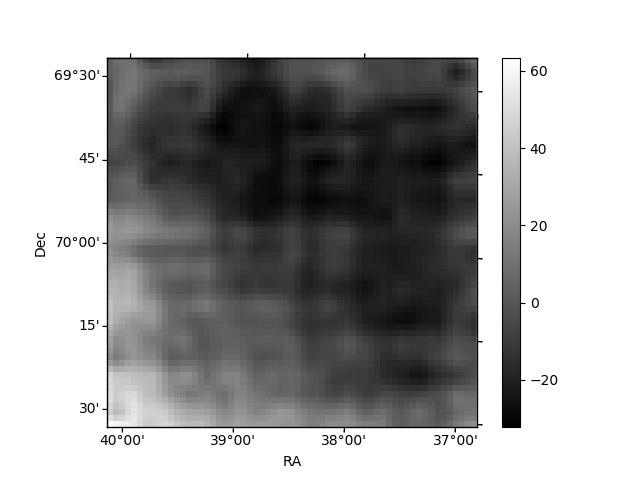
Quadrant B |
|---|---|---|---|
| Quadrant D | 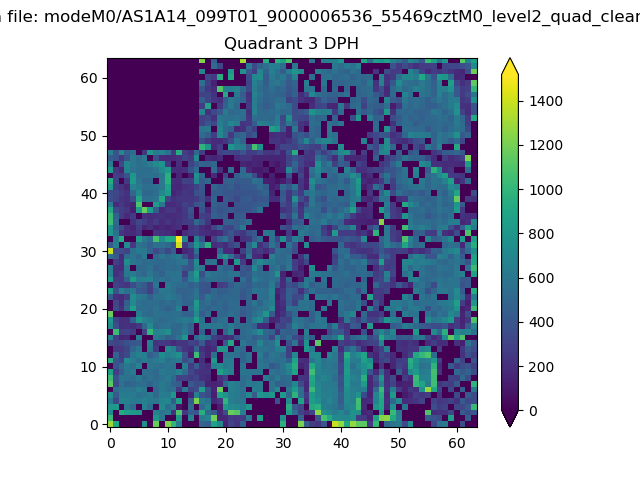 |
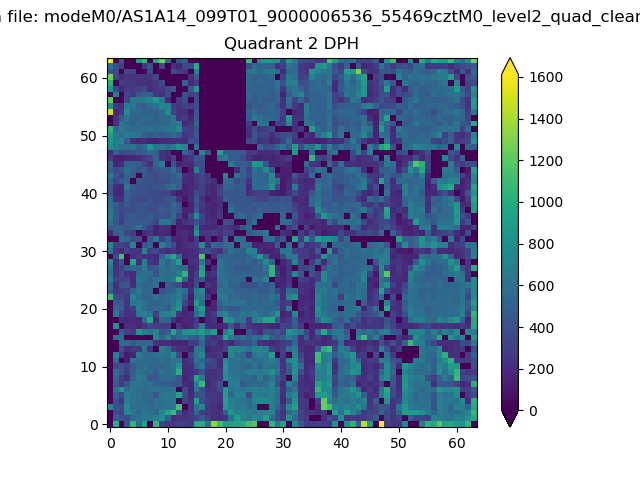 |
Quadrant C |
| Plot type | Count rate plots | Images |
|---|---|---|
| Comparison with Poisson distribution Blue bars denote a histogram of data divided into 1 sec bins. Red curve is a Poisson curve with rate = median count rate of data. |
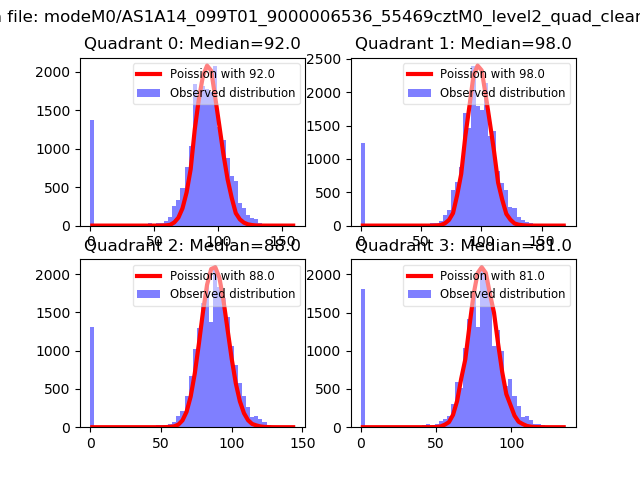 |
 |
| Quadrant-wise count rates Data is divided into 100 sec bins |
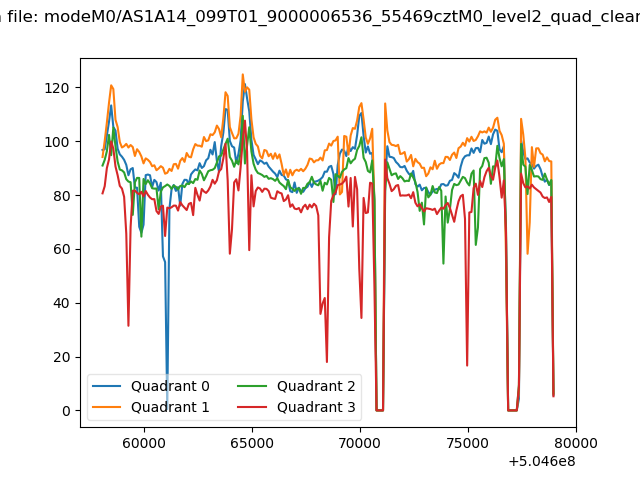 |
|
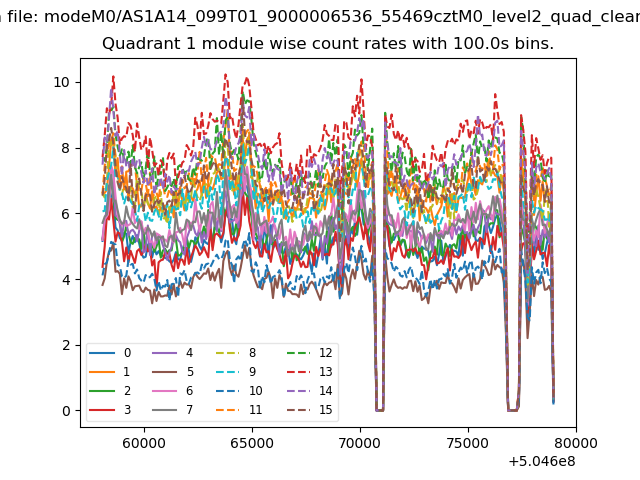
| Module-wise count rates for Quadrant A Data is divided into 100 sec bins |
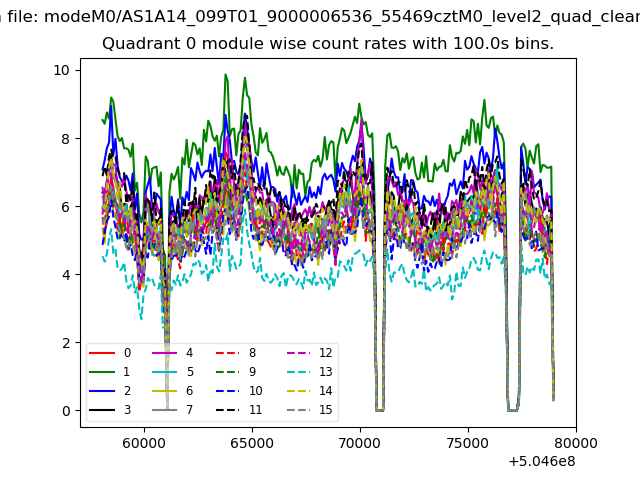 |
 |
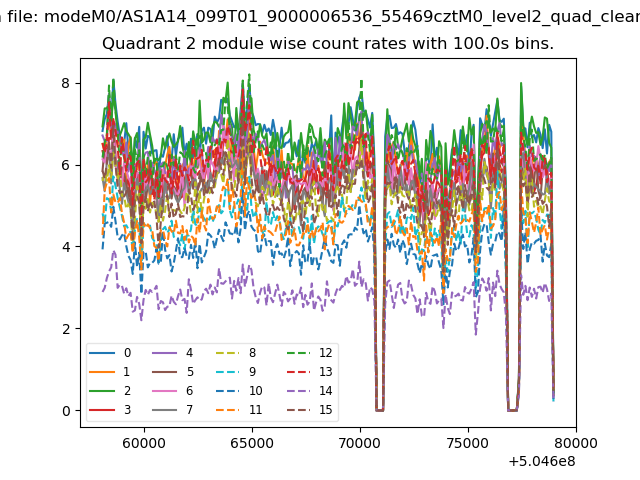
| Module-wise count rates for Quadrant B Data is divided into 100 sec bins |
 |
 |
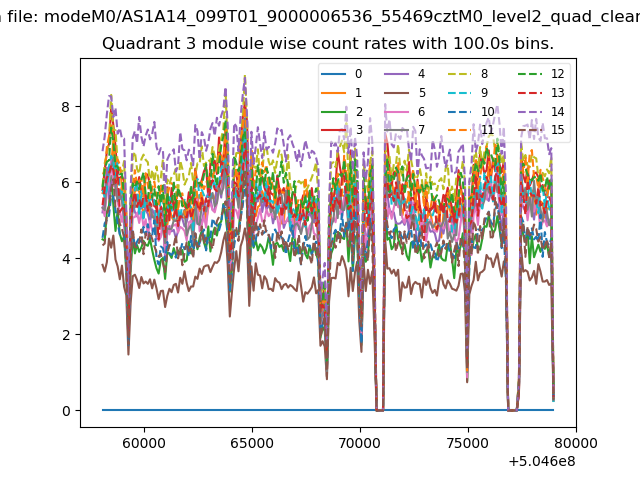
| Module-wise count rates for Quadrant C Data is divided into 100 sec bins |
 |
 |
| Module-wise count rates for Quadrant D Data is divided into 100 sec bins |
 |
 |
| Parameter | Plot |
|---|---|
| CZT HV Monitor | 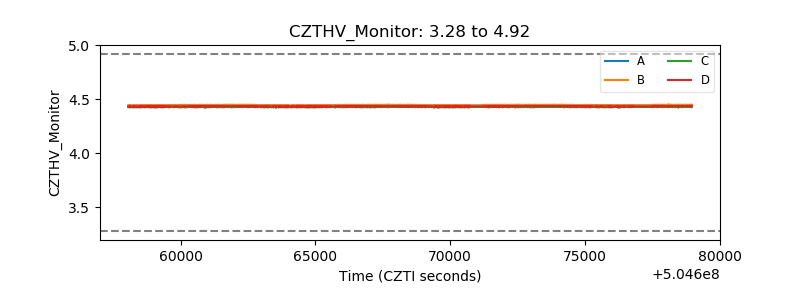 |
| D_VDD | 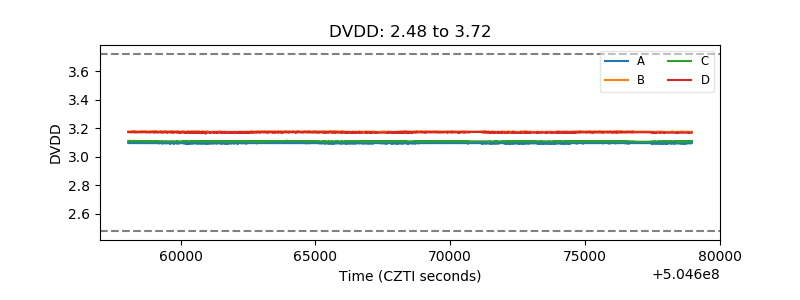 |
| Temperature 1 | 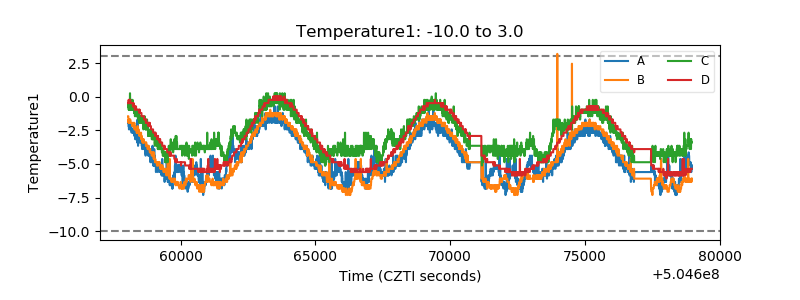 |
| Veto HV Monitor | 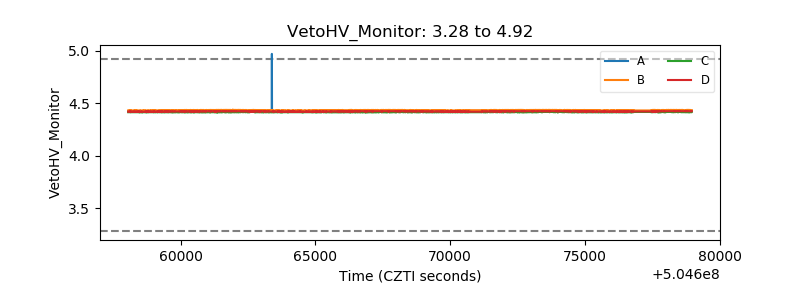 |
| Veto LLD | 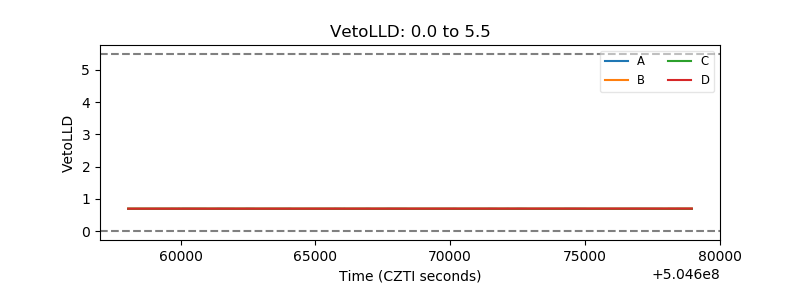 |
| Alpha Counter | 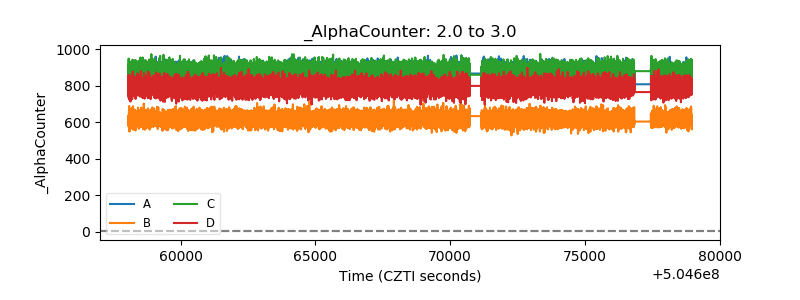 |
| _CPM_Rate | 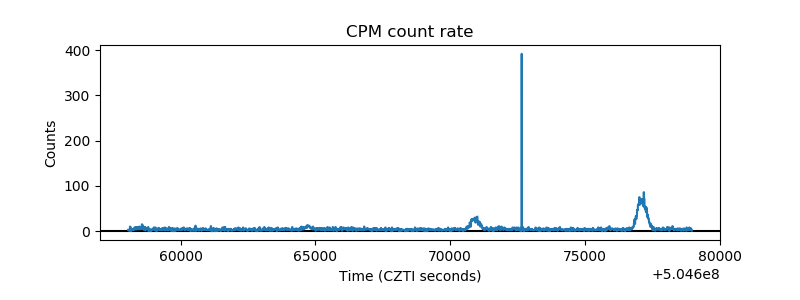 |
| CZT Counter | 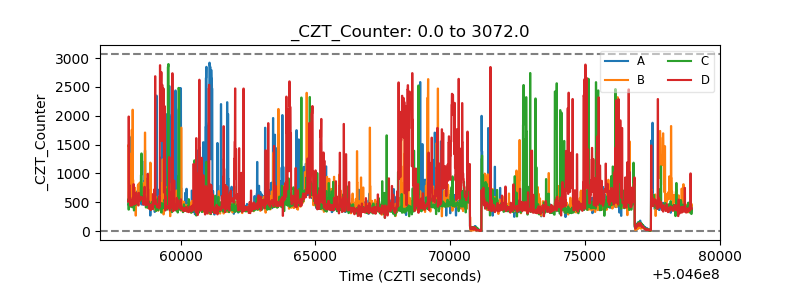 |
| +2.5 Volts monitor |  |
| +5 Volts monitor |  |
| _ROLL_ROT | 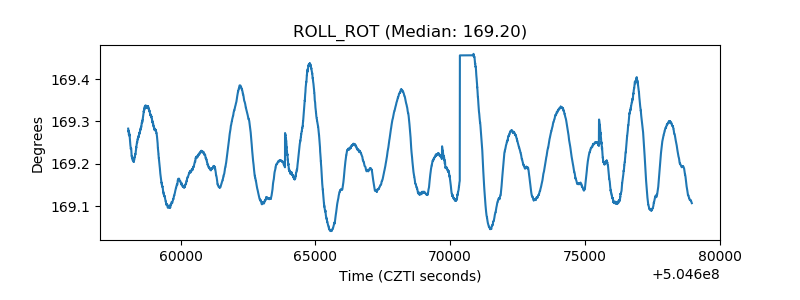 |
| _Roll_DEC | 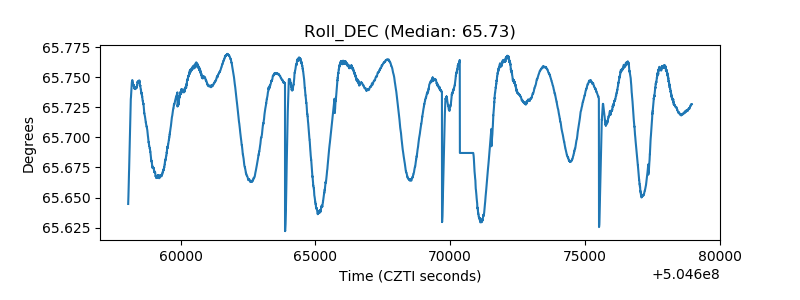 |
| _Roll_RA | 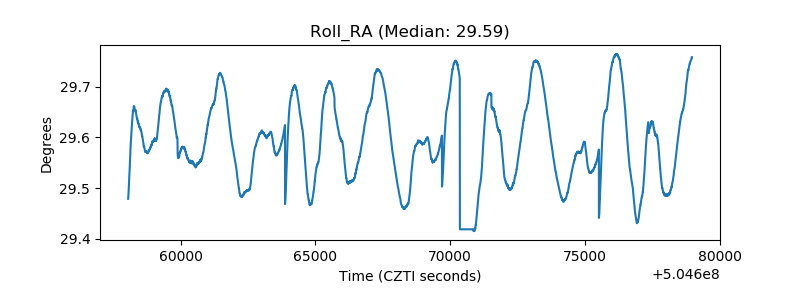 |
| Veto Counter | 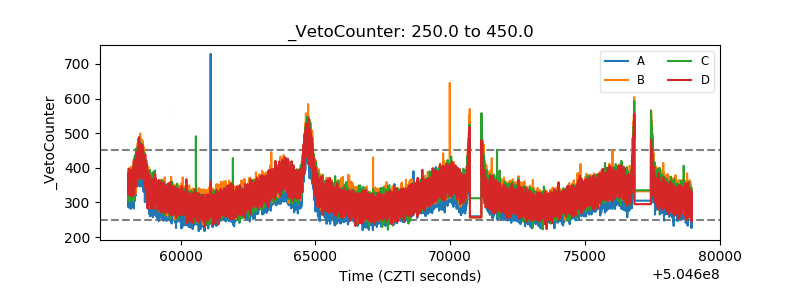 |