| Param | Original file | Final file |
|---|---|---|
| Filename | modeM0/AS1A14_099T01_9000006536_55470cztM0_level2.fits | modeM0/AS1A14_099T01_9000006536_55470cztM0_level2_quad_clean.evt |
| Size (bytes) | 475,358,400 | 103,728,960 |
| Size | 453.3 MB | 98.9 MB |
| Events in quadrant A | 3,362,750 | 688,463 |
| Events in quadrant B | 4,475,054 | 712,810 |
| Events in quadrant C | 5,039,368 | 598,334 |
| Events in quadrant D | 4,137,008 | 620,541 |
| Mode M9 | |||
|---|---|---|---|
| Quadrant | BADHDUFLAG | Total packets | Discarded packets |
| A | 0 | 13 | 0 |
| B | 0 | 13 | 0 |
| C | 0 | 13 | 0 |
| D | 0 | 13 | 0 |
| Mode SS | |||
|---|---|---|---|
| Quadrant | BADHDUFLAG | Total packets | Discarded packets |
| A | 0 | 154 | 2 |
| B | 0 | 154 | 2 |
| C | 0 | 154 | 2 |
| D | 0 | 154 | 2 |
| Mode M0 | |||
|---|---|---|---|
| Quadrant | BADHDUFLAG | Total packets | Discarded packets |
| A | 0 | 15649 | 191 |
| B | 0 | 19048 | 242 |
| C | 0 | 21114 | 314 |
| D | 0 | 18009 | 271 |
| Quadrant | Total seconds | Saturated seconds | Saturation percentage |
|---|---|---|---|
| A | 7476 | 70 | 0.936330% |
| B | 7482 | 379 | 5.065491% |
| C | 7479 | 791 | 10.576280% |
| D | 7484 | 183 | 2.445216% |
Noise dominated data is calculated using 1-second bins in cleaned event files. If a bin has >2000 counts, and if more than 50% of those come from <1% of pixels, then it is considered to be noise-dominated and hence unusable.
| Quadrant | # 1 sec bins | Bins with >0 counts | Bins with >2000 counts | High rate bins dominated by noise | Noise dominated (total time) | Noise dominated (detector-on time) | Marked lightcurve |
|---|---|---|---|---|---|---|---|
| A | 8958 | 7492 | 6 | 6 | 0.07% | 0.08% | 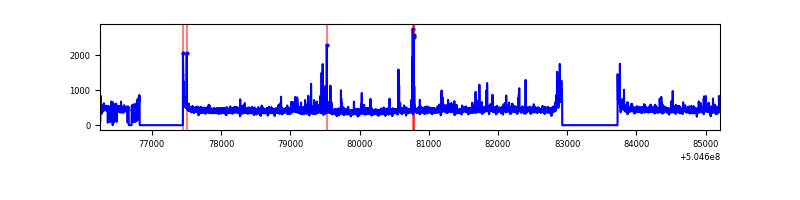 |
| B | 8958 | 7491 | 175 | 175 | 1.95% | 2.34% | 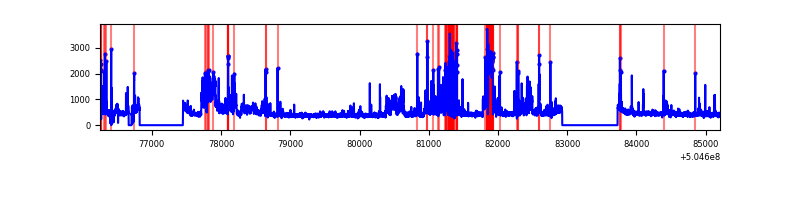 |
| C | 8958 | 7492 | 713 | 713 | 7.96% | 9.52% | 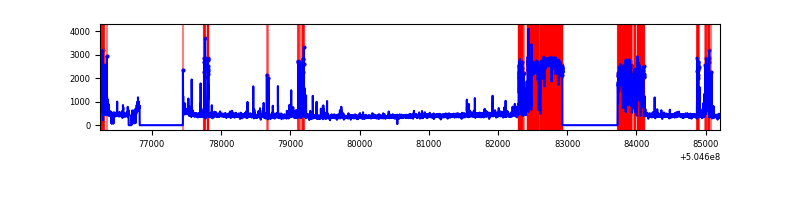 |
| D | 8959 | 7496 | 147 | 147 | 1.64% | 1.96% | 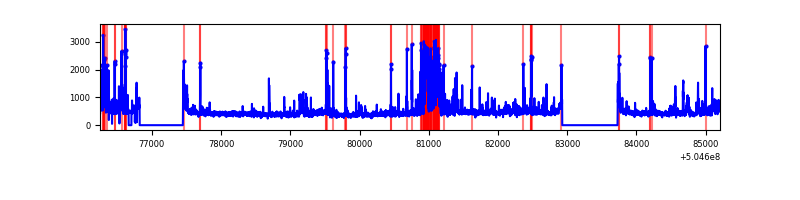 |
Top three noisy pixels from each quadrant. If the there are fewer than three noisy pixels in the level2.evt file, extra rows are filled as -1
| Pixel properties | Quadrant properties | ||||||
|---|---|---|---|---|---|---|---|
| Quadrant | DetID | PixID | Counts | Sigma | Mean | Median | Sigma |
| A | 3 | 78 | 124447 | 625.5 | 795 | 774 | 197.7 |
| A | 4 | 3 | 31362 | 154.71 | 795 | 774 | 197.7 |
| A | 3 | 14 | 28936 | 142.44 | 795 | 774 | 197.7 |
| B | 5 | 172 | 665176 | 4035.34 | 774 | 744 | 164.7 |
| B | 0 | 171 | 531711 | 3224.76 | 774 | 744 | 164.7 |
| B | 10 | 247 | 103358 | 623.21 | 774 | 744 | 164.7 |
| C | 9 | 38 | 1911773 | 9775.68 | 715 | 709 | 195.5 |
| C | 13 | 3 | 159014 | 809.78 | 715 | 709 | 195.5 |
| C | 12 | 252 | 135233 | 688.13 | 715 | 709 | 195.5 |
| D | 8 | 160 | 586777 | 2699.6 | 768 | 735 | 217.1 |
| D | 11 | 129 | 193103 | 886.14 | 768 | 735 | 217.1 |
| D | 2 | 249 | 129302 | 592.24 | 768 | 735 | 217.1 |
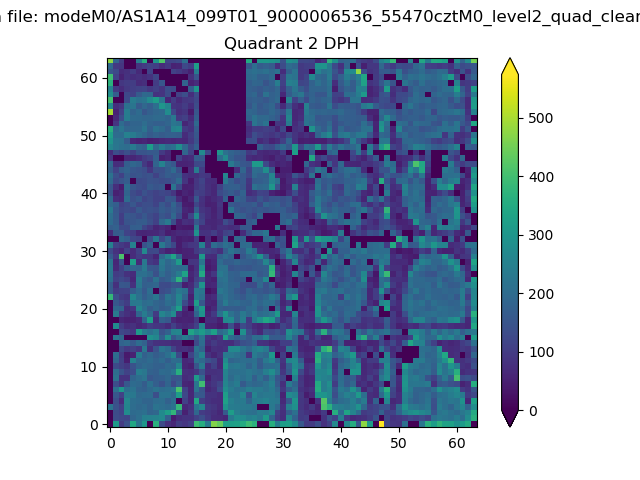
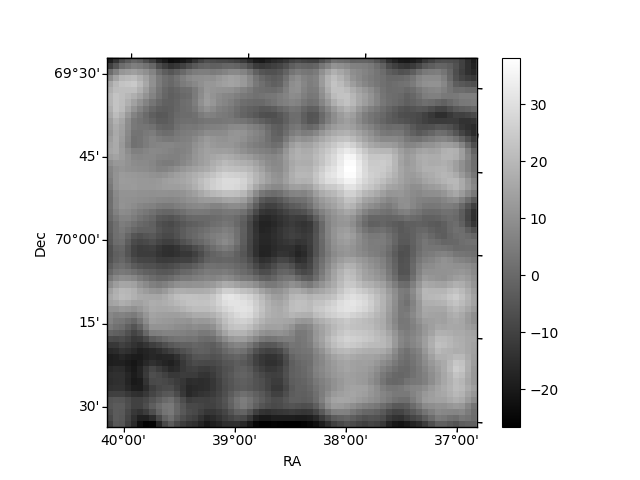
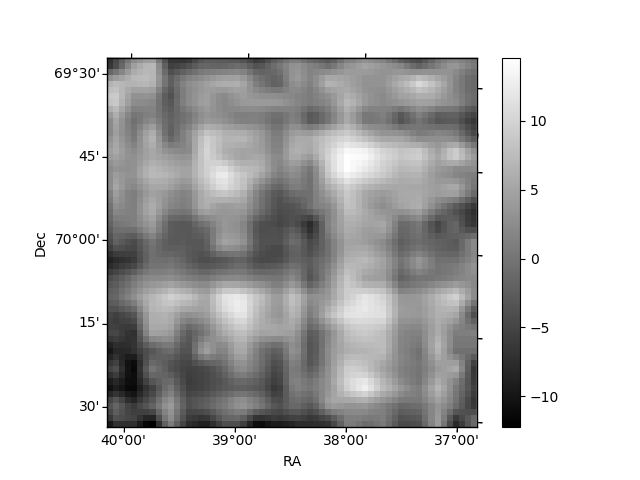
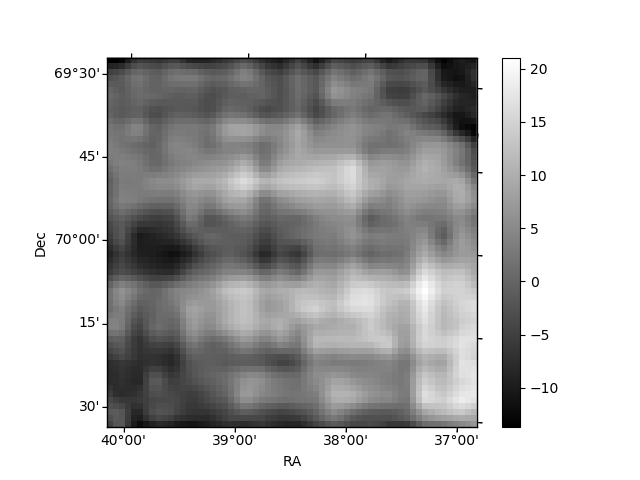
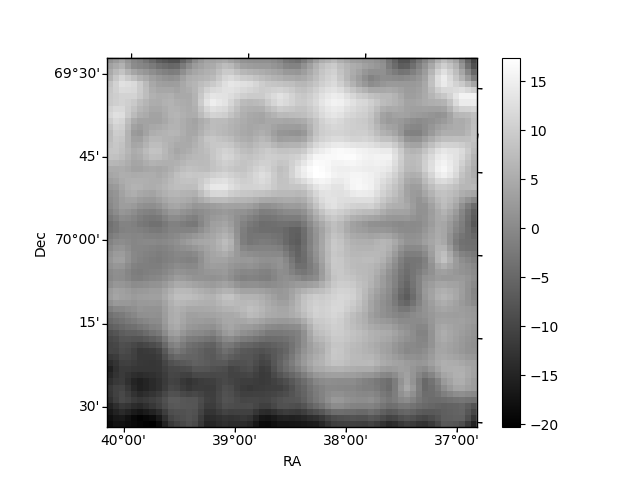
Histogram calculated using DETX and DETY for each event in the final _common_clean file
| Quadrant A | 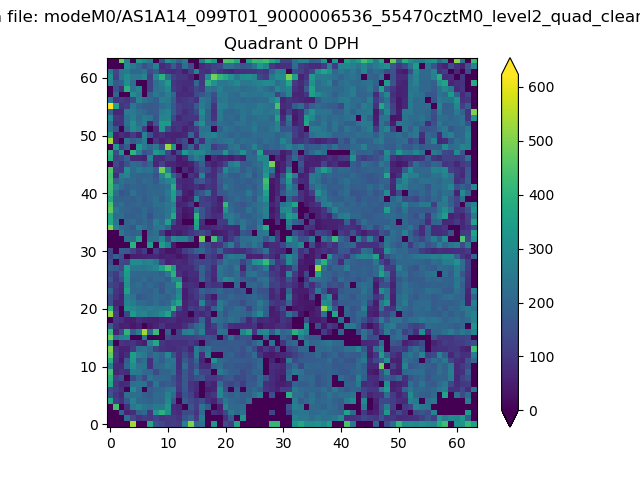 |
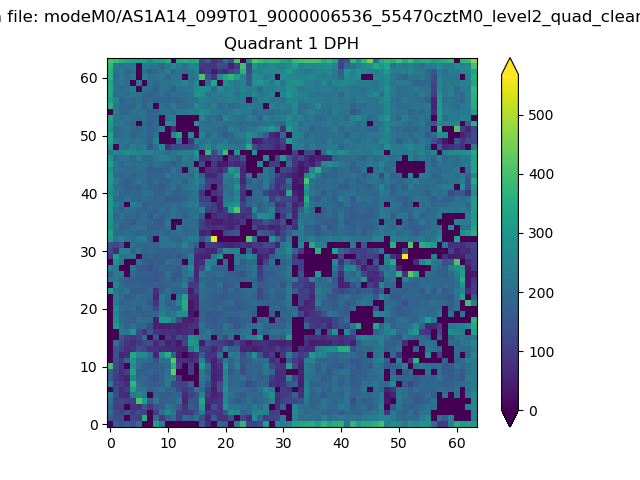 |
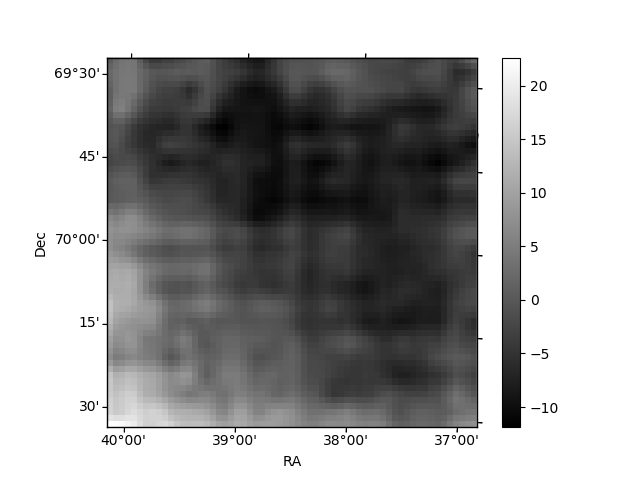
Quadrant B |
|---|---|---|---|
| Quadrant D | 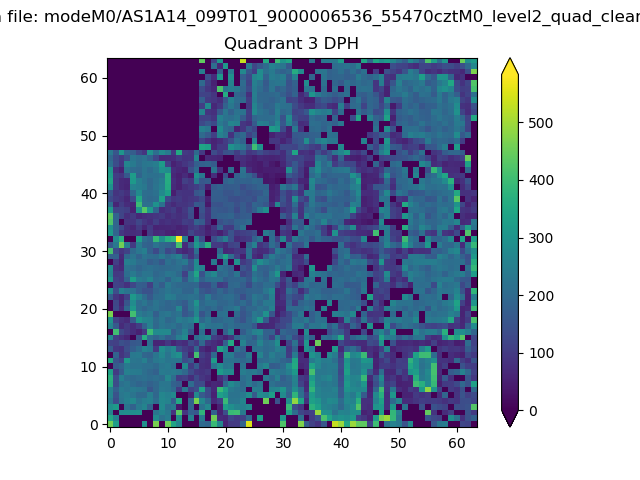 |
 |
Quadrant C |
| Plot type | Count rate plots | Images |
|---|---|---|
| Comparison with Poisson distribution Blue bars denote a histogram of data divided into 1 sec bins. Red curve is a Poisson curve with rate = median count rate of data. |
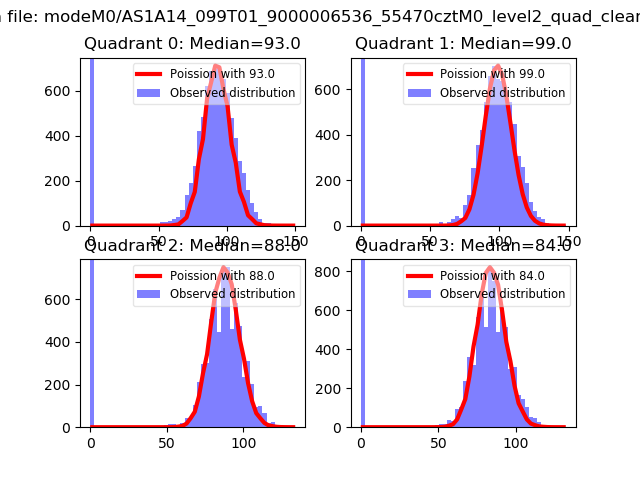 |
 |
| Quadrant-wise count rates Data is divided into 100 sec bins |
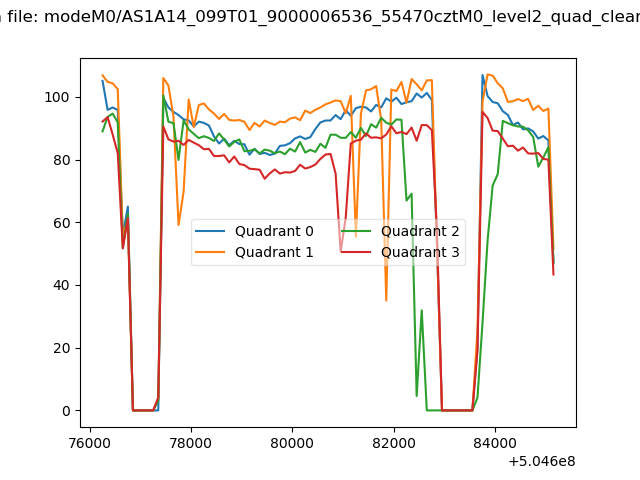 |
|
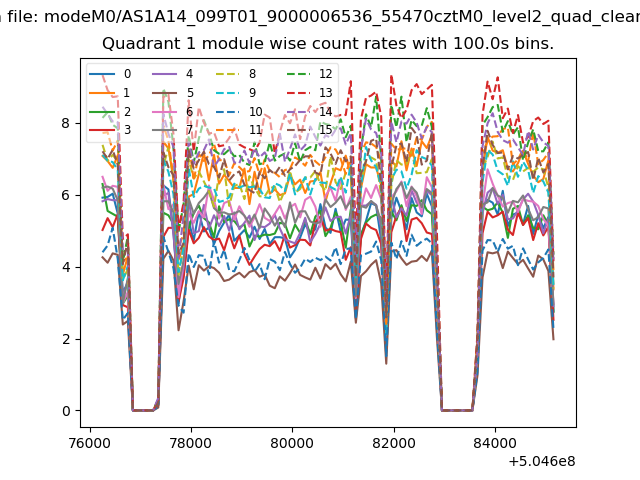
| Module-wise count rates for Quadrant A Data is divided into 100 sec bins |
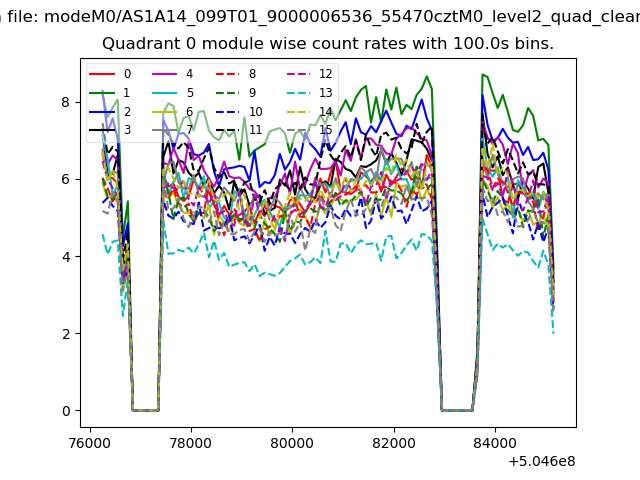 |
 |
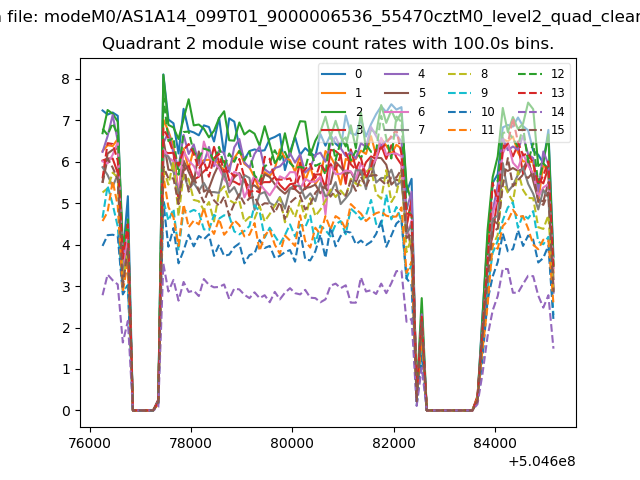
| Module-wise count rates for Quadrant B Data is divided into 100 sec bins |
 |
 |
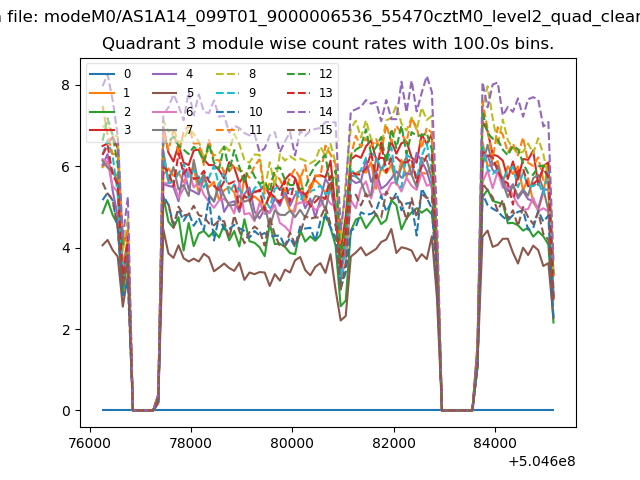
| Module-wise count rates for Quadrant C Data is divided into 100 sec bins |
 |
 |
| Module-wise count rates for Quadrant D Data is divided into 100 sec bins |
 |
 |
| Parameter | Plot |
|---|---|
| CZT HV Monitor | 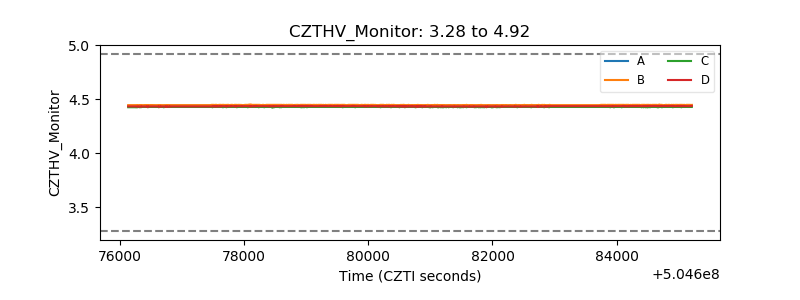 |
| D_VDD | 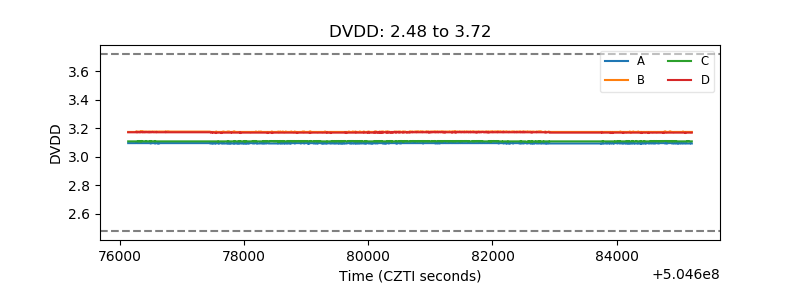 |
| Temperature 1 | 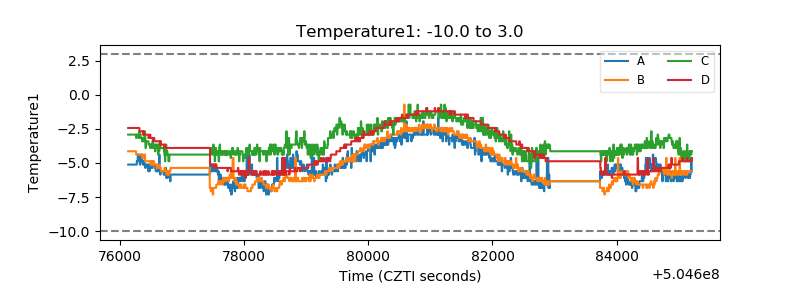 |
| Veto HV Monitor | 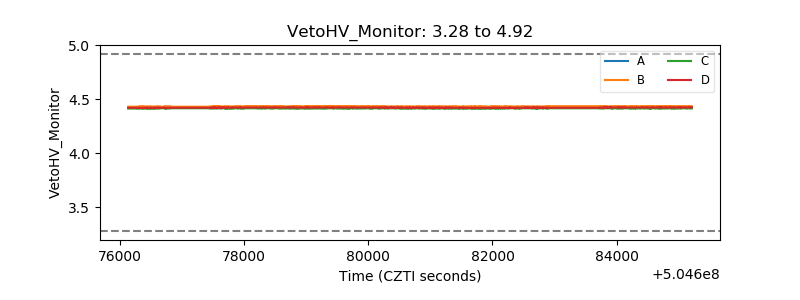 |
| Veto LLD | 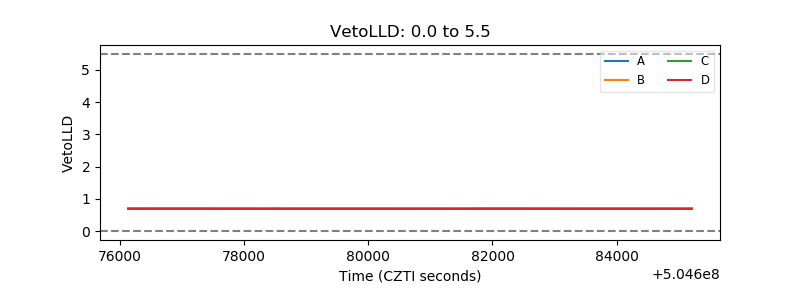 |
| Alpha Counter | 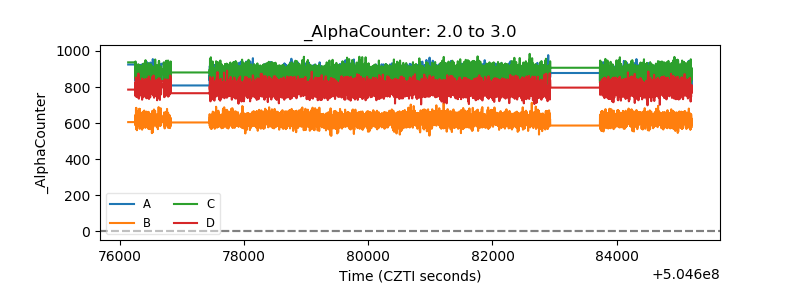 |
| _CPM_Rate | 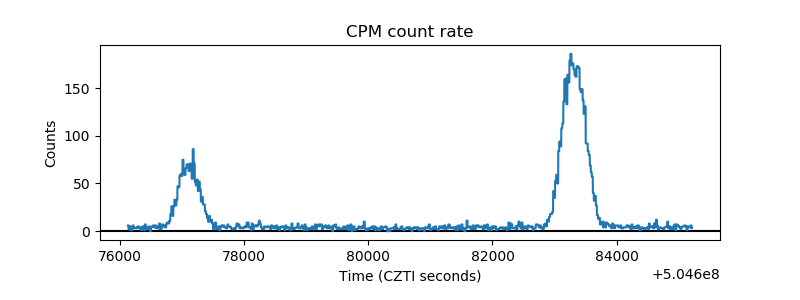 |
| CZT Counter | 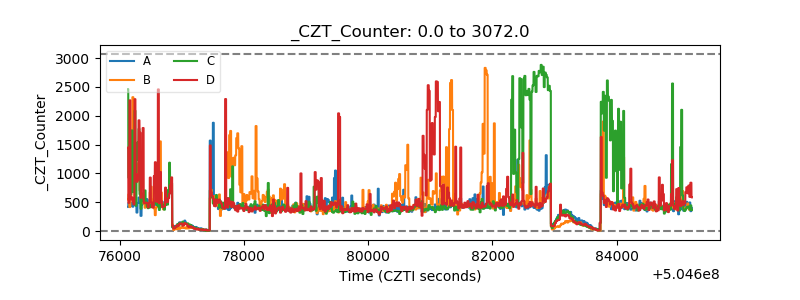 |
| +2.5 Volts monitor | 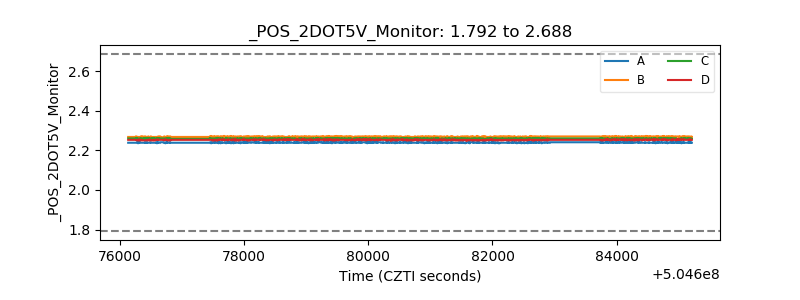 |
| +5 Volts monitor | 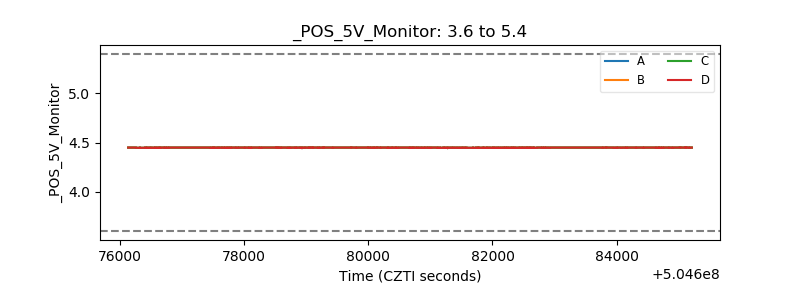 |
| _ROLL_ROT | 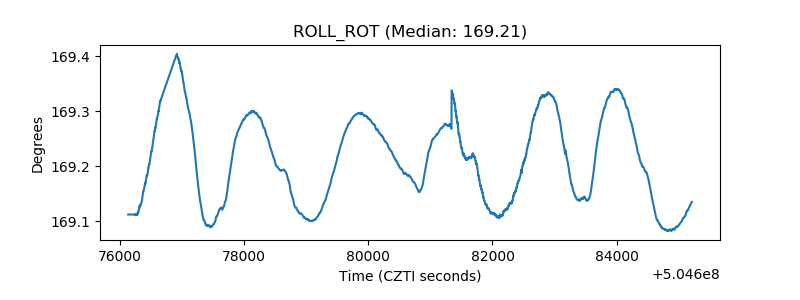 |
| _Roll_DEC | 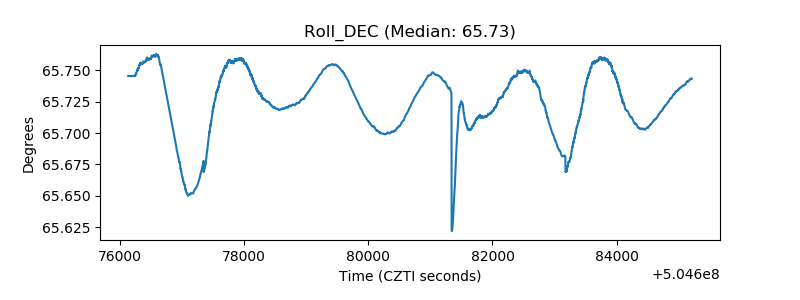 |
| _Roll_RA | 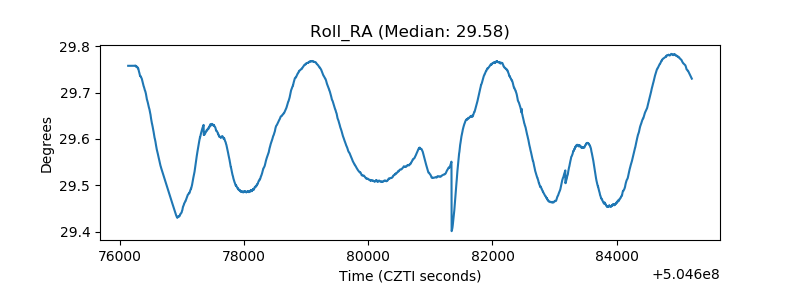 |
| Veto Counter | 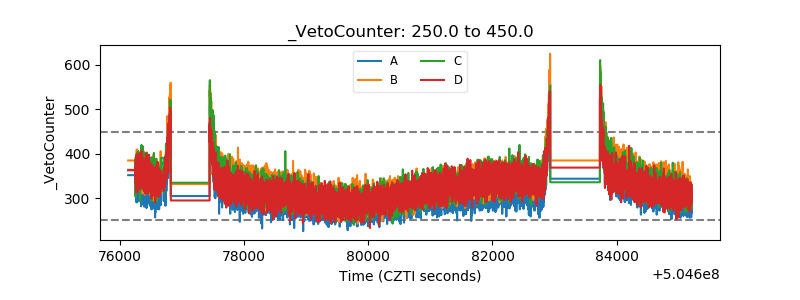 |