| Param | Original file | Final file |
|---|---|---|
| Filename | modeM0/AS1A14_099T01_9000006536_55472cztM0_level2.fits | modeM0/AS1A14_099T01_9000006536_55472cztM0_level2_quad_clean.evt |
| Size (bytes) | 450,993,600 | 99,702,720 |
| Size | 430.1 MB | 95.1 MB |
| Events in quadrant A | 3,240,233 | 662,726 |
| Events in quadrant B | 3,860,498 | 706,048 |
| Events in quadrant C | 4,937,419 | 568,742 |
| Events in quadrant D | 4,105,081 | 588,752 |
| Mode M9 | |||
|---|---|---|---|
| Quadrant | BADHDUFLAG | Total packets | Discarded packets |
| A | 0 | 18 | 0 |
| B | 0 | 18 | 0 |
| C | 0 | 18 | 0 |
| D | 0 | 18 | 0 |
| Mode SS | |||
|---|---|---|---|
| Quadrant | BADHDUFLAG | Total packets | Discarded packets |
| A | 0 | 144 | 0 |
| B | 0 | 144 | 0 |
| C | 0 | 144 | 0 |
| D | 0 | 144 | 0 |
| Mode M0 | |||
|---|---|---|---|
| Quadrant | BADHDUFLAG | Total packets | Discarded packets |
| A | 0 | 14902 | 0 |
| B | 0 | 16570 | 0 |
| C | 0 | 20136 | 0 |
| D | 0 | 17287 | 0 |
| Quadrant | Total seconds | Saturated seconds | Saturation percentage |
|---|---|---|---|
| A | 7083 | 99 | 1.397713% |
| B | 7083 | 199 | 2.809544% |
| C | 7068 | 772 | 10.922467% |
| D | 7083 | 188 | 2.654243% |
Noise dominated data is calculated using 1-second bins in cleaned event files. If a bin has >2000 counts, and if more than 50% of those come from <1% of pixels, then it is considered to be noise-dominated and hence unusable.
| Quadrant | # 1 sec bins | Bins with >0 counts | Bins with >2000 counts | High rate bins dominated by noise | Noise dominated (total time) | Noise dominated (detector-on time) | Marked lightcurve |
|---|---|---|---|---|---|---|---|
| A | 8859 | 7098 | 10 | 10 | 0.11% | 0.14% | 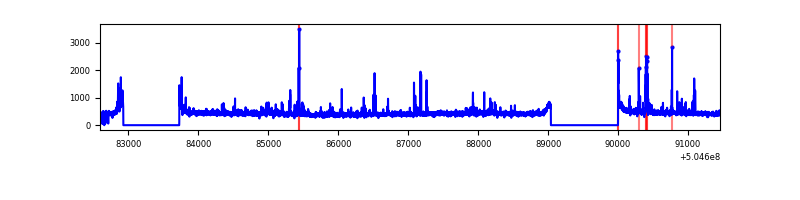 |
| B | 8859 | 7098 | 80 | 80 | 0.90% | 1.13% | 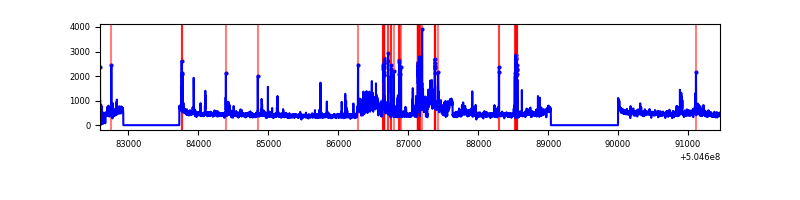 |
| C | 8859 | 7074 | 675 | 675 | 7.62% | 9.54% | 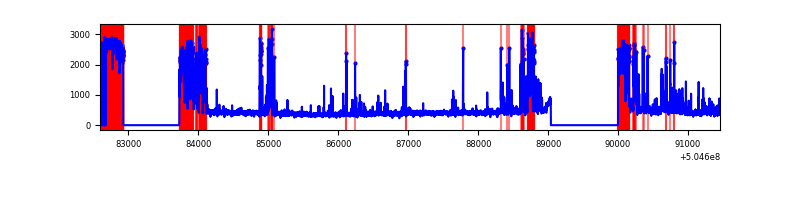 |
| D | 8859 | 7099 | 133 | 133 | 1.50% | 1.87% | 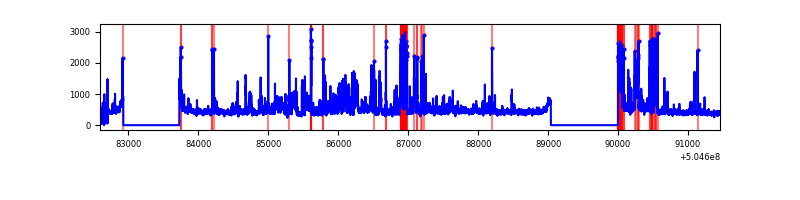 |
Top three noisy pixels from each quadrant. If the there are fewer than three noisy pixels in the level2.evt file, extra rows are filled as -1
| Pixel properties | Quadrant properties | ||||||
|---|---|---|---|---|---|---|---|
| Quadrant | DetID | PixID | Counts | Sigma | Mean | Median | Sigma |
| A | 0 | 8 | 58421 | 305.63 | 761 | 739 | 188.7 |
| A | 15 | 32 | 56068 | 293.16 | 761 | 739 | 188.7 |
| A | 3 | 78 | 37902 | 196.91 | 761 | 739 | 188.7 |
| B | 0 | 171 | 372698 | 2312.91 | 750 | 721 | 160.8 |
| B | 5 | 172 | 367875 | 2282.92 | 750 | 721 | 160.8 |
| B | 0 | 183 | 52197 | 320.07 | 750 | 721 | 160.8 |
| C | 9 | 38 | 1760855 | 9264.03 | 682 | 675 | 190.0 |
| C | 13 | 3 | 402411 | 2114.38 | 682 | 675 | 190.0 |
| C | 12 | 252 | 45497 | 235.9 | 682 | 675 | 190.0 |
| D | 8 | 160 | 808348 | 3909.56 | 729 | 700 | 206.6 |
| D | 2 | 249 | 253527 | 1223.85 | 729 | 700 | 206.6 |
| D | 11 | 129 | 94114 | 452.19 | 729 | 700 | 206.6 |
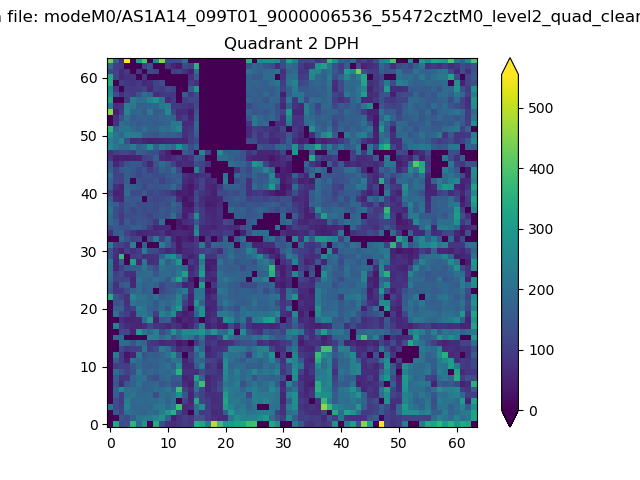
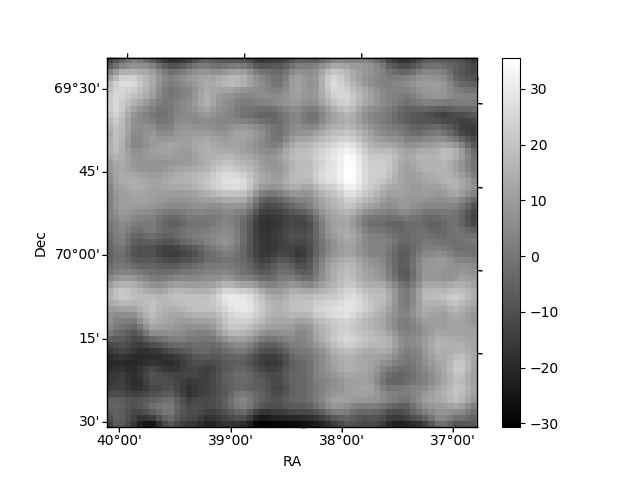
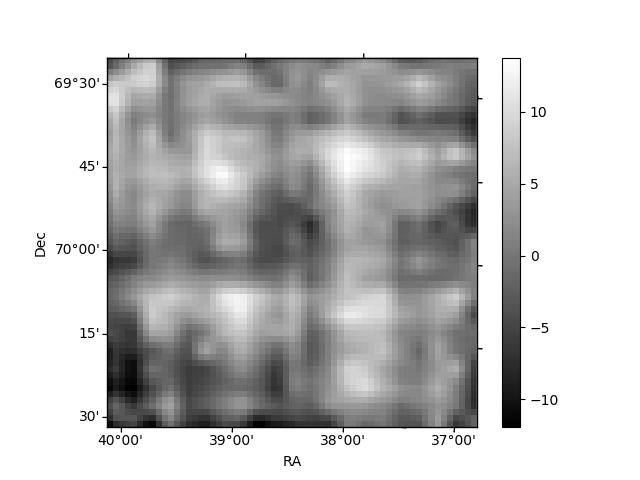
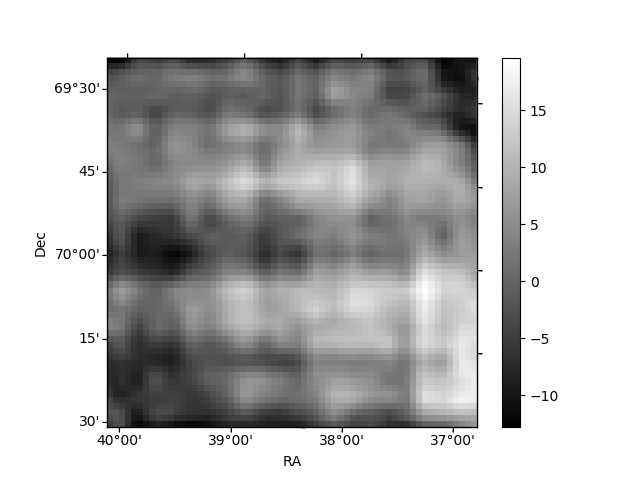
Histogram calculated using DETX and DETY for each event in the final _common_clean file
| Quadrant A | 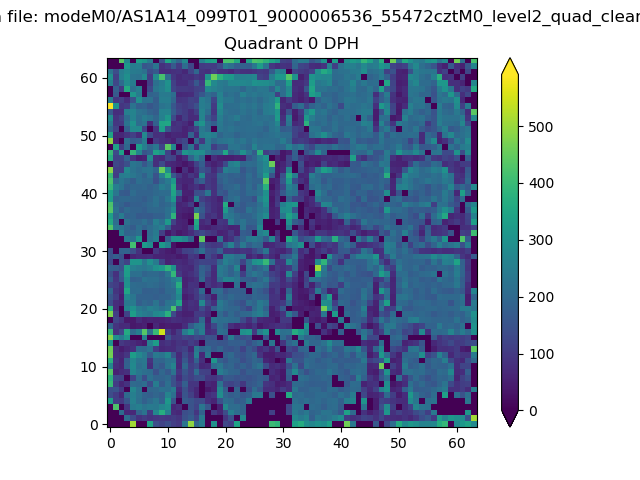 |
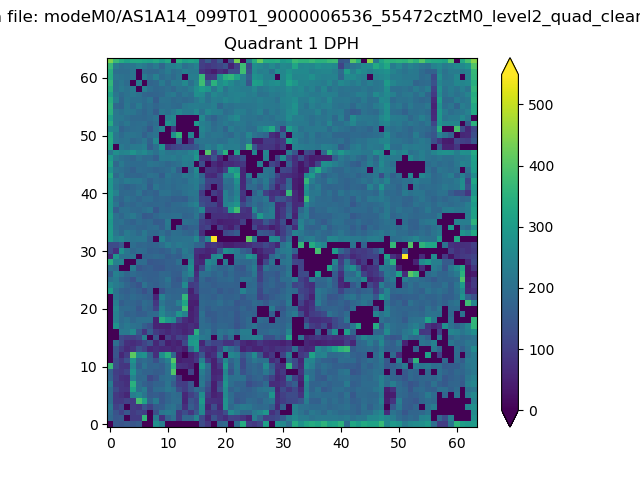 |
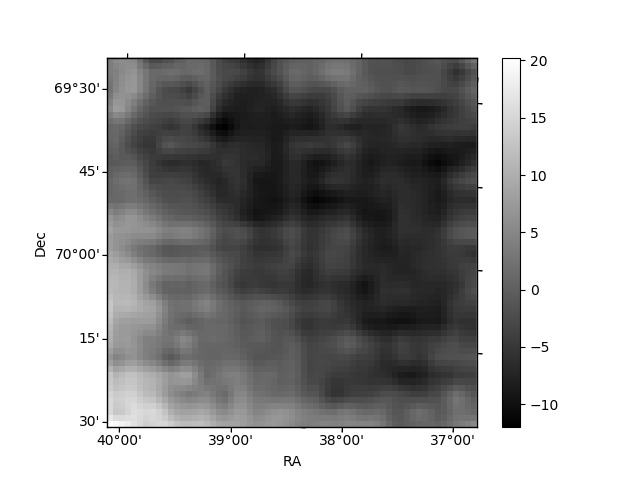
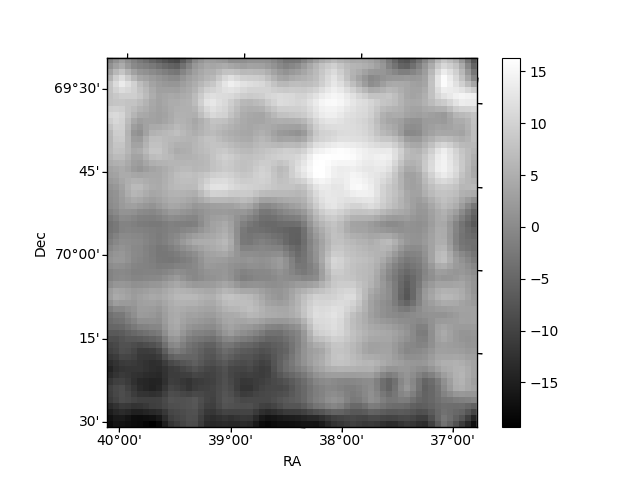
Quadrant B |
|---|---|---|---|
| Quadrant D | 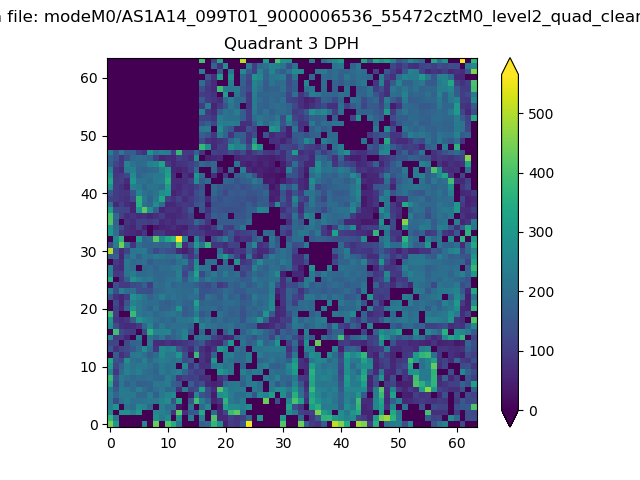 |
 |
Quadrant C |
| Plot type | Count rate plots | Images |
|---|---|---|
| Comparison with Poisson distribution Blue bars denote a histogram of data divided into 1 sec bins. Red curve is a Poisson curve with rate = median count rate of data. |
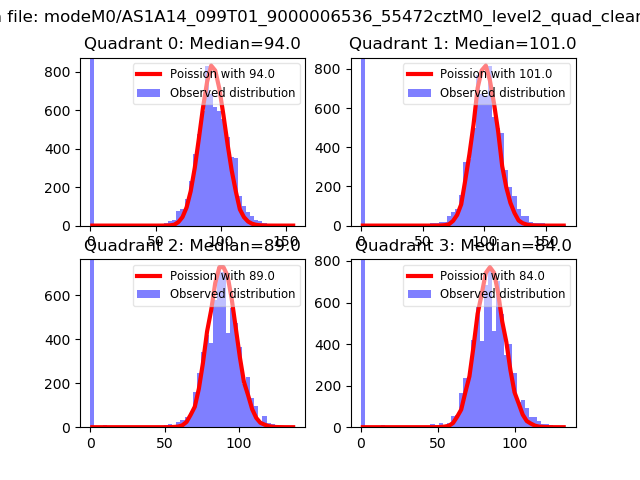 |
 |
| Quadrant-wise count rates Data is divided into 100 sec bins |
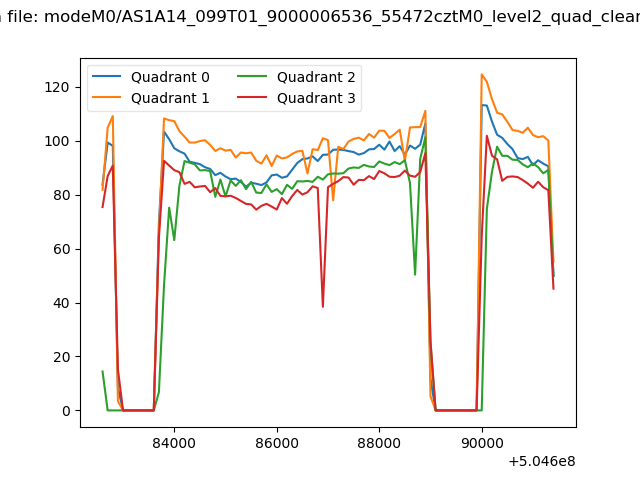 |
|
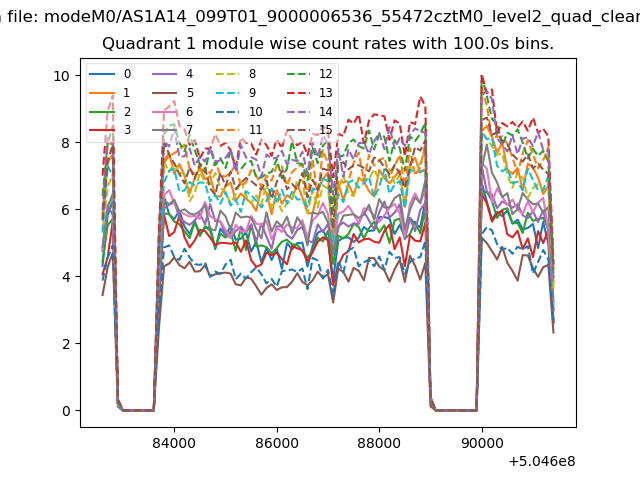
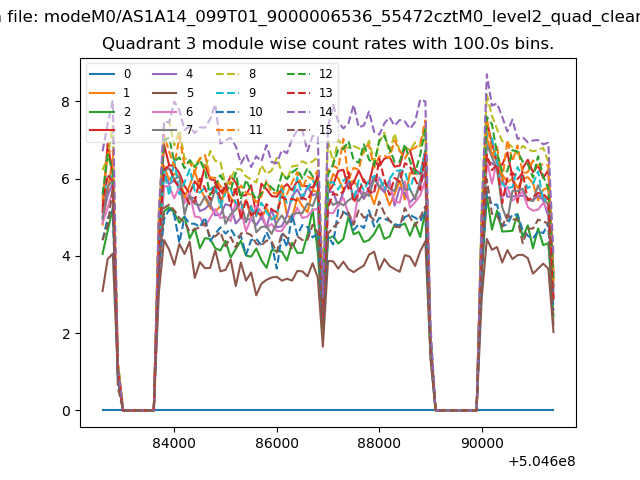
| Module-wise count rates for Quadrant A Data is divided into 100 sec bins |
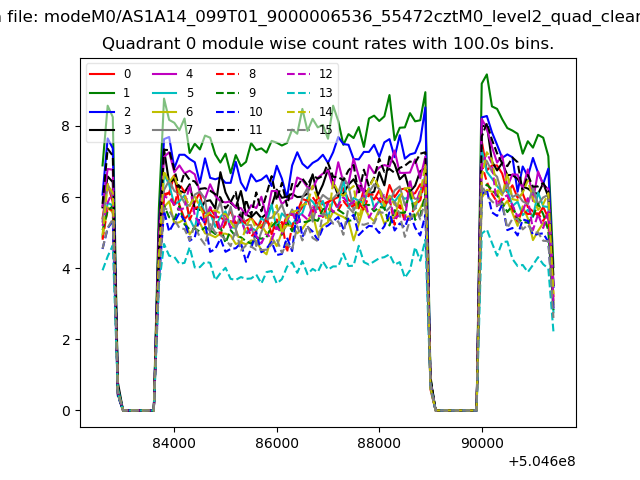 |
 |
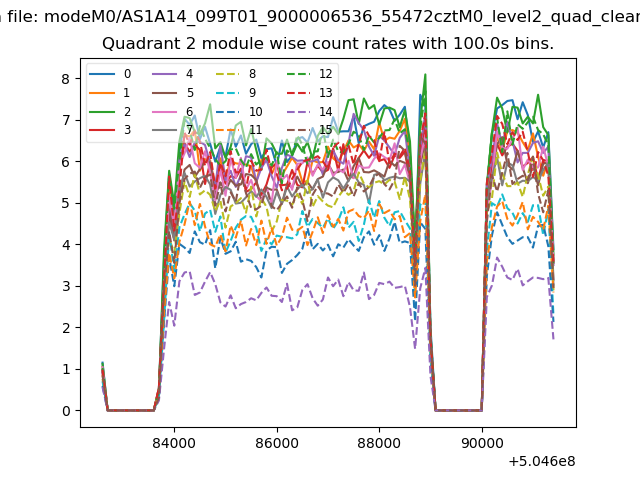
| Module-wise count rates for Quadrant B Data is divided into 100 sec bins |
 |
 |
| Module-wise count rates for Quadrant C Data is divided into 100 sec bins |
 |
 |
| Module-wise count rates for Quadrant D Data is divided into 100 sec bins |
 |
 |
| Parameter | Plot |
|---|---|
| CZT HV Monitor | 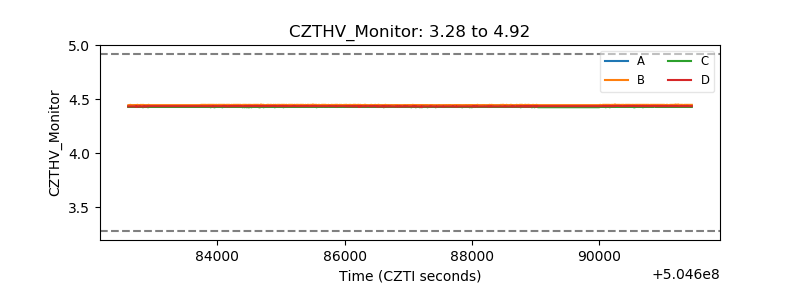 |
| D_VDD | 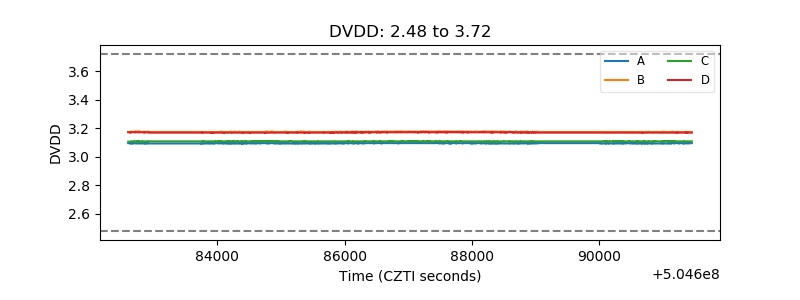 |
| Temperature 1 | 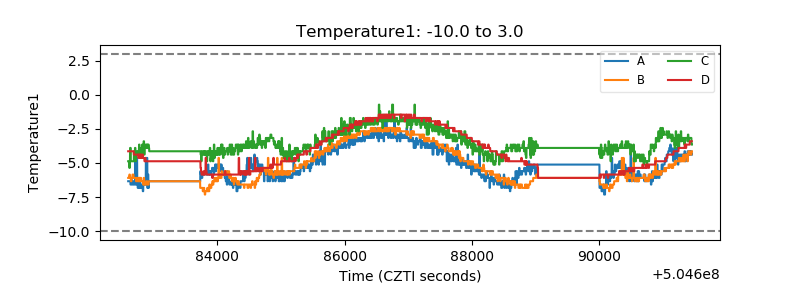 |
| Veto HV Monitor |  |
| Veto LLD | 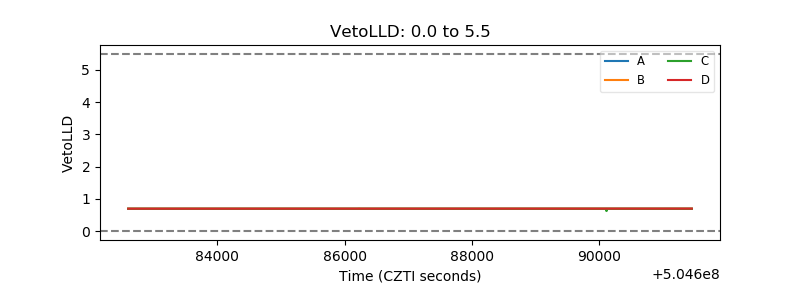 |
| Alpha Counter | 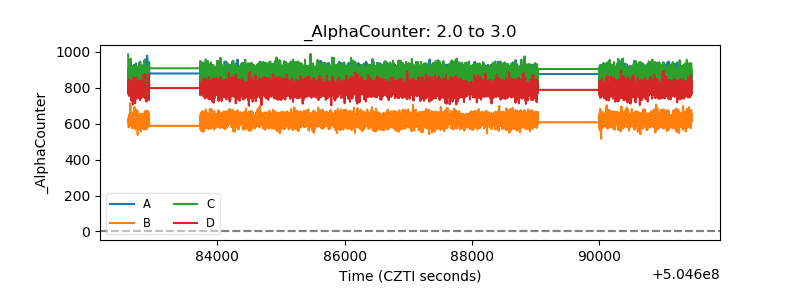 |
| _CPM_Rate | 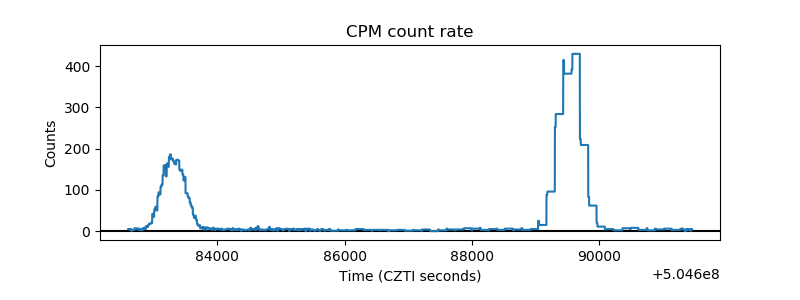 |
| CZT Counter | 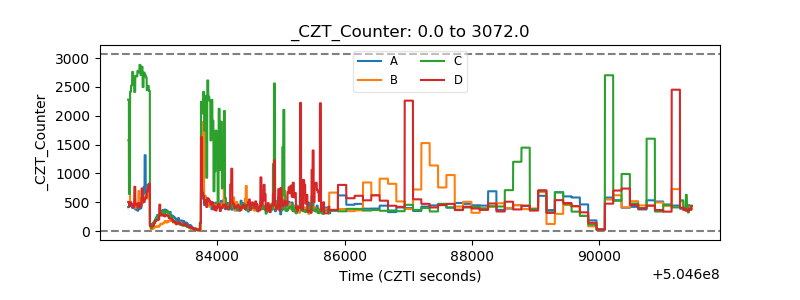 |
| +2.5 Volts monitor | 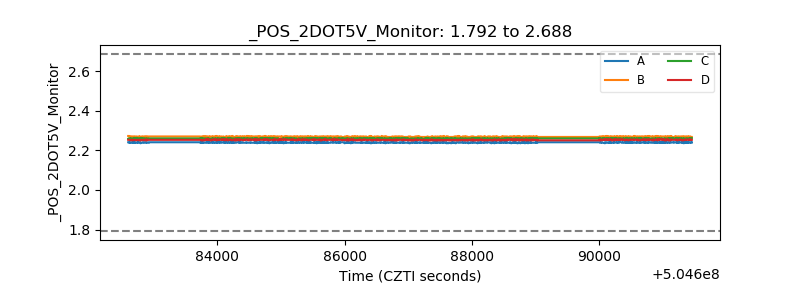 |
| +5 Volts monitor | 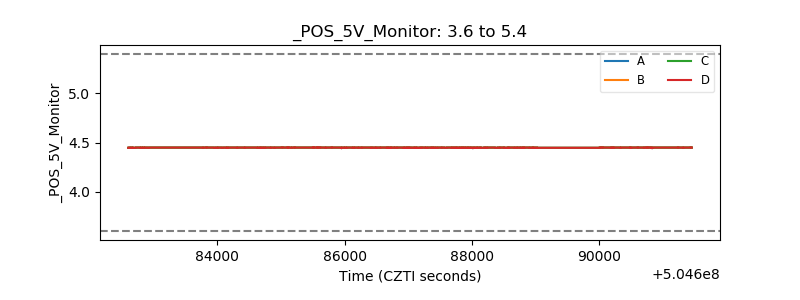 |
| _ROLL_ROT | 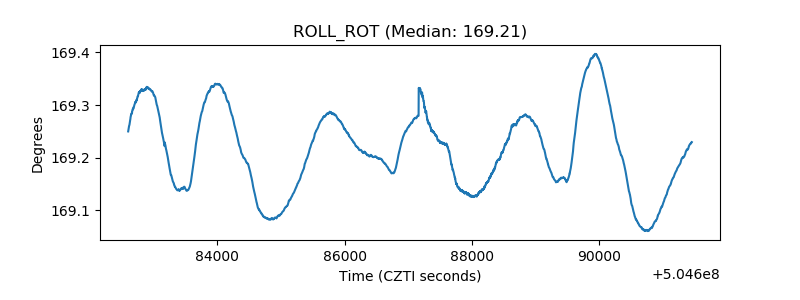 |
| _Roll_DEC | 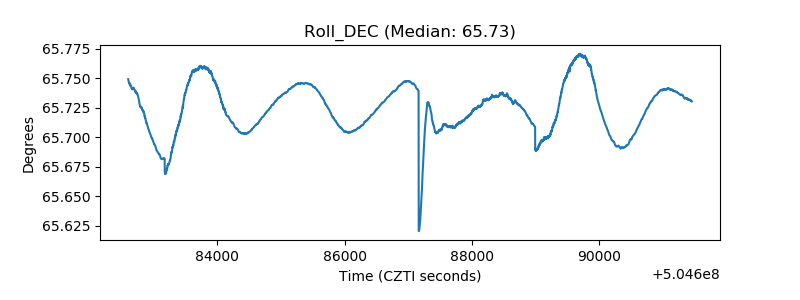 |
| _Roll_RA | 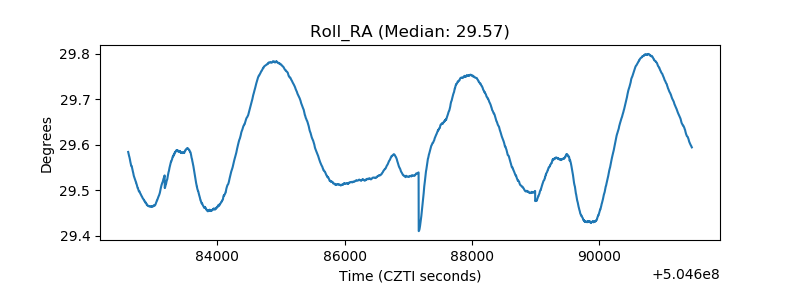 |
| Veto Counter | 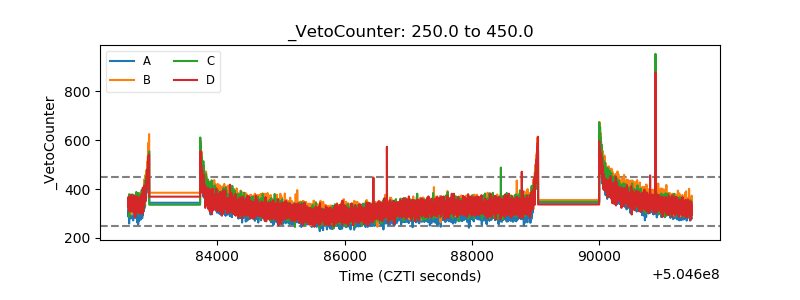 |