| Param | Original file | Final file |
|---|---|---|
| Filename | modeM0/AS1A14_099T01_9000006536_55473cztM0_level2.fits | modeM0/AS1A14_099T01_9000006536_55473cztM0_level2_quad_clean.evt |
| Size (bytes) | 425,600,640 | 96,854,400 |
| Size | 405.9 MB | 92.4 MB |
| Events in quadrant A | 3,480,793 | 636,234 |
| Events in quadrant B | 3,336,040 | 682,849 |
| Events in quadrant C | 3,761,190 | 594,731 |
| Events in quadrant D | 4,661,465 | 558,088 |
| Mode M9 | |||
|---|---|---|---|
| Quadrant | BADHDUFLAG | Total packets | Discarded packets |
| A | 0 | 21 | 2 |
| B | 0 | 21 | 3 |
| C | 0 | 21 | 3 |
| D | 0 | 21 | 3 |
| Mode SS | |||
|---|---|---|---|
| Quadrant | BADHDUFLAG | Total packets | Discarded packets |
| A | 0 | 134 | 2 |
| B | 0 | 134 | 2 |
| C | 0 | 134 | 2 |
| D | 0 | 134 | 2 |
| Mode M0 | |||
|---|---|---|---|
| Quadrant | BADHDUFLAG | Total packets | Discarded packets |
| A | 0 | 15193 | 91 |
| B | 0 | 14773 | 86 |
| C | 0 | 16117 | 95 |
| D | 0 | 18603 | 92 |
| Quadrant | Total seconds | Saturated seconds | Saturation percentage |
|---|---|---|---|
| A | 6615 | 191 | 2.887377% |
| B | 6615 | 180 | 2.721088% |
| C | 6615 | 228 | 3.446712% |
| D | 6614 | 334 | 5.049894% |
Noise dominated data is calculated using 1-second bins in cleaned event files. If a bin has >2000 counts, and if more than 50% of those come from <1% of pixels, then it is considered to be noise-dominated and hence unusable.
| Quadrant | # 1 sec bins | Bins with >0 counts | Bins with >2000 counts | High rate bins dominated by noise | Noise dominated (total time) | Noise dominated (detector-on time) | Marked lightcurve |
|---|---|---|---|---|---|---|---|
| A | 7655 | 6615 | 85 | 85 | 1.11% | 1.28% | 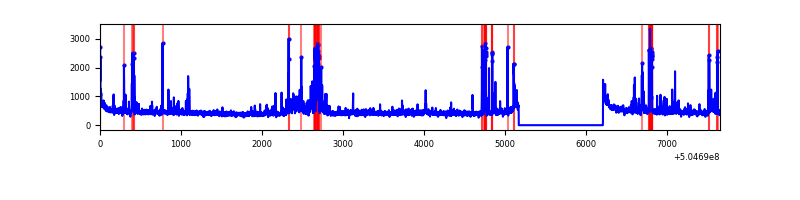 |
| B | 7655 | 6615 | 72 | 72 | 0.94% | 1.09% | 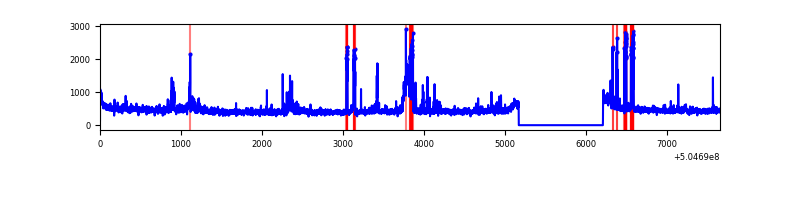 |
| C | 7655 | 6615 | 163 | 163 | 2.13% | 2.46% | 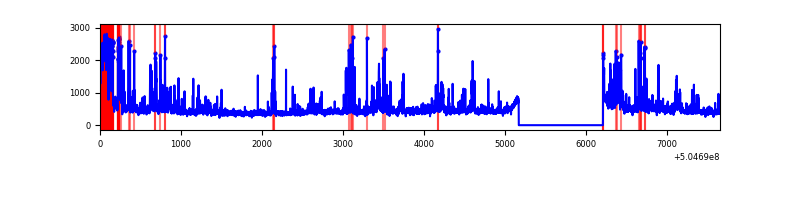 |
| D | 7654 | 6614 | 261 | 261 | 3.41% | 3.95% | 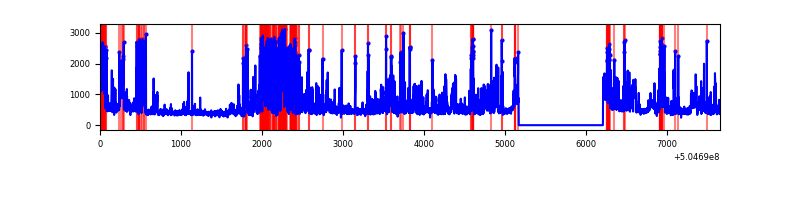 |
Top three noisy pixels from each quadrant. If the there are fewer than three noisy pixels in the level2.evt file, extra rows are filled as -1
| Pixel properties | Quadrant properties | ||||||
|---|---|---|---|---|---|---|---|
| Quadrant | DetID | PixID | Counts | Sigma | Mean | Median | Sigma |
| A | 0 | 8 | 246408 | 1369.53 | 720 | 702 | 179.4 |
| A | 3 | 78 | 234904 | 1305.41 | 720 | 702 | 179.4 |
| A | 6 | 179 | 64396 | 355.02 | 720 | 702 | 179.4 |
| B | 5 | 172 | 224437 | 1479.82 | 709 | 683 | 151.2 |
| B | 0 | 171 | 156555 | 1030.87 | 709 | 683 | 151.2 |
| B | 0 | 183 | 47565 | 310.06 | 709 | 683 | 151.2 |
| C | 9 | 38 | 664473 | 3553.13 | 682 | 674 | 186.8 |
| C | 13 | 3 | 227929 | 1216.43 | 682 | 674 | 186.8 |
| C | 12 | 2 | 62679 | 331.9 | 682 | 674 | 186.8 |
| D | 11 | 129 | 1314728 | 6742.96 | 685 | 653 | 194.9 |
| D | 8 | 160 | 372449 | 1907.81 | 685 | 653 | 194.9 |
| D | 2 | 249 | 164790 | 842.24 | 685 | 653 | 194.9 |
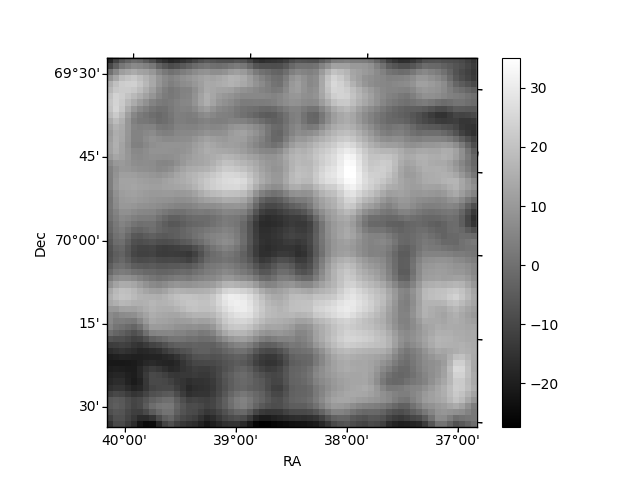
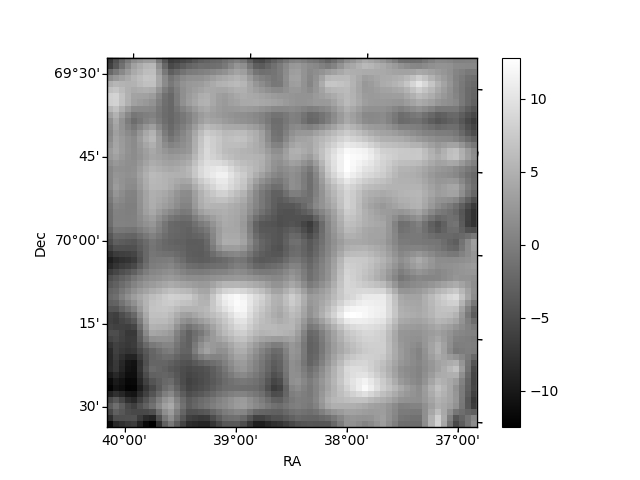
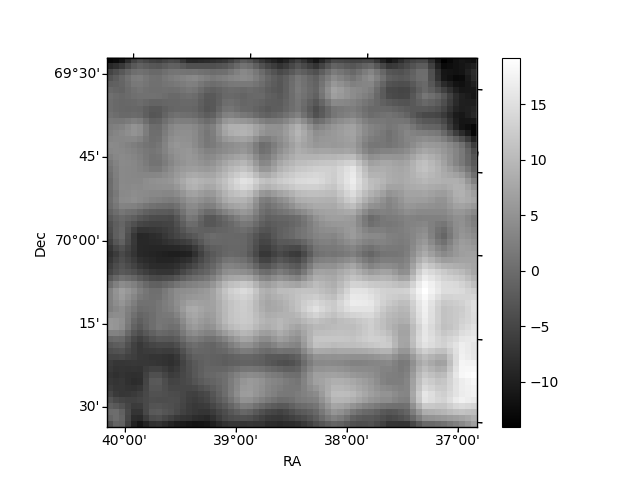
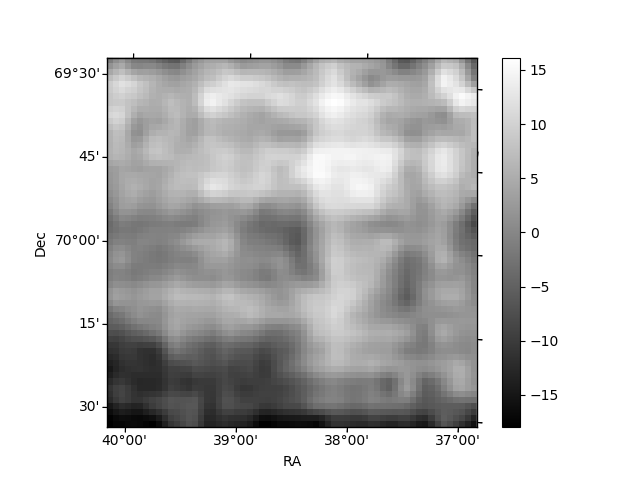
Histogram calculated using DETX and DETY for each event in the final _common_clean file
| Quadrant A | 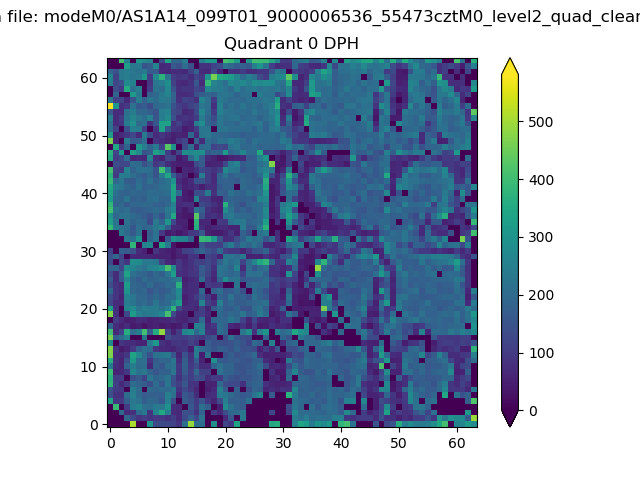 |
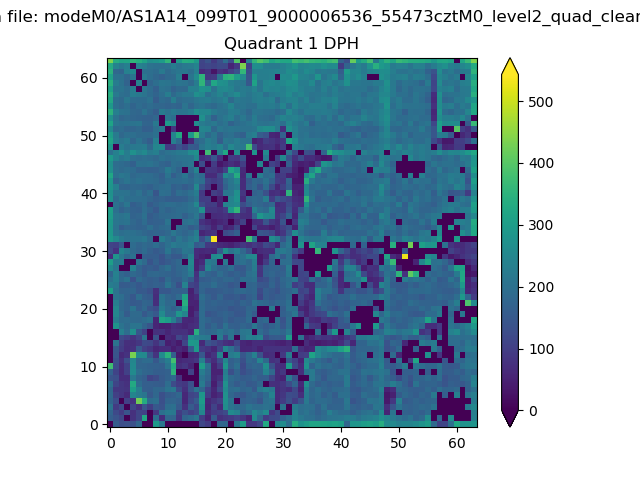 |
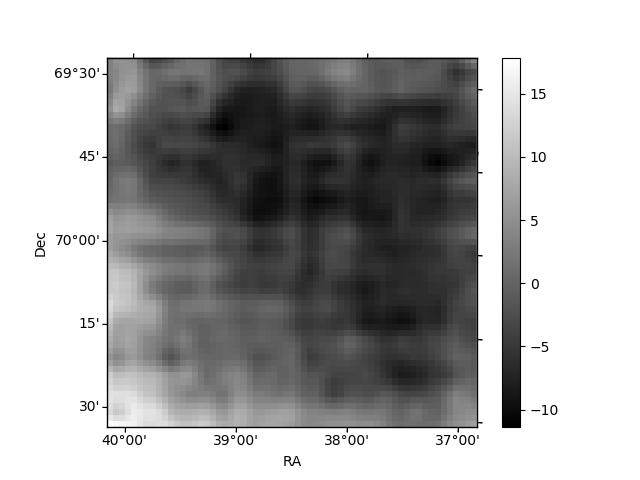
Quadrant B |
|---|---|---|---|
| Quadrant D | 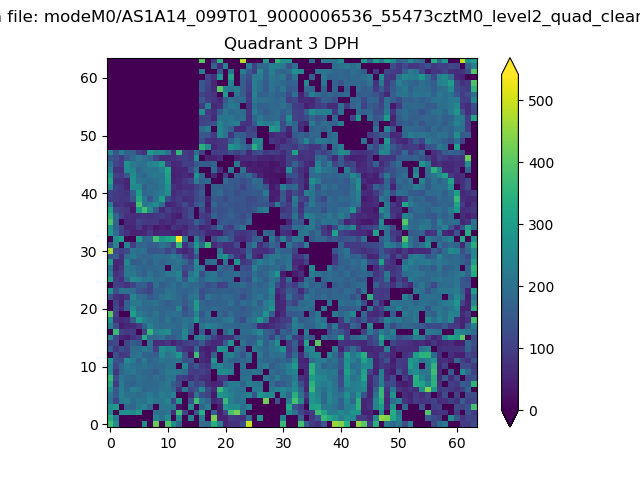 |
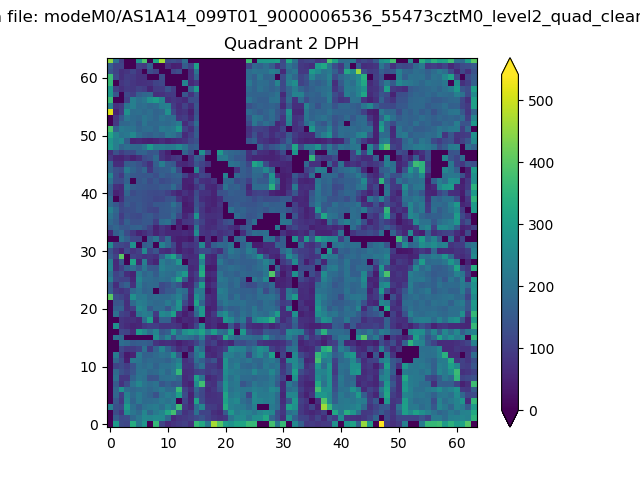 |
Quadrant C |
| Plot type | Count rate plots | Images |
|---|---|---|
| Comparison with Poisson distribution Blue bars denote a histogram of data divided into 1 sec bins. Red curve is a Poisson curve with rate = median count rate of data. |
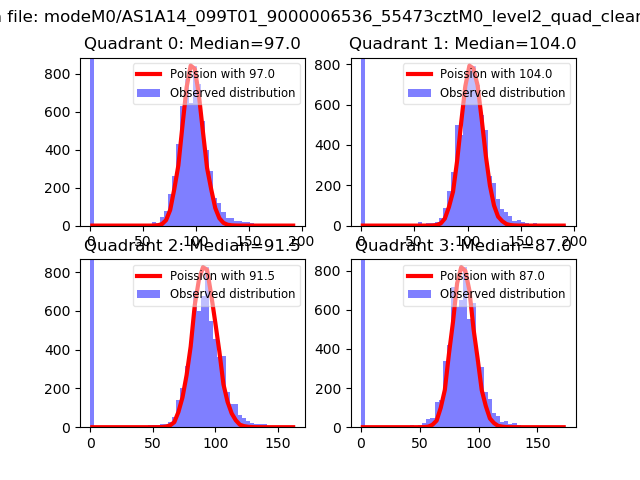 |
 |
| Quadrant-wise count rates Data is divided into 100 sec bins |
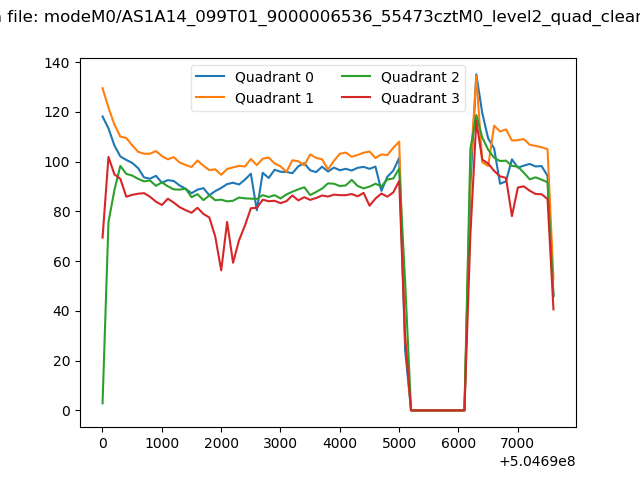 |
|
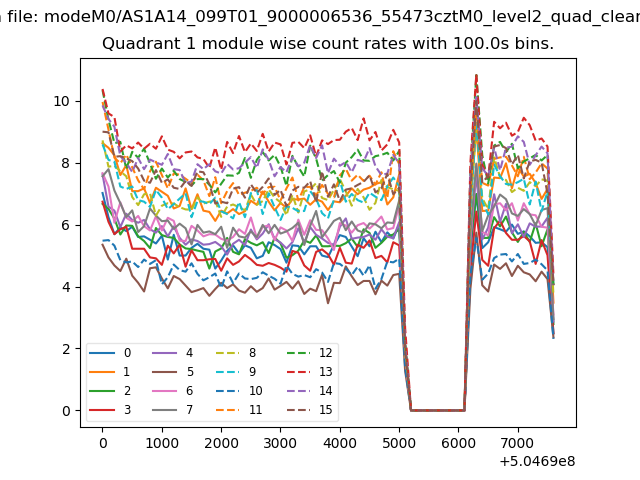
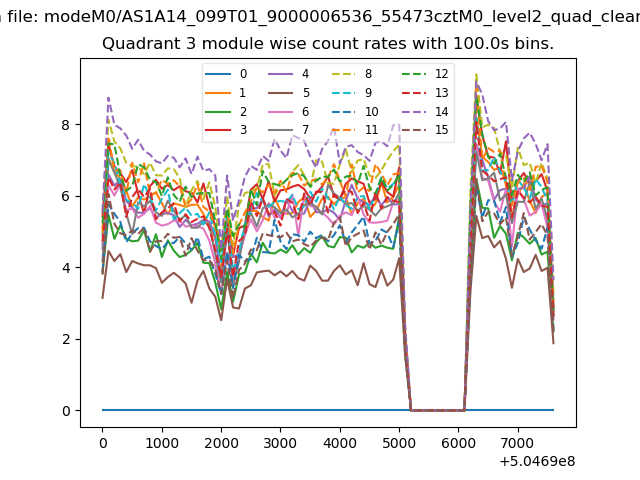
| Module-wise count rates for Quadrant A Data is divided into 100 sec bins |
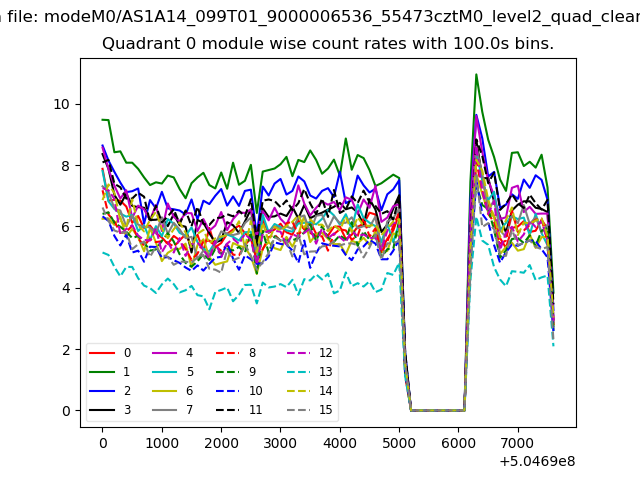 |
 |
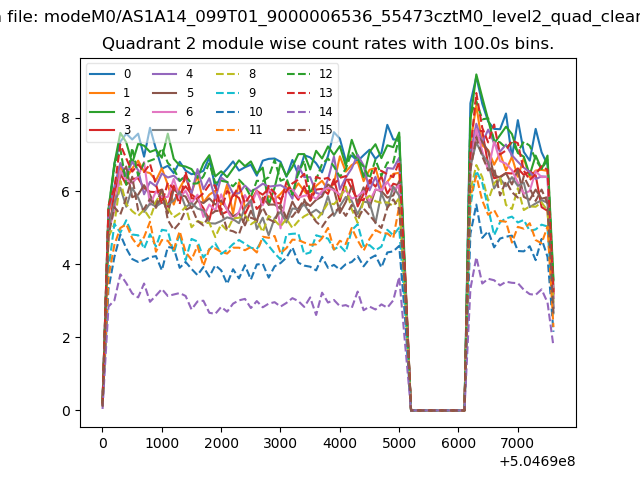
| Module-wise count rates for Quadrant B Data is divided into 100 sec bins |
 |
 |
| Module-wise count rates for Quadrant C Data is divided into 100 sec bins |
 |
 |
| Module-wise count rates for Quadrant D Data is divided into 100 sec bins |
 |
 |
| Parameter | Plot |
|---|---|
| CZT HV Monitor | 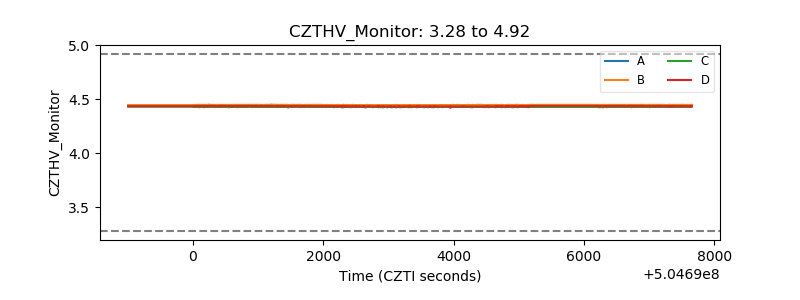 |
| D_VDD | 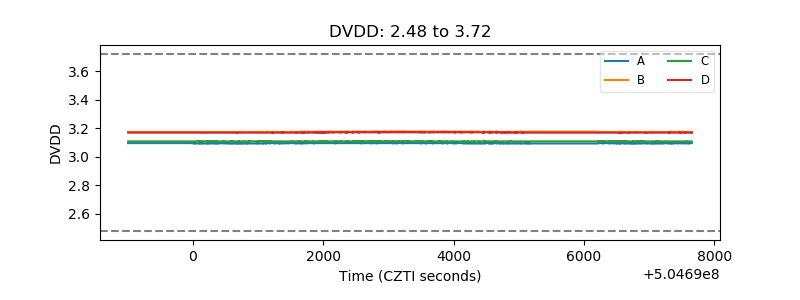 |
| Temperature 1 | 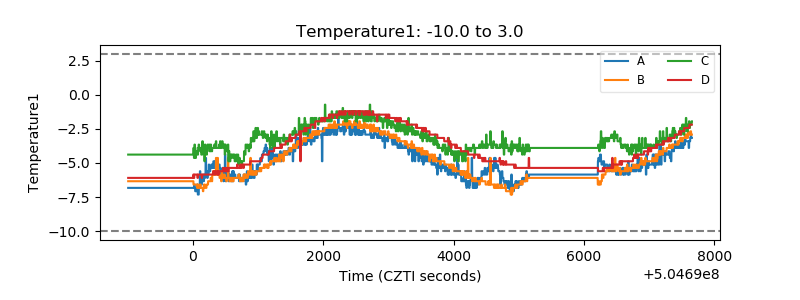 |
| Veto HV Monitor | 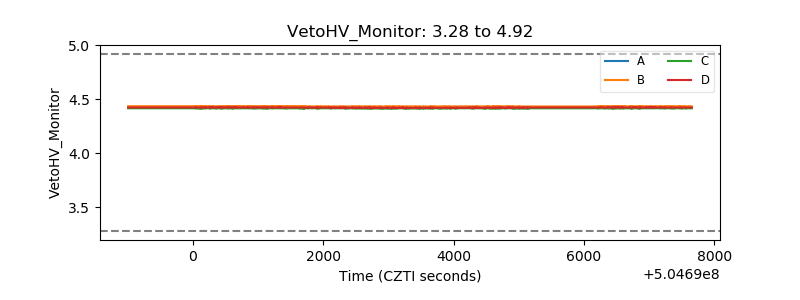 |
| Veto LLD | 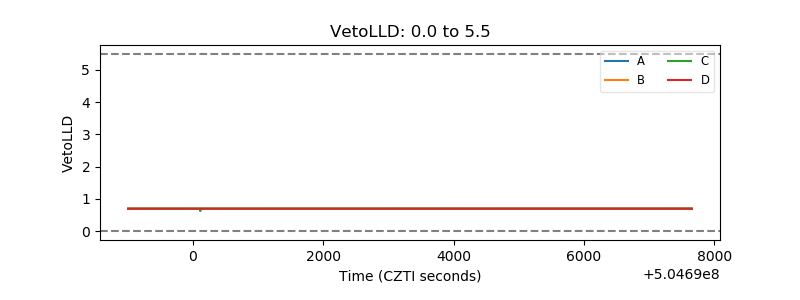 |
| Alpha Counter | 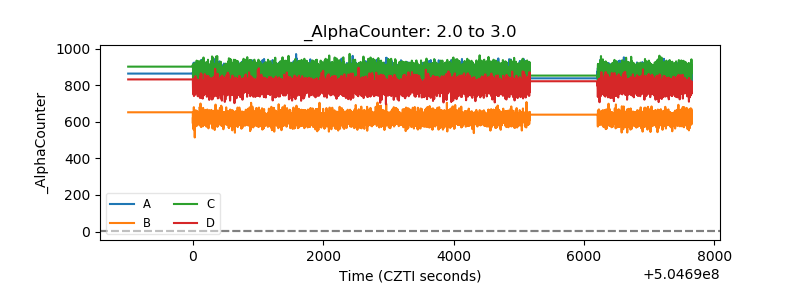 |
| _CPM_Rate | 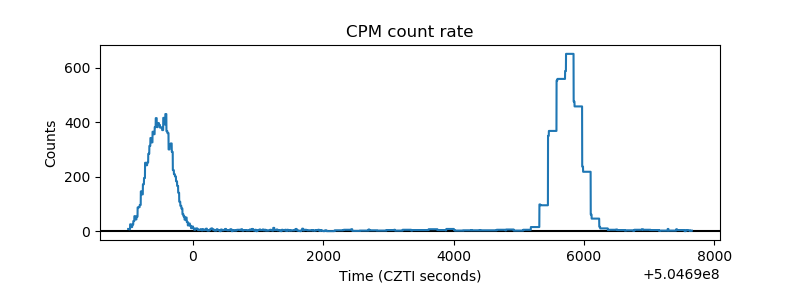 |
| CZT Counter | 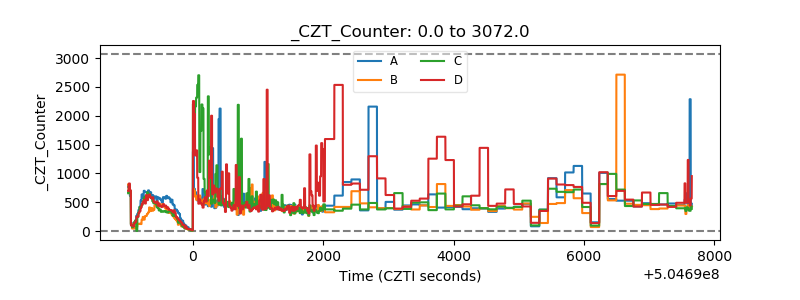 |
| +2.5 Volts monitor |  |
| +5 Volts monitor | 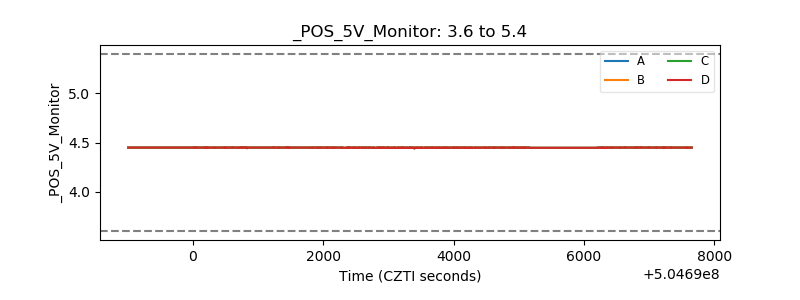 |
| _ROLL_ROT | 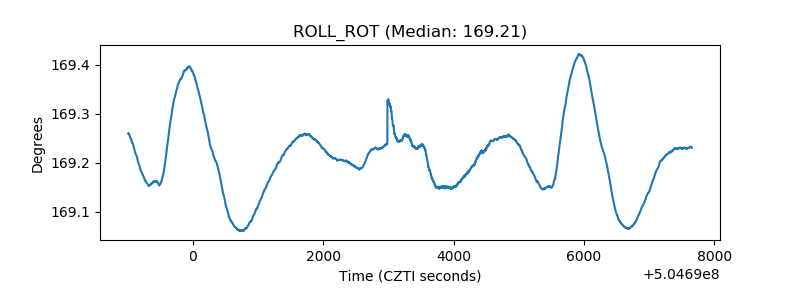 |
| _Roll_DEC | 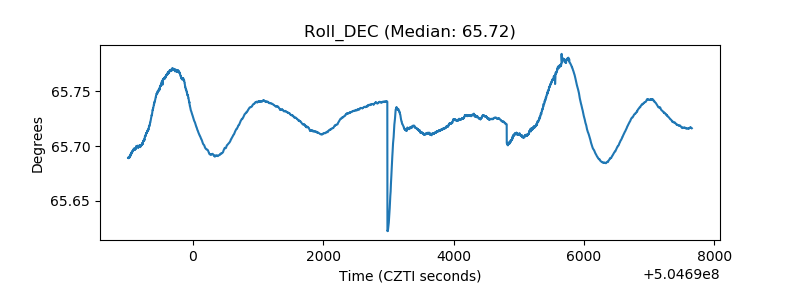 |
| _Roll_RA | 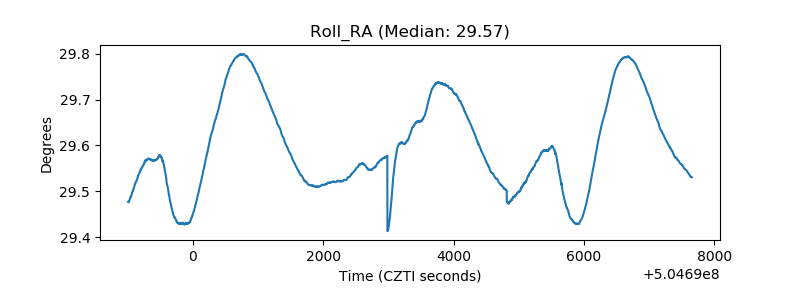 |
| Veto Counter | 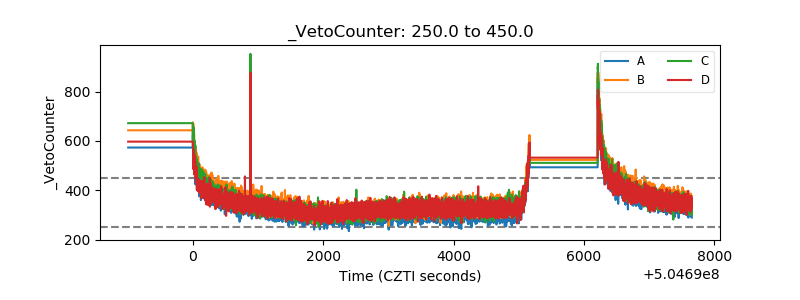 |