| Param | Original file | Final file |
|---|---|---|
| Filename | modeM0/AS1A14_099T01_9000006536_55474cztM0_level2.fits | modeM0/AS1A14_099T01_9000006536_55474cztM0_level2_quad_clean.evt |
| Size (bytes) | 447,099,840 | 96,906,240 |
| Size | 426.4 MB | 92.4 MB |
| Events in quadrant A | 3,862,006 | 640,987 |
| Events in quadrant B | 3,269,715 | 690,925 |
| Events in quadrant C | 4,277,456 | 593,737 |
| Events in quadrant D | 4,636,283 | 556,084 |
| Mode M9 | |||
|---|---|---|---|
| Quadrant | BADHDUFLAG | Total packets | Discarded packets |
| A | 0 | 16 | 0 |
| B | 0 | 16 | 1 |
| C | 0 | 16 | 0 |
| D | 0 | 17 | 2 |
| Mode SS | |||
|---|---|---|---|
| Quadrant | BADHDUFLAG | Total packets | Discarded packets |
| A | 0 | 132 | 0 |
| B | 0 | 132 | 0 |
| C | 0 | 132 | 0 |
| D | 0 | 132 | 0 |
| Mode M0 | |||
|---|---|---|---|
| Quadrant | BADHDUFLAG | Total packets | Discarded packets |
| A | 0 | 15950 | 5 |
| B | 0 | 14286 | 8 |
| C | 0 | 17423 | 12 |
| D | 0 | 18270 | 7 |
| Quadrant | Total seconds | Saturated seconds | Saturation percentage |
|---|---|---|---|
| A | 6490 | 278 | 4.283513% |
| B | 6489 | 177 | 2.727693% |
| C | 6489 | 343 | 5.285868% |
| D | 6490 | 437 | 6.733436% |
Noise dominated data is calculated using 1-second bins in cleaned event files. If a bin has >2000 counts, and if more than 50% of those come from <1% of pixels, then it is considered to be noise-dominated and hence unusable.
| Quadrant | # 1 sec bins | Bins with >0 counts | Bins with >2000 counts | High rate bins dominated by noise | Noise dominated (total time) | Noise dominated (detector-on time) | Marked lightcurve |
|---|---|---|---|---|---|---|---|
| A | 7641 | 6490 | 159 | 159 | 2.08% | 2.45% | 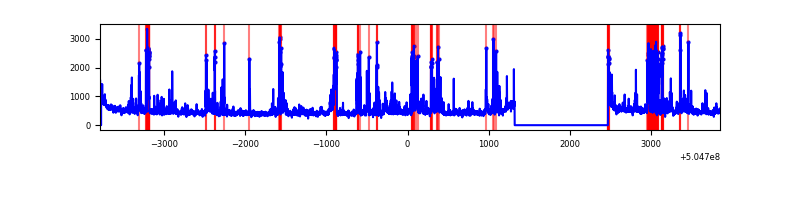 |
| B | 7641 | 6489 | 56 | 56 | 0.73% | 0.86% | 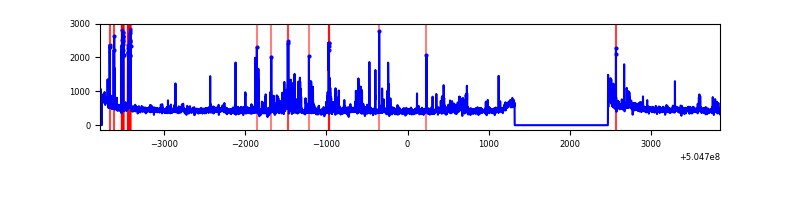 |
| C | 7641 | 6489 | 310 | 310 | 4.06% | 4.78% | 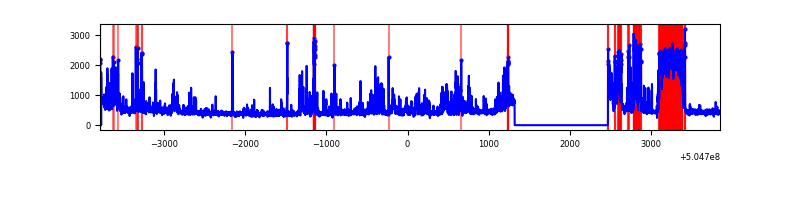 |
| D | 7641 | 6490 | 361 | 361 | 4.72% | 5.56% | 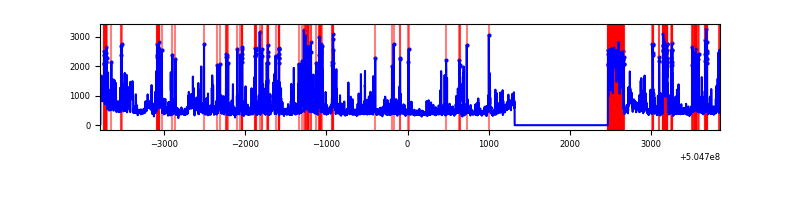 |
Top three noisy pixels from each quadrant. If the there are fewer than three noisy pixels in the level2.evt file, extra rows are filled as -1
| Pixel properties | Quadrant properties | ||||||
|---|---|---|---|---|---|---|---|
| Quadrant | DetID | PixID | Counts | Sigma | Mean | Median | Sigma |
| A | 0 | 8 | 541974 | 3064.56 | 716 | 698 | 176.6 |
| A | 3 | 78 | 361562 | 2043.11 | 716 | 698 | 176.6 |
| A | 6 | 179 | 48727 | 271.93 | 716 | 698 | 176.6 |
| B | 5 | 172 | 189062 | 1267.68 | 704 | 678 | 148.6 |
| B | 0 | 171 | 128977 | 863.35 | 704 | 678 | 148.6 |
| B | 0 | 199 | 39709 | 262.65 | 704 | 678 | 148.6 |
| C | 9 | 38 | 1289233 | 6901.52 | 683 | 676 | 186.7 |
| C | 13 | 3 | 152673 | 814.1 | 683 | 676 | 186.7 |
| C | 12 | 2 | 64452 | 341.58 | 683 | 676 | 186.7 |
| D | 11 | 129 | 1112720 | 5774.92 | 682 | 651 | 192.6 |
| D | 9 | 102 | 338013 | 1751.91 | 682 | 651 | 192.6 |
| D | 2 | 249 | 133003 | 687.3 | 682 | 651 | 192.6 |
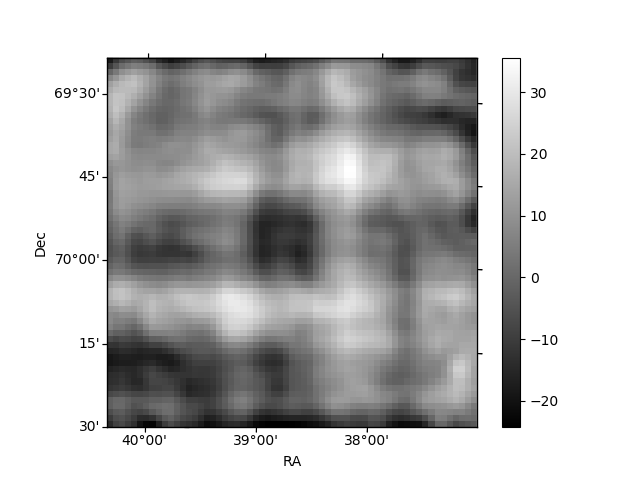
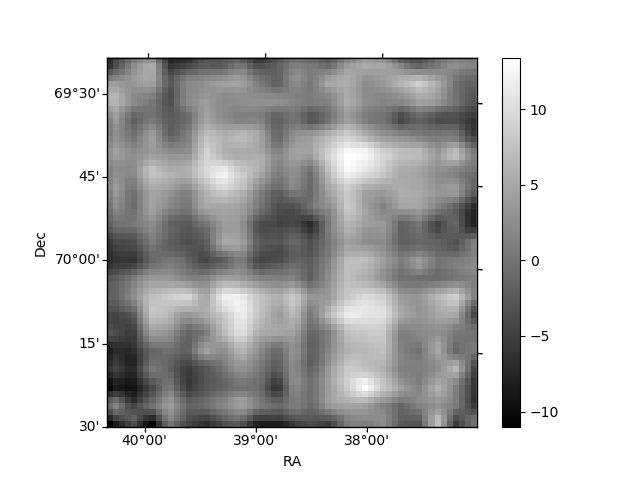
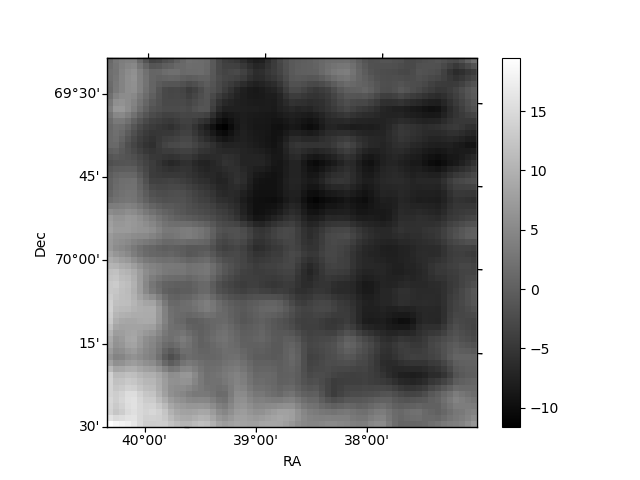
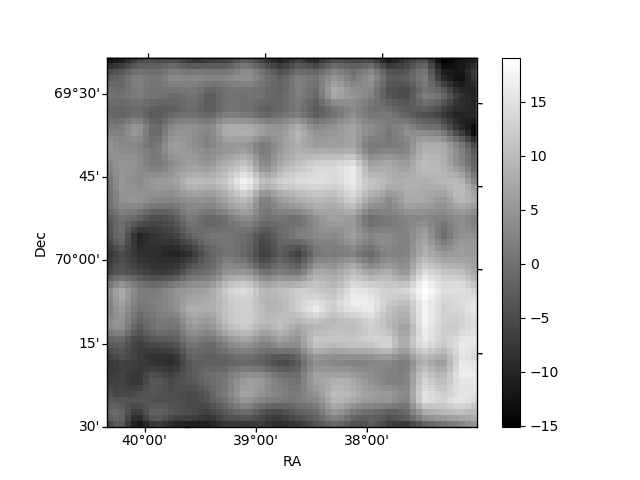
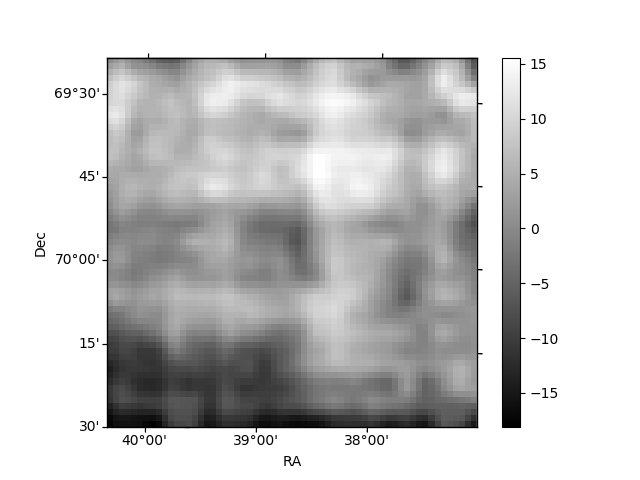
Histogram calculated using DETX and DETY for each event in the final _common_clean file
| Quadrant A | 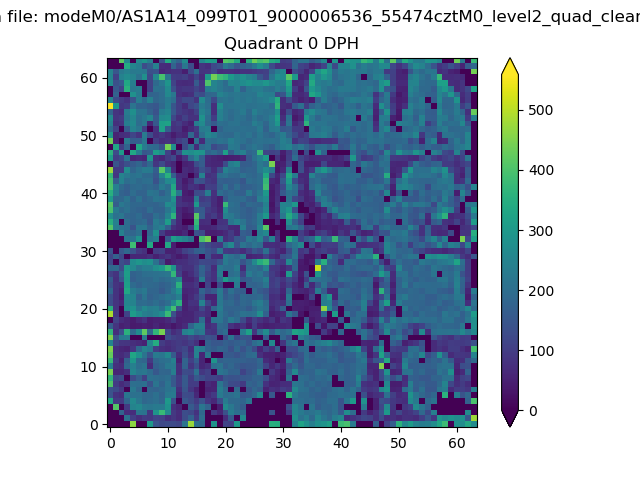 |
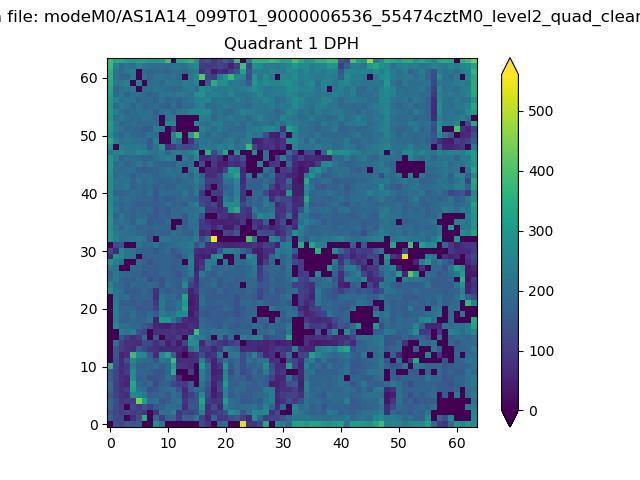 |
Quadrant B |
|---|---|---|---|
| Quadrant D | 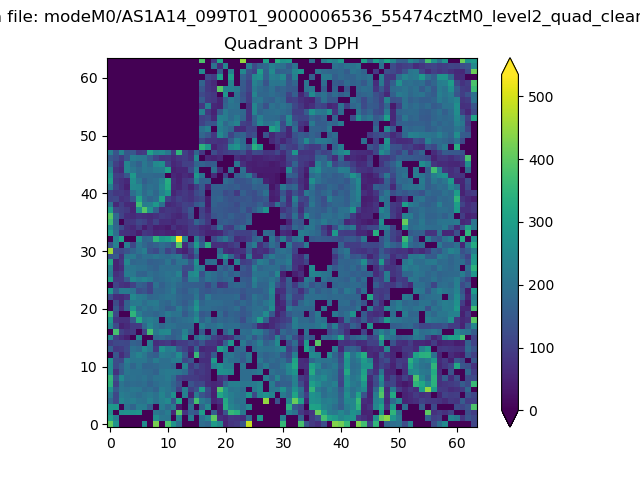 |
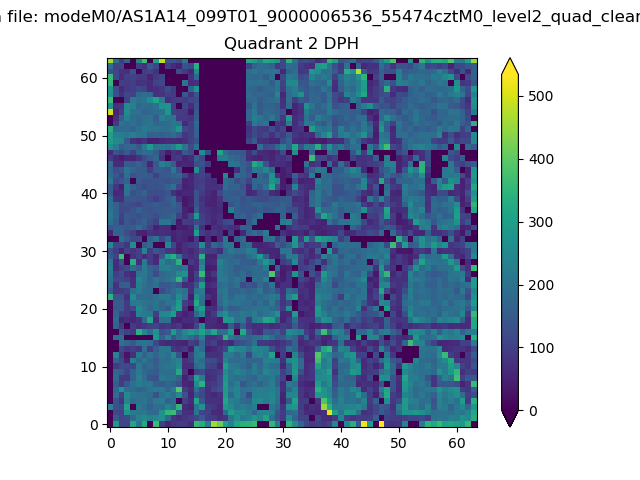 |
Quadrant C |
| Plot type | Count rate plots | Images |
|---|---|---|
| Comparison with Poisson distribution Blue bars denote a histogram of data divided into 1 sec bins. Red curve is a Poisson curve with rate = median count rate of data. |
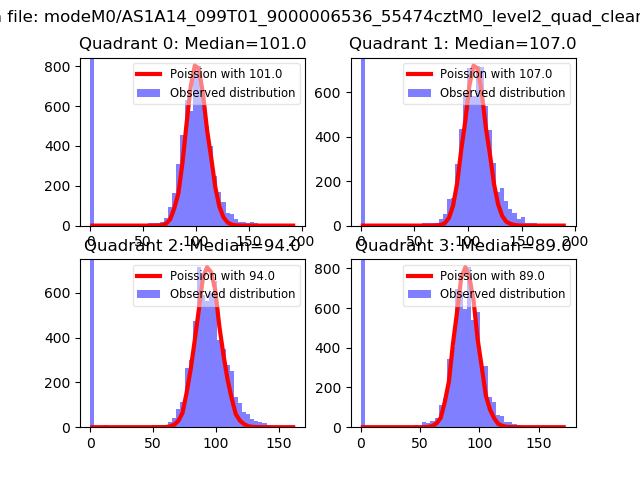 |
 |
| Quadrant-wise count rates Data is divided into 100 sec bins |
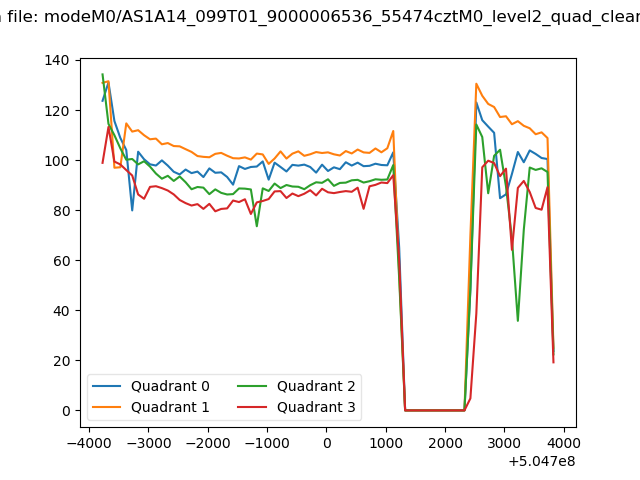 |
|
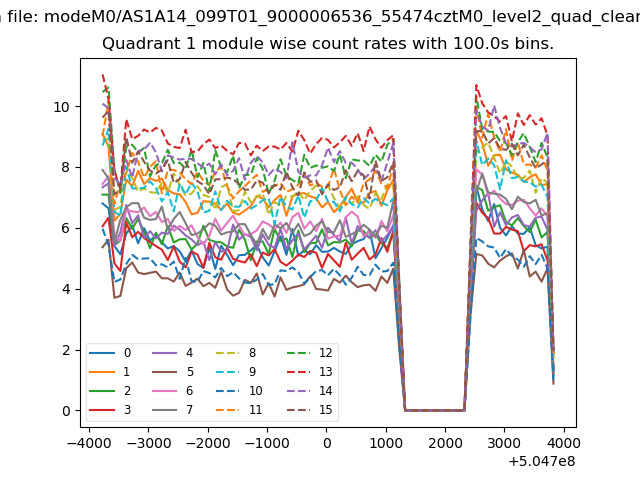
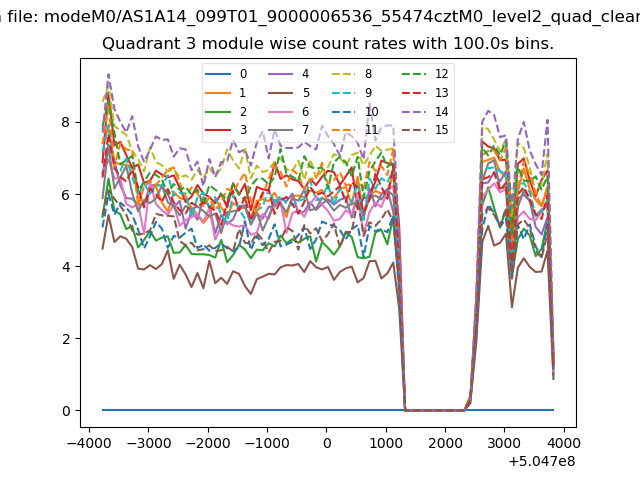
| Module-wise count rates for Quadrant A Data is divided into 100 sec bins |
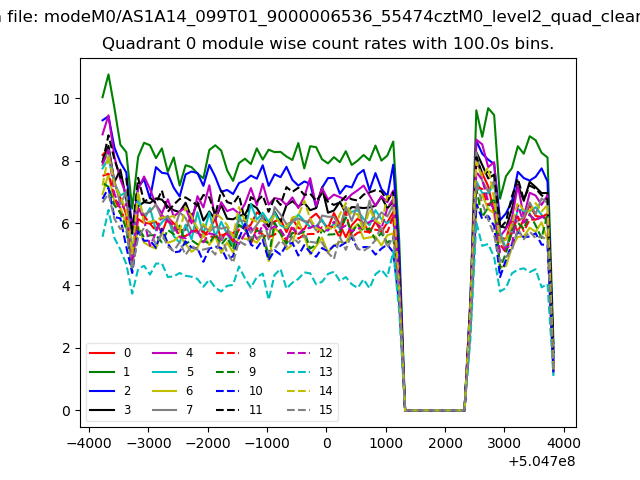 |
 |
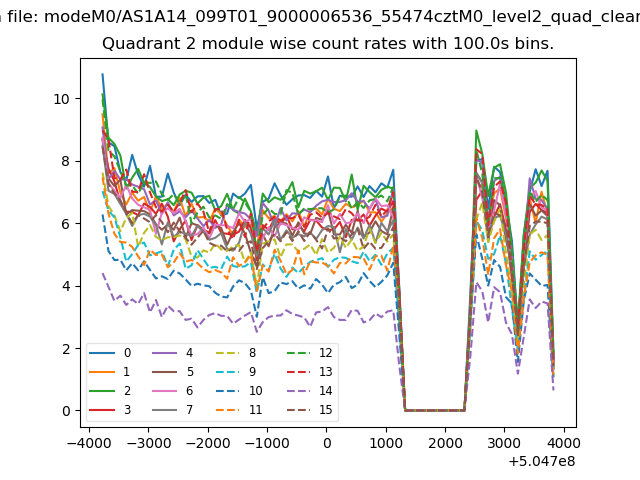
| Module-wise count rates for Quadrant B Data is divided into 100 sec bins |
 |
 |
| Module-wise count rates for Quadrant C Data is divided into 100 sec bins |
 |
 |
| Module-wise count rates for Quadrant D Data is divided into 100 sec bins |
 |
 |
| Parameter | Plot |
|---|---|
| CZT HV Monitor | 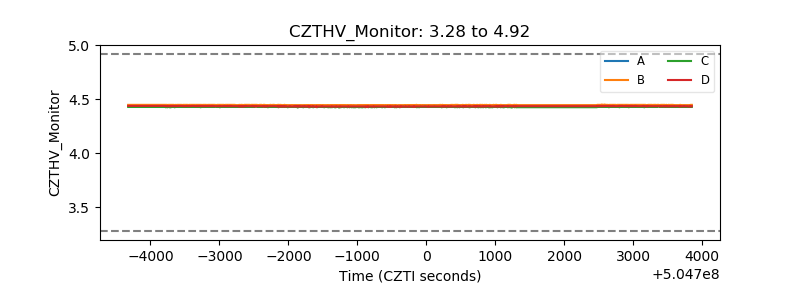 |
| D_VDD | 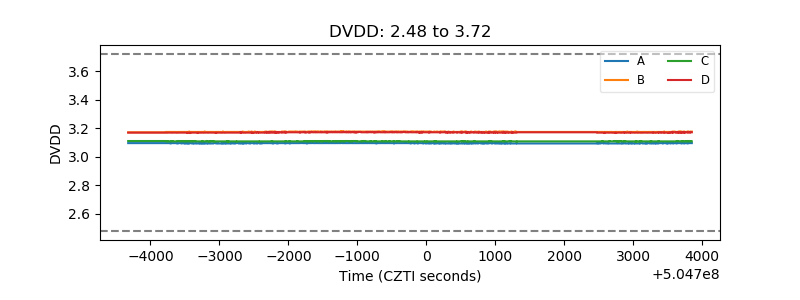 |
| Temperature 1 | 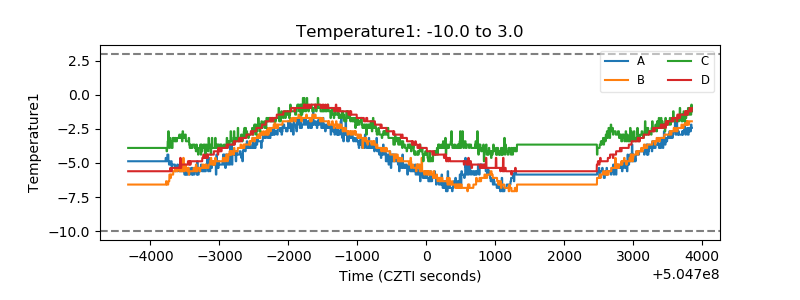 |
| Veto HV Monitor | 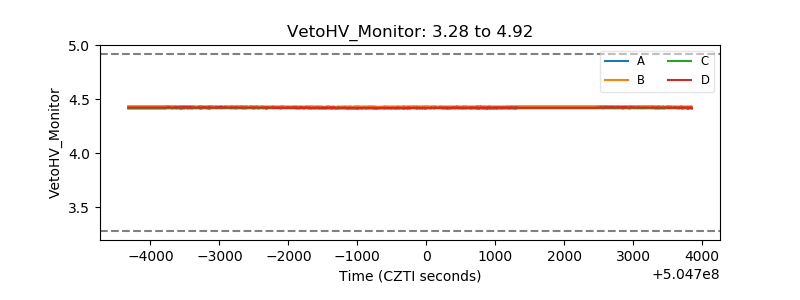 |
| Veto LLD | 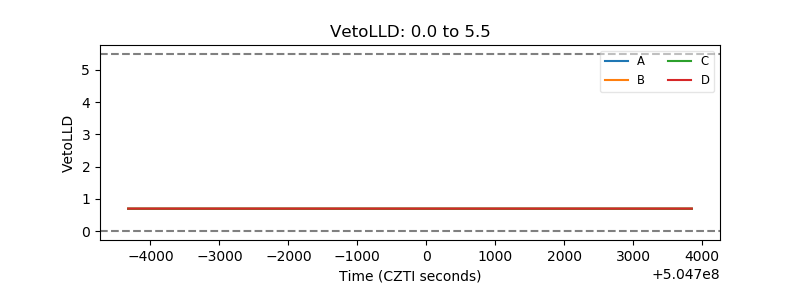 |
| Alpha Counter | 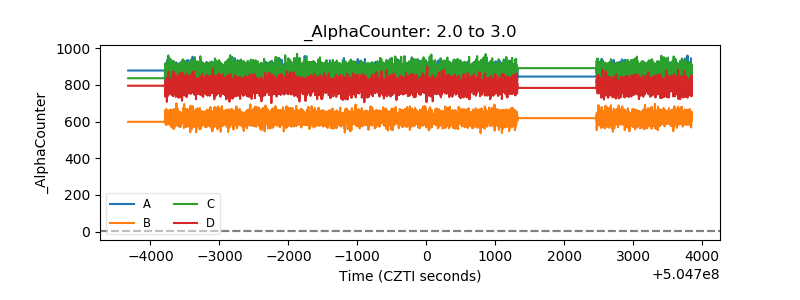 |
| _CPM_Rate | 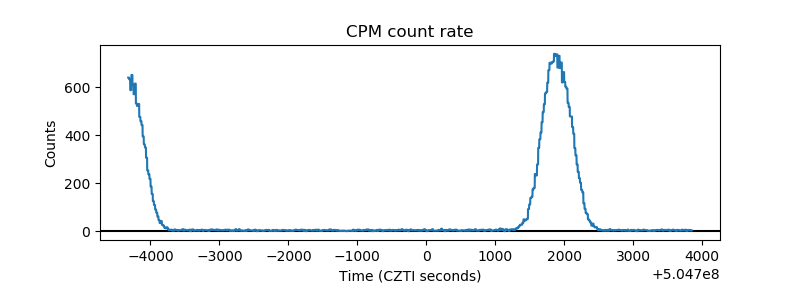 |
| CZT Counter | 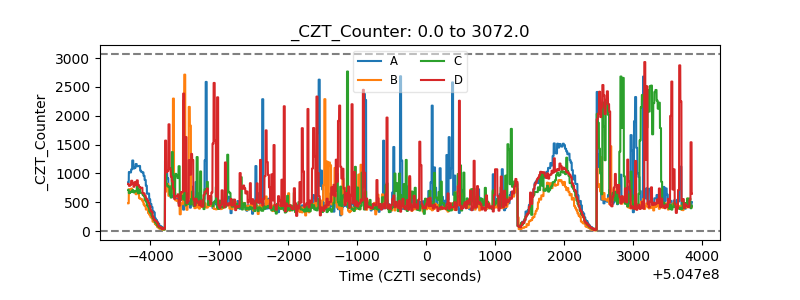 |
| +2.5 Volts monitor |  |
| +5 Volts monitor | 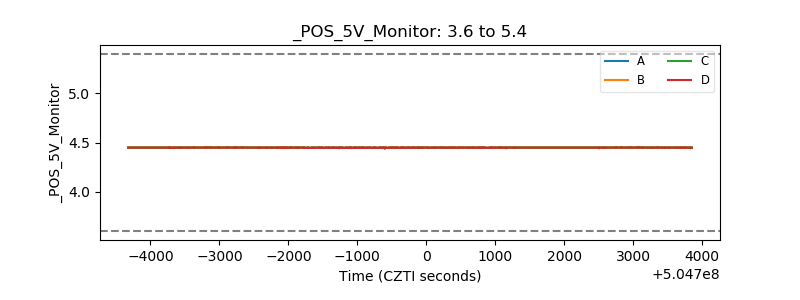 |
| _ROLL_ROT | 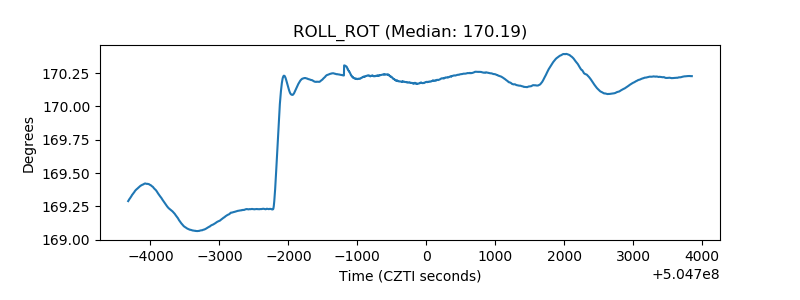 |
| _Roll_DEC | 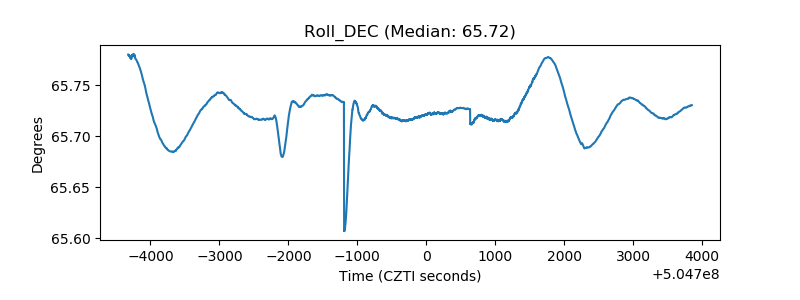 |
| _Roll_RA | 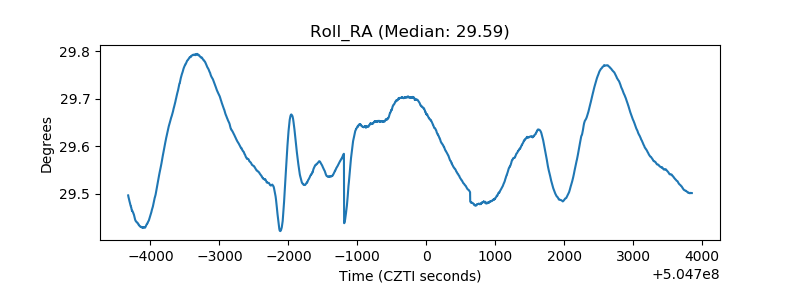 |
| Veto Counter | 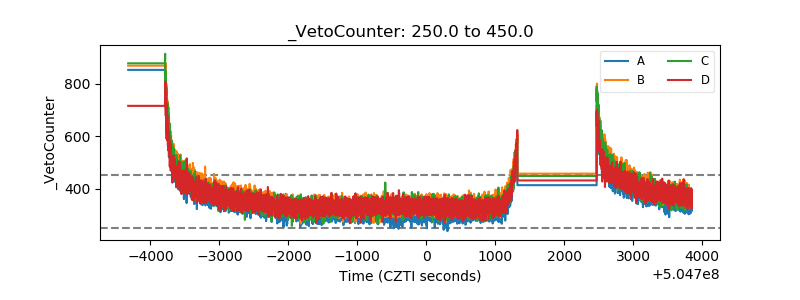 |