| Param | Original file | Final file |
|---|---|---|
| Filename | modeM0/AS1A14_099T01_9000006536_55476cztM0_level2.fits | modeM0/AS1A14_099T01_9000006536_55476cztM0_level2_quad_clean.evt |
| Size (bytes) | 456,687,360 | 89,542,080 |
| Size | 435.5 MB | 85.4 MB |
| Events in quadrant A | 3,335,283 | 601,533 |
| Events in quadrant B | 2,975,359 | 637,953 |
| Events in quadrant C | 4,065,007 | 559,216 |
| Events in quadrant D | 6,058,164 | 489,528 |
| Mode M9 | |||
|---|---|---|---|
| Quadrant | BADHDUFLAG | Total packets | Discarded packets |
| A | 0 | 12 | 0 |
| B | 0 | 12 | 0 |
| C | 0 | 12 | 0 |
| D | 0 | 12 | 0 |
| Mode SS | |||
|---|---|---|---|
| Quadrant | BADHDUFLAG | Total packets | Discarded packets |
| A | 0 | 122 | 0 |
| B | 0 | 122 | 0 |
| C | 0 | 122 | 0 |
| D | 0 | 122 | 0 |
| Mode M0 | |||
|---|---|---|---|
| Quadrant | BADHDUFLAG | Total packets | Discarded packets |
| A | 0 | 13933 | 1 |
| B | 0 | 13184 | 1 |
| C | 0 | 16250 | 1 |
| D | 0 | 22231 | 2 |
| Quadrant | Total seconds | Saturated seconds | Saturation percentage |
|---|---|---|---|
| A | 6064 | 130 | 2.143799% |
| B | 6064 | 127 | 2.094327% |
| C | 6064 | 149 | 2.457124% |
| D | 6063 | 788 | 12.996866% |
Noise dominated data is calculated using 1-second bins in cleaned event files. If a bin has >2000 counts, and if more than 50% of those come from <1% of pixels, then it is considered to be noise-dominated and hence unusable.
| Quadrant | # 1 sec bins | Bins with >0 counts | Bins with >2000 counts | High rate bins dominated by noise | Noise dominated (total time) | Noise dominated (detector-on time) | Marked lightcurve |
|---|---|---|---|---|---|---|---|
| A | 7174 | 6064 | 42 | 42 | 0.59% | 0.69% | 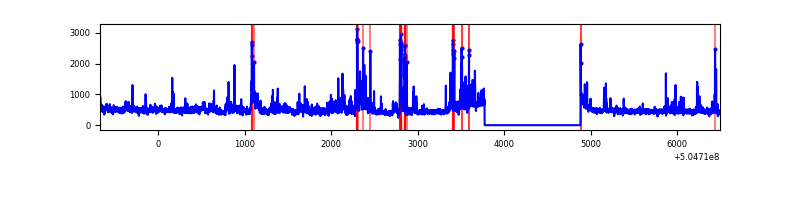 |
| B | 7174 | 6064 | 32 | 32 | 0.45% | 0.53% | 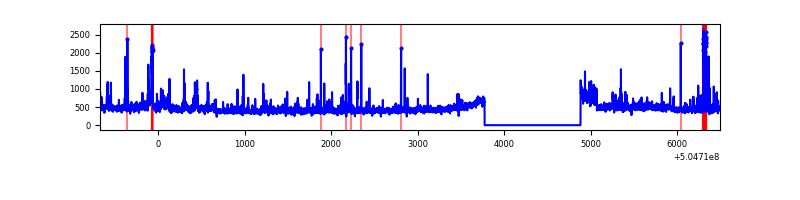 |
| C | 7174 | 6065 | 80 | 80 | 1.12% | 1.32% | 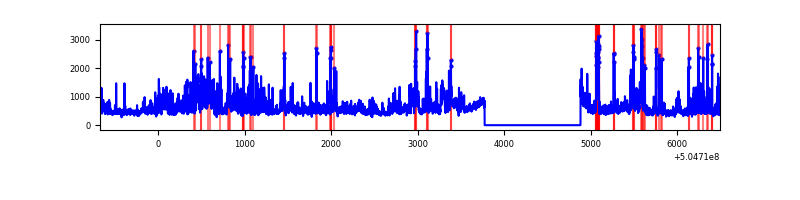 |
| D | 7173 | 6063 | 678 | 678 | 9.45% | 11.18% | 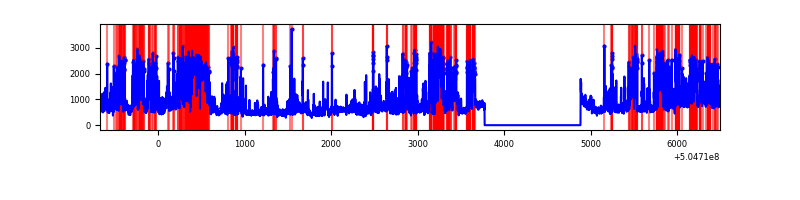 |
Top three noisy pixels from each quadrant. If the there are fewer than three noisy pixels in the level2.evt file, extra rows are filled as -1
| Pixel properties | Quadrant properties | ||||||
|---|---|---|---|---|---|---|---|
| Quadrant | DetID | PixID | Counts | Sigma | Mean | Median | Sigma |
| A | 3 | 78 | 336591 | 2054.72 | 654 | 639 | 163.5 |
| A | 3 | 14 | 186752 | 1138.29 | 654 | 639 | 163.5 |
| A | 0 | 8 | 135218 | 823.1 | 654 | 639 | 163.5 |
| B | 5 | 172 | 171827 | 1254.58 | 641 | 617 | 136.5 |
| B | 0 | 171 | 110625 | 806.11 | 641 | 617 | 136.5 |
| B | 10 | 247 | 89345 | 650.18 | 641 | 617 | 136.5 |
| C | 9 | 38 | 959173 | 5565.42 | 632 | 624 | 172.2 |
| C | 13 | 3 | 401461 | 2327.29 | 632 | 624 | 172.2 |
| C | 1 | 16 | 105263 | 607.54 | 632 | 624 | 172.2 |
| D | 11 | 129 | 2470357 | 14300.39 | 608 | 580 | 172.7 |
| D | 5 | 113 | 635169 | 3674.37 | 608 | 580 | 172.7 |
| D | 8 | 160 | 221745 | 1280.58 | 608 | 580 | 172.7 |
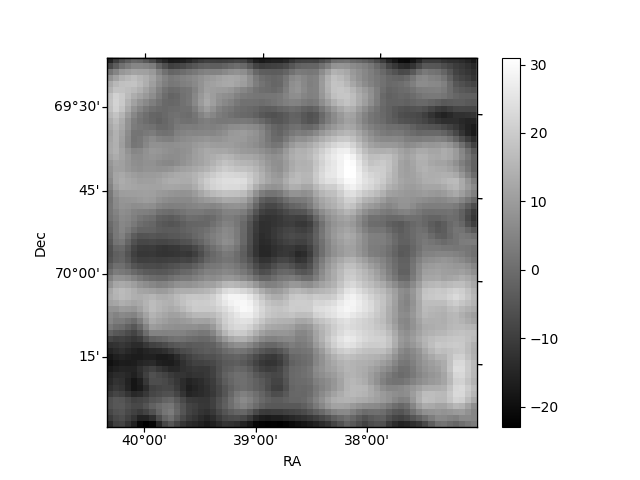
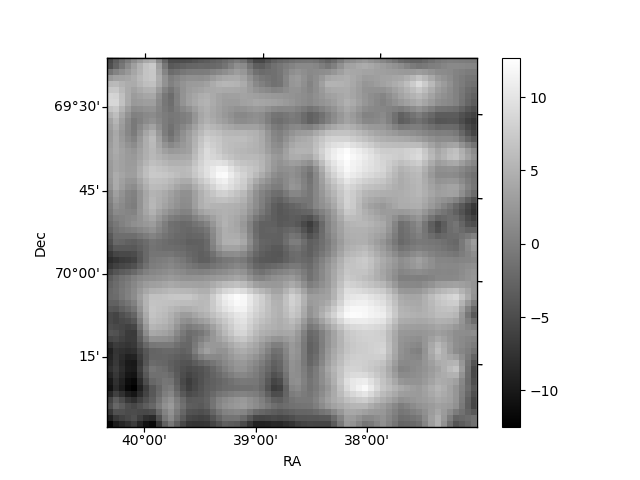
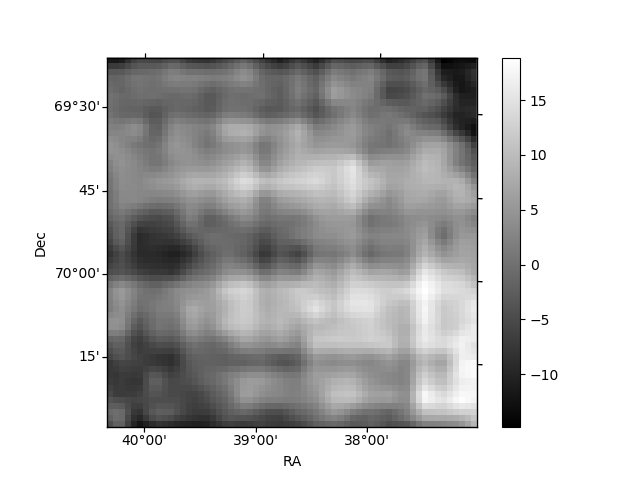
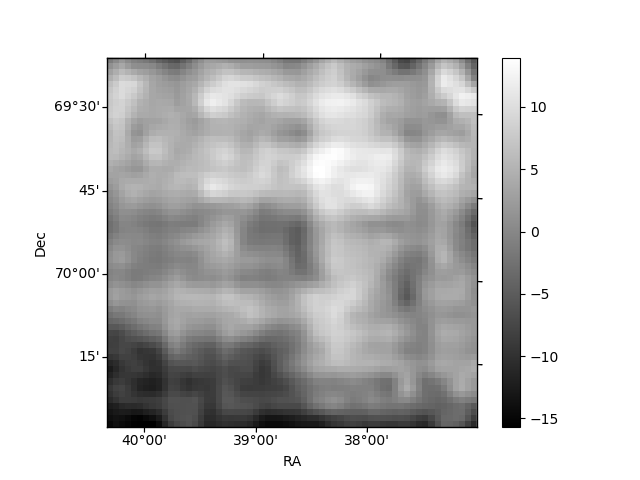
Histogram calculated using DETX and DETY for each event in the final _common_clean file
| Quadrant A | 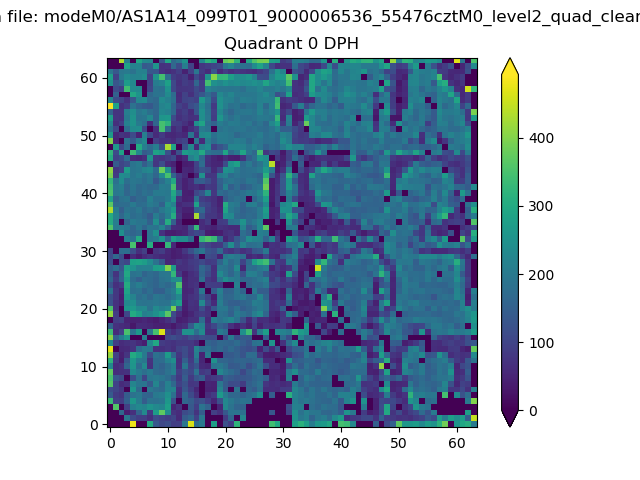 |
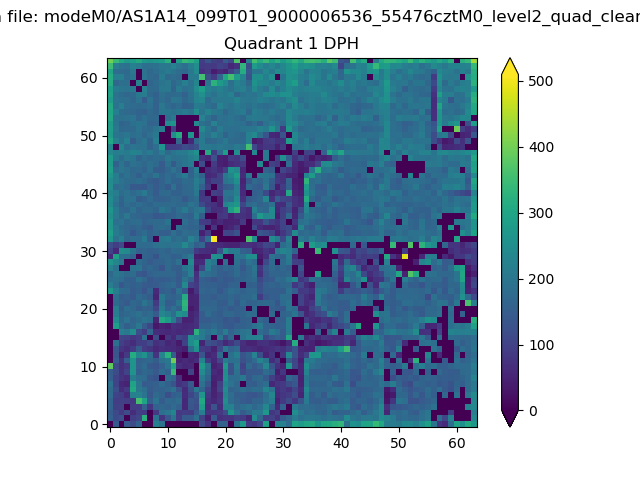 |
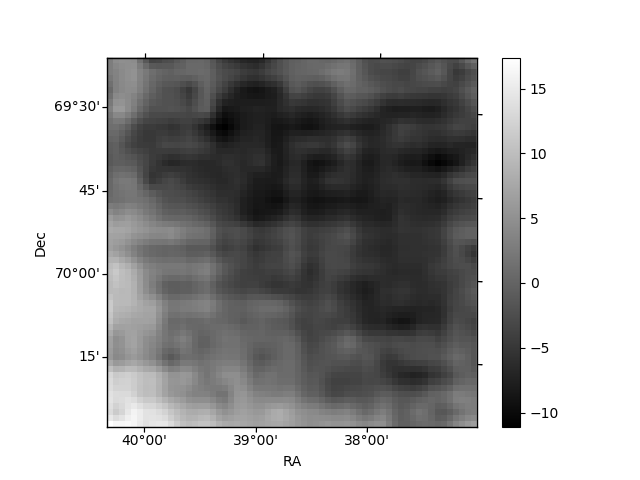
Quadrant B |
|---|---|---|---|
| Quadrant D | 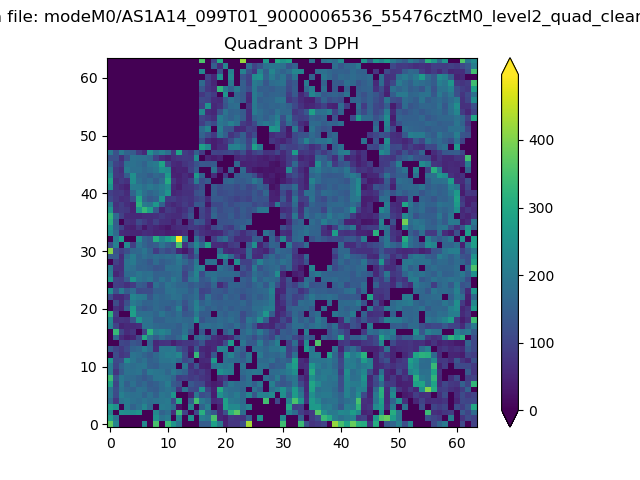 |
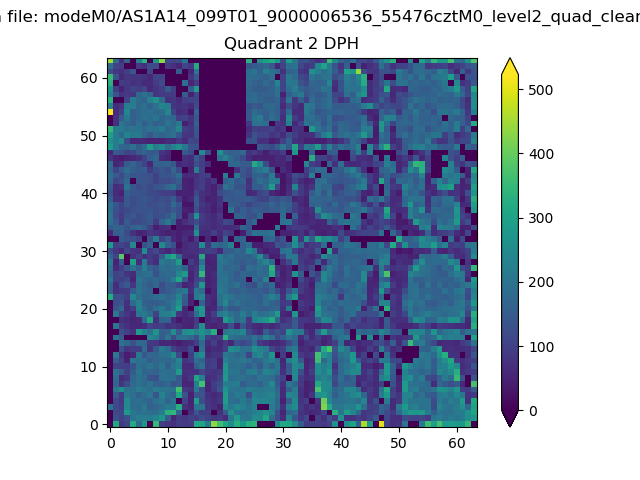 |
Quadrant C |
| Plot type | Count rate plots | Images |
|---|---|---|
| Comparison with Poisson distribution Blue bars denote a histogram of data divided into 1 sec bins. Red curve is a Poisson curve with rate = median count rate of data. |
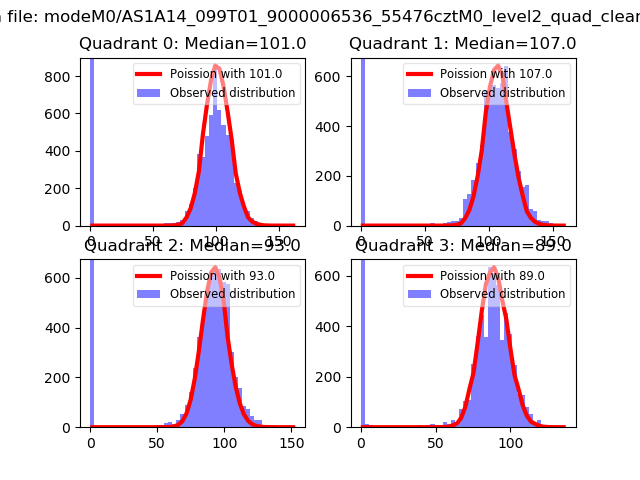 |
 |
| Quadrant-wise count rates Data is divided into 100 sec bins |
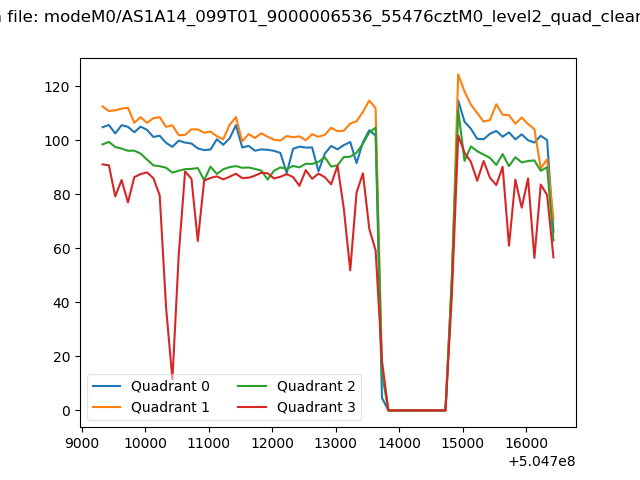 |
|
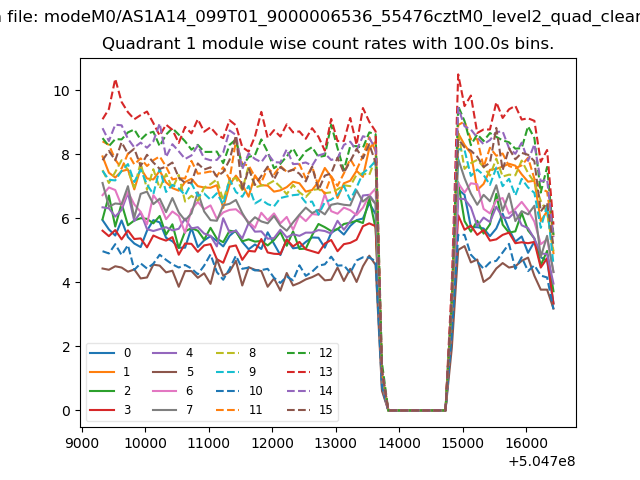
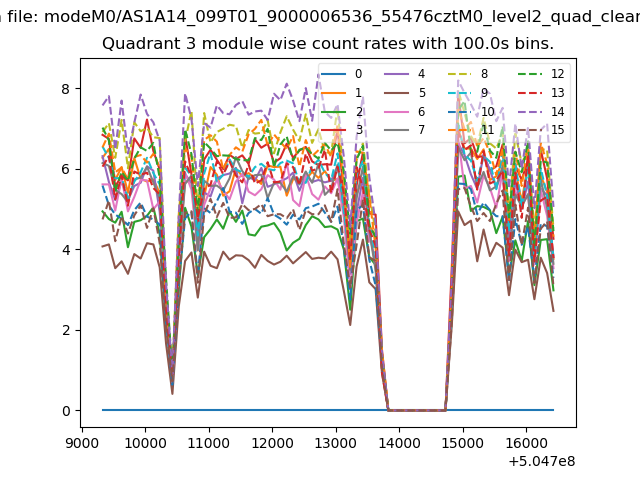
| Module-wise count rates for Quadrant A Data is divided into 100 sec bins |
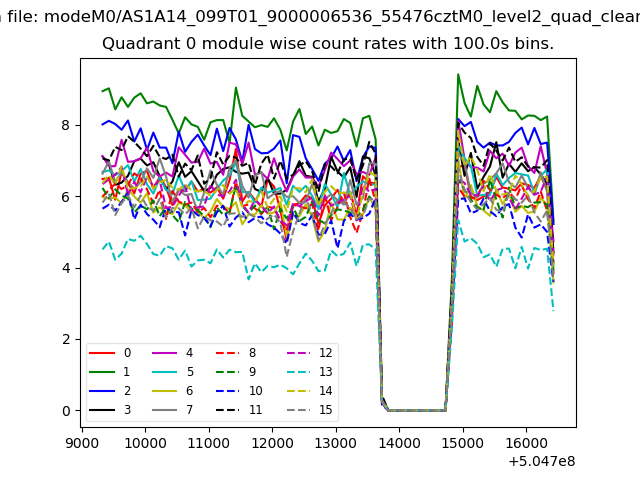 |
 |
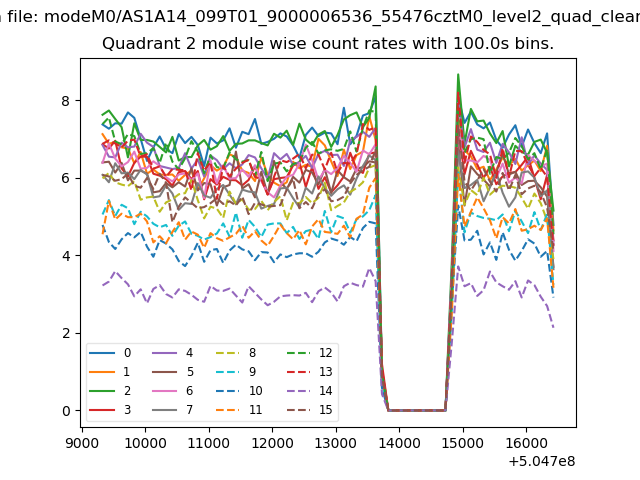
| Module-wise count rates for Quadrant B Data is divided into 100 sec bins |
 |
 |
| Module-wise count rates for Quadrant C Data is divided into 100 sec bins |
 |
 |
| Module-wise count rates for Quadrant D Data is divided into 100 sec bins |
 |
 |
| Parameter | Plot |
|---|---|
| CZT HV Monitor | 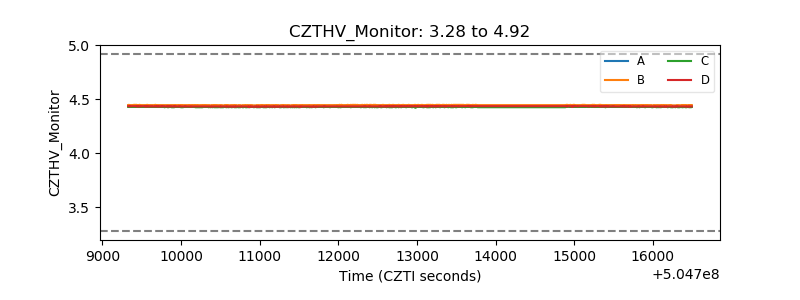 |
| D_VDD | 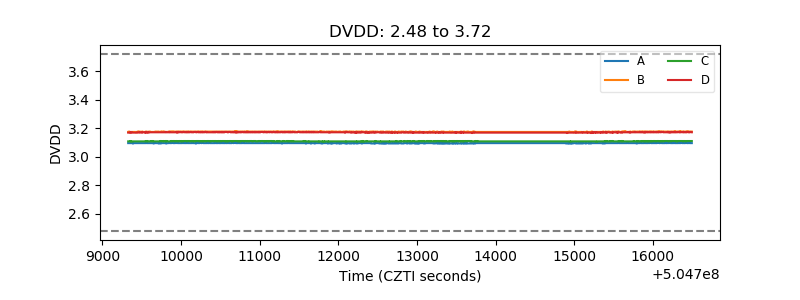 |
| Temperature 1 | 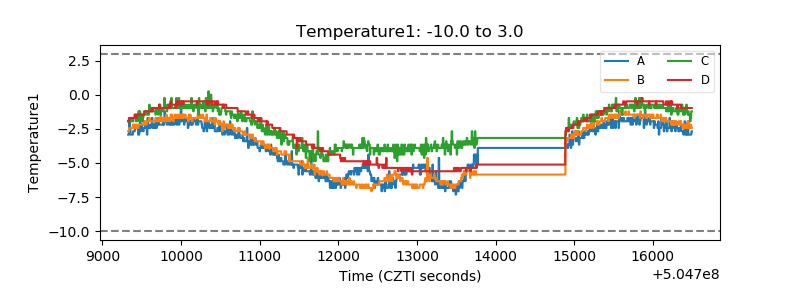 |
| Veto HV Monitor | 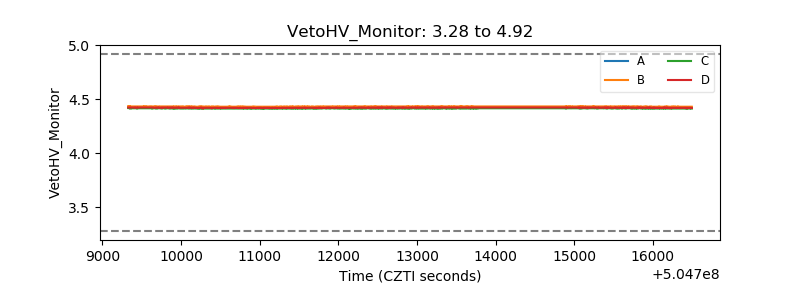 |
| Veto LLD | 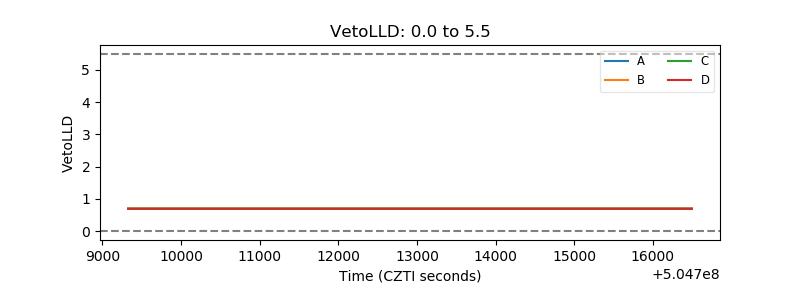 |
| Alpha Counter | 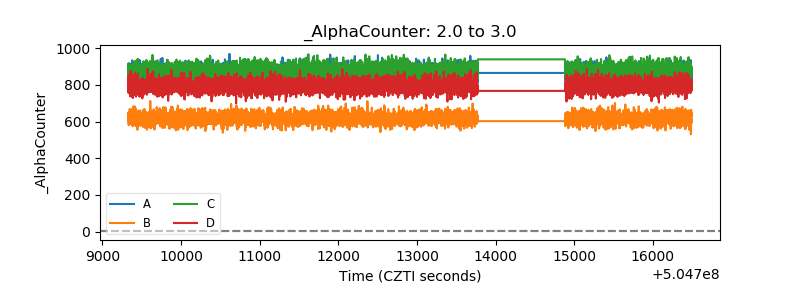 |
| _CPM_Rate | 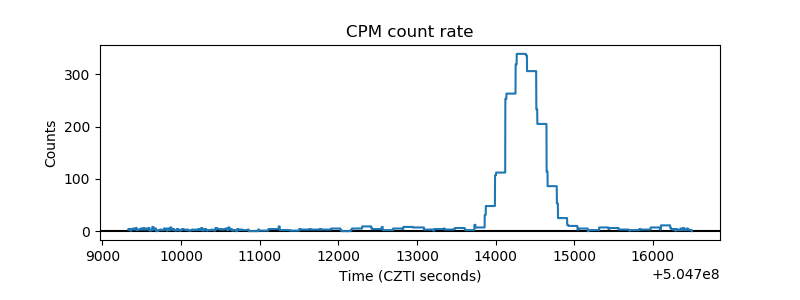 |
| CZT Counter | 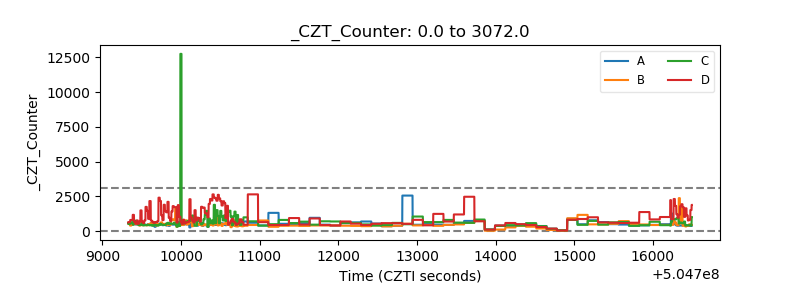 |
| +2.5 Volts monitor | 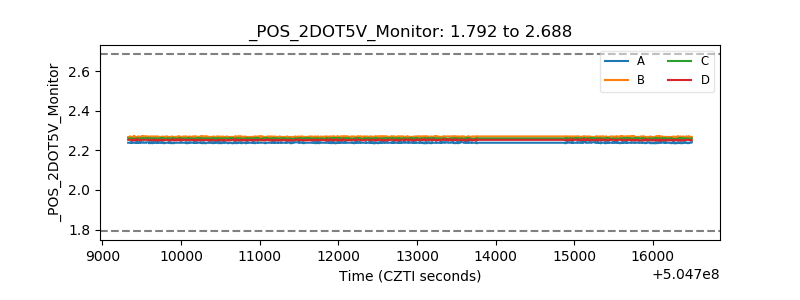 |
| +5 Volts monitor | 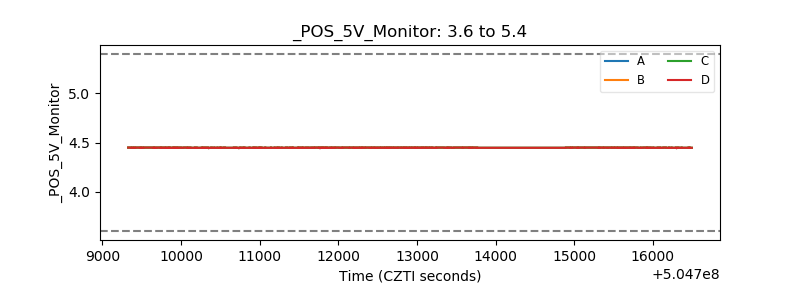 |
| _ROLL_ROT | 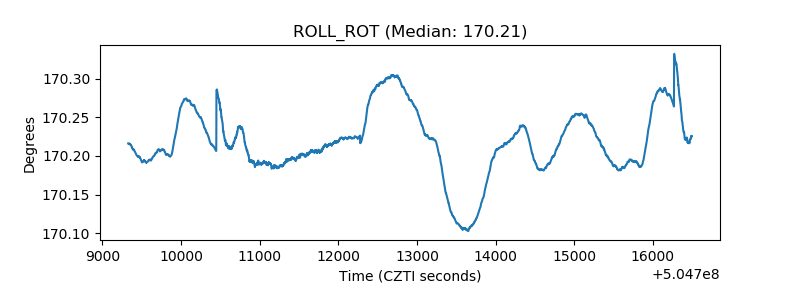 |
| _Roll_DEC | 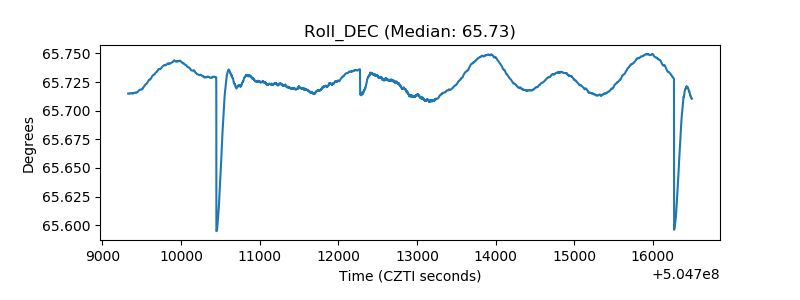 |
| _Roll_RA | 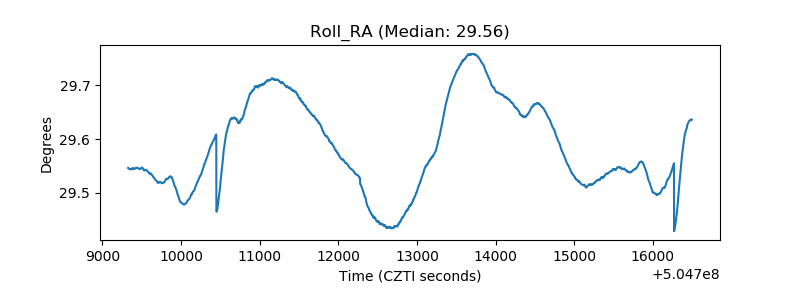 |
| Veto Counter | 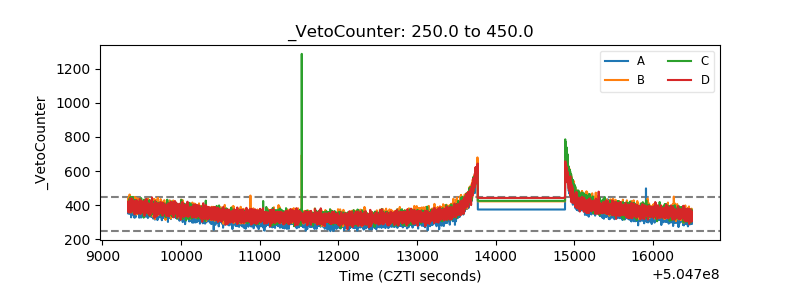 |