| Param | Original file | Final file |
|---|---|---|
| Filename | modeM0/AS1A14_099T01_9000006536_55477cztM0_level2.fits | modeM0/AS1A14_099T01_9000006536_55477cztM0_level2_quad_clean.evt |
| Size (bytes) | 485,605,440 | 91,330,560 |
| Size | 463.1 MB | 87.1 MB |
| Events in quadrant A | 3,320,739 | 612,450 |
| Events in quadrant B | 3,427,500 | 643,212 |
| Events in quadrant C | 4,383,042 | 555,145 |
| Events in quadrant D | 6,350,792 | 511,341 |
| Mode M9 | |||
|---|---|---|---|
| Quadrant | BADHDUFLAG | Total packets | Discarded packets |
| A | 0 | 10 | 0 |
| B | 0 | 10 | 0 |
| C | 0 | 10 | 0 |
| D | 0 | 10 | 0 |
| Mode SS | |||
|---|---|---|---|
| Quadrant | BADHDUFLAG | Total packets | Discarded packets |
| A | 0 | 128 | 0 |
| B | 0 | 128 | 0 |
| C | 0 | 128 | 0 |
| D | 0 | 128 | 0 |
| Mode M0 | |||
|---|---|---|---|
| Quadrant | BADHDUFLAG | Total packets | Discarded packets |
| A | 0 | 14469 | 1 |
| B | 0 | 14815 | 1 |
| C | 0 | 17782 | 7 |
| D | 0 | 23253 | 1 |
| Quadrant | Total seconds | Saturated seconds | Saturation percentage |
|---|---|---|---|
| A | 6353 | 144 | 2.266646% |
| B | 6353 | 231 | 3.636077% |
| C | 6353 | 411 | 6.469385% |
| D | 6353 | 663 | 10.436014% |
Noise dominated data is calculated using 1-second bins in cleaned event files. If a bin has >2000 counts, and if more than 50% of those come from <1% of pixels, then it is considered to be noise-dominated and hence unusable.
| Quadrant | # 1 sec bins | Bins with >0 counts | Bins with >2000 counts | High rate bins dominated by noise | Noise dominated (total time) | Noise dominated (detector-on time) | Marked lightcurve |
|---|---|---|---|---|---|---|---|
| A | 7308 | 6353 | 63 | 63 | 0.86% | 0.99% | 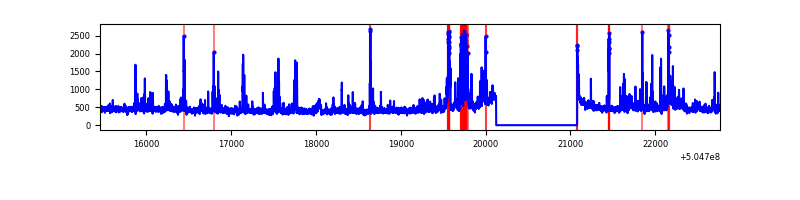 |
| B | 7308 | 6353 | 149 | 149 | 2.04% | 2.35% | 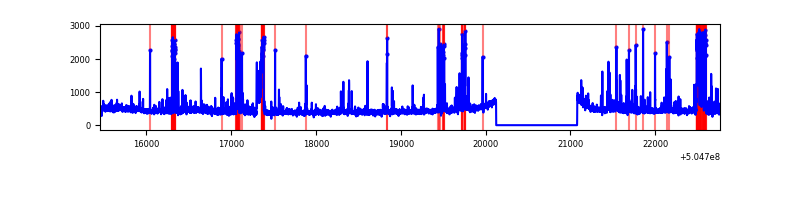 |
| C | 7309 | 6354 | 346 | 346 | 4.73% | 5.45% | 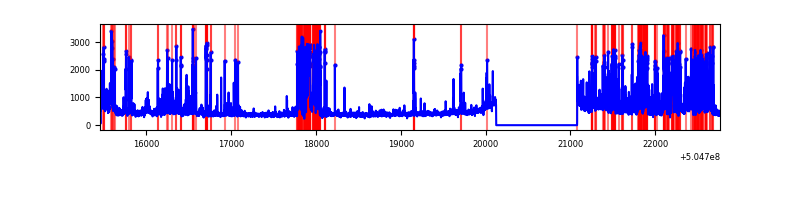 |
| D | 7307 | 6352 | 572 | 572 | 7.83% | 9.01% | 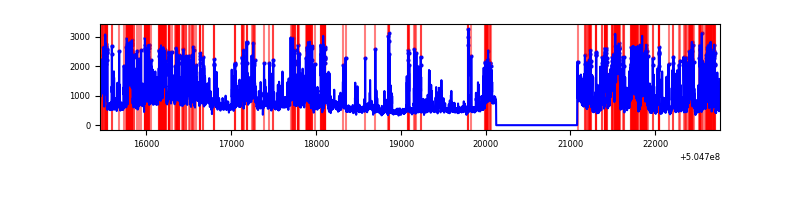 |
Top three noisy pixels from each quadrant. If the there are fewer than three noisy pixels in the level2.evt file, extra rows are filled as -1
| Pixel properties | Quadrant properties | ||||||
|---|---|---|---|---|---|---|---|
| Quadrant | DetID | PixID | Counts | Sigma | Mean | Median | Sigma |
| A | 3 | 78 | 289139 | 1727.61 | 672 | 652 | 167.0 |
| A | 0 | 8 | 144377 | 860.7 | 672 | 652 | 167.0 |
| A | 12 | 115 | 59370 | 351.63 | 672 | 652 | 167.0 |
| B | 0 | 171 | 234023 | 1659.28 | 657 | 632 | 140.7 |
| B | 5 | 248 | 172893 | 1224.68 | 657 | 632 | 140.7 |
| B | 10 | 247 | 138079 | 977.17 | 657 | 632 | 140.7 |
| C | 13 | 3 | 1160062 | 6607.59 | 639 | 632 | 175.5 |
| C | 9 | 38 | 597569 | 3401.94 | 639 | 632 | 175.5 |
| C | 12 | 252 | 35031 | 196.04 | 639 | 632 | 175.5 |
| D | 11 | 129 | 2341020 | 12989.66 | 634 | 604 | 180.2 |
| D | 5 | 113 | 854621 | 4739.92 | 634 | 604 | 180.2 |
| D | 8 | 160 | 324529 | 1797.83 | 634 | 604 | 180.2 |
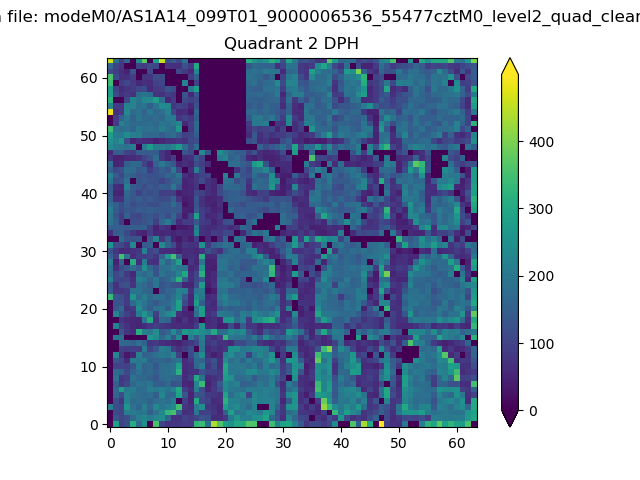
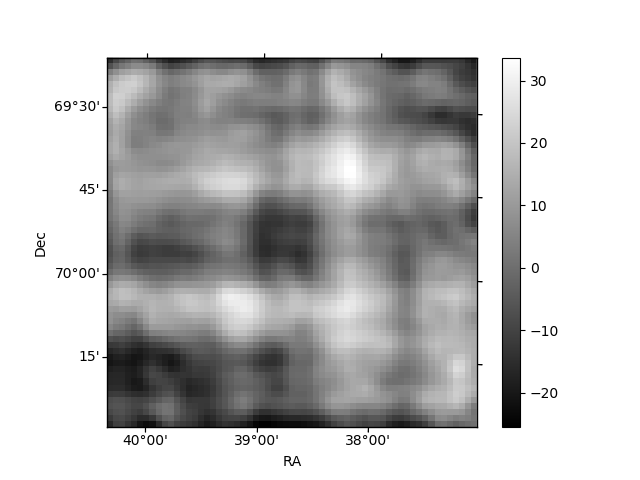
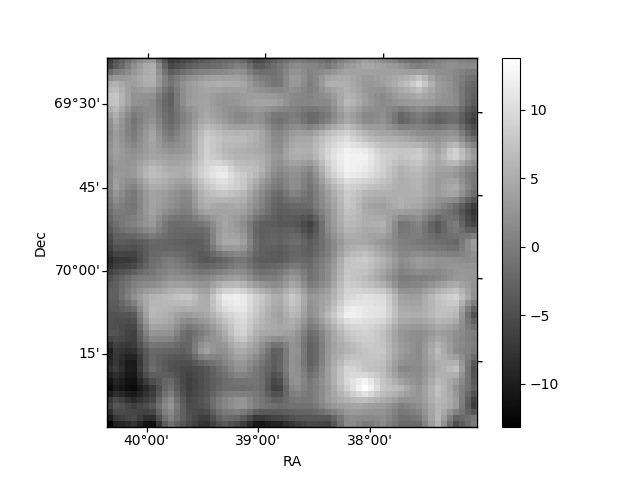
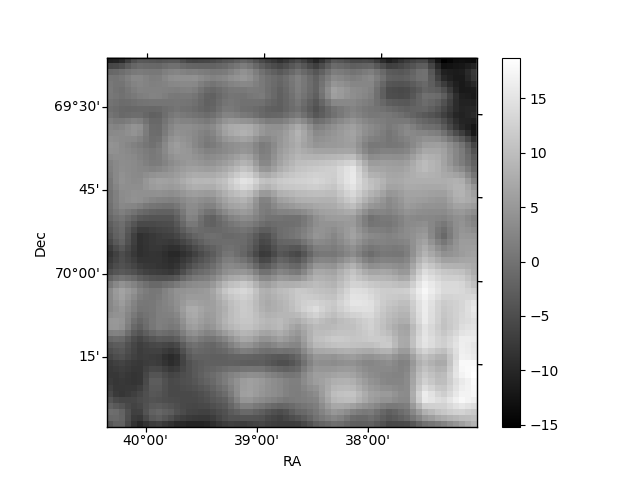
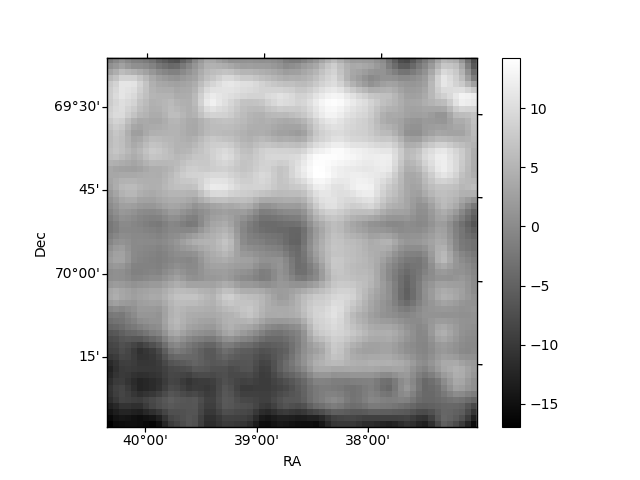
Histogram calculated using DETX and DETY for each event in the final _common_clean file
| Quadrant A | 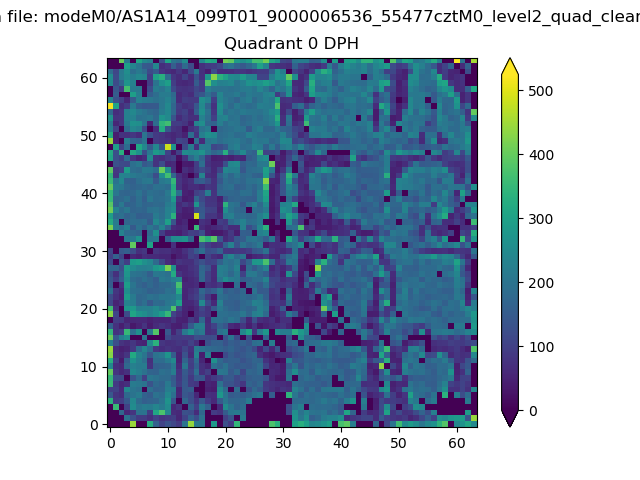 |
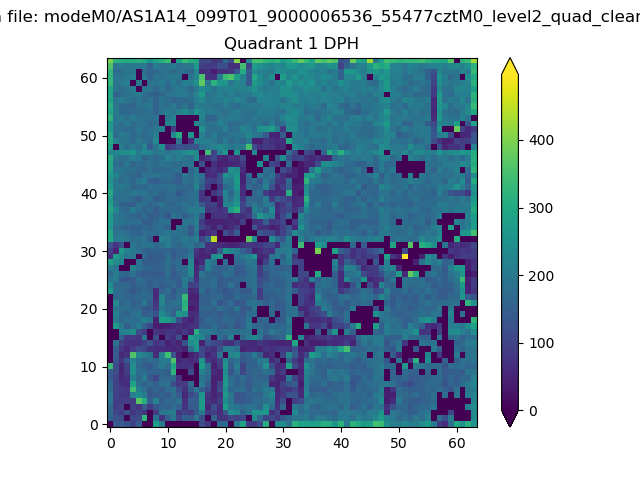 |
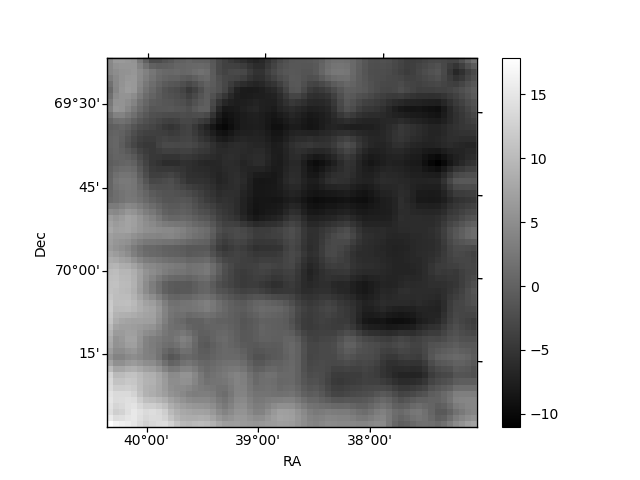
Quadrant B |
|---|---|---|---|
| Quadrant D | 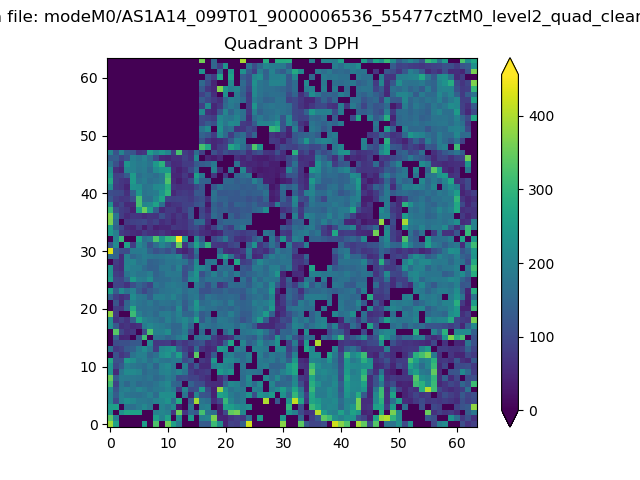 |
 |
Quadrant C |
| Plot type | Count rate plots | Images |
|---|---|---|
| Comparison with Poisson distribution Blue bars denote a histogram of data divided into 1 sec bins. Red curve is a Poisson curve with rate = median count rate of data. |
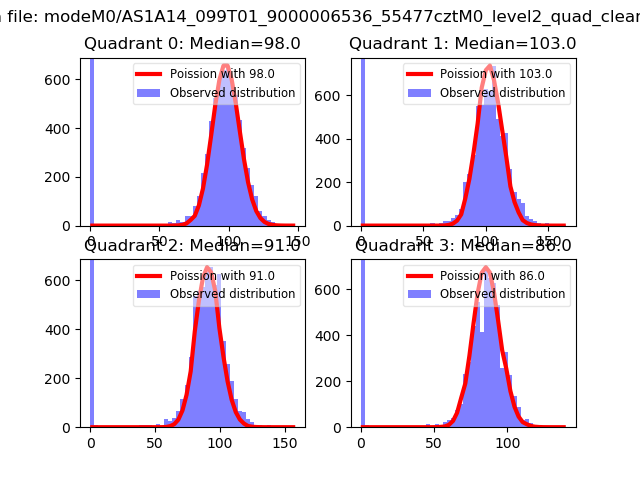 |
 |
| Quadrant-wise count rates Data is divided into 100 sec bins |
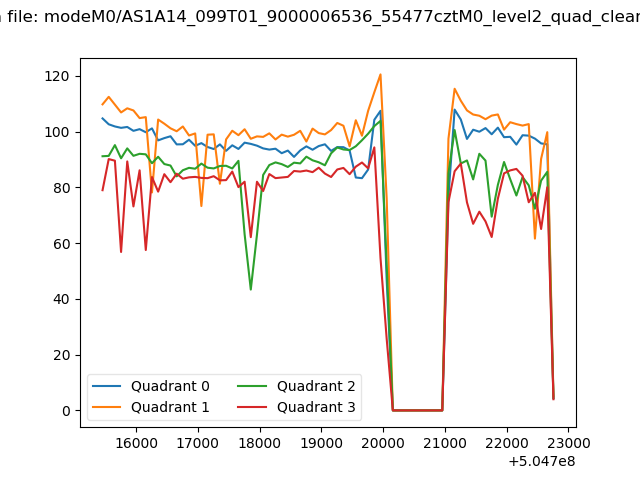 |
|
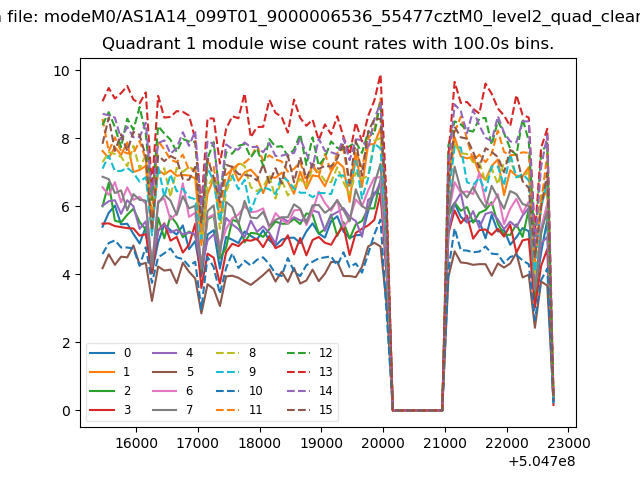
| Module-wise count rates for Quadrant A Data is divided into 100 sec bins |
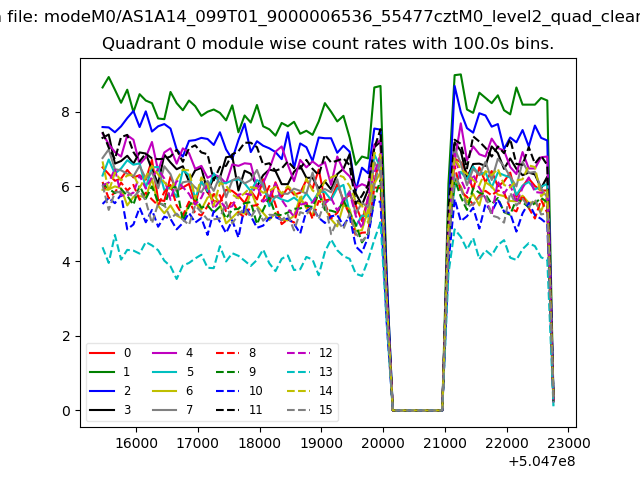 |
 |
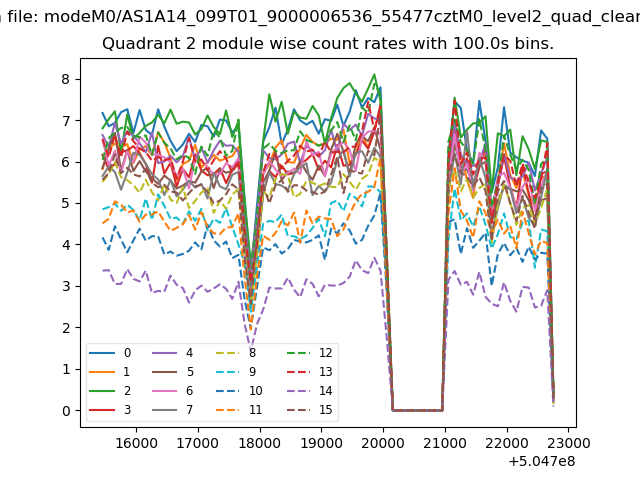
| Module-wise count rates for Quadrant B Data is divided into 100 sec bins |
 |
 |
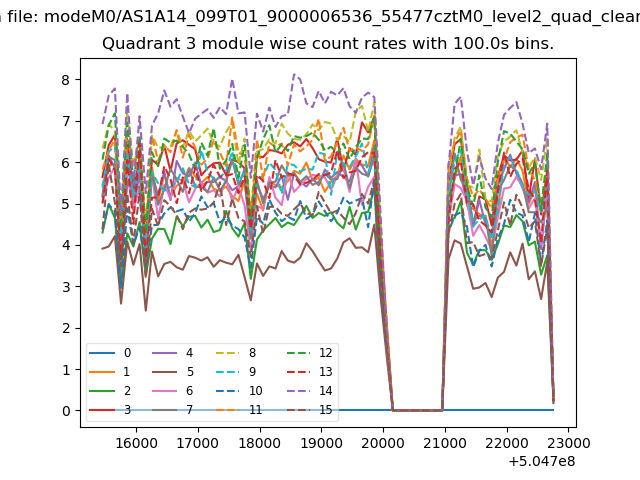
| Module-wise count rates for Quadrant C Data is divided into 100 sec bins |
 |
 |
| Module-wise count rates for Quadrant D Data is divided into 100 sec bins |
 |
 |
| Parameter | Plot |
|---|---|
| CZT HV Monitor | 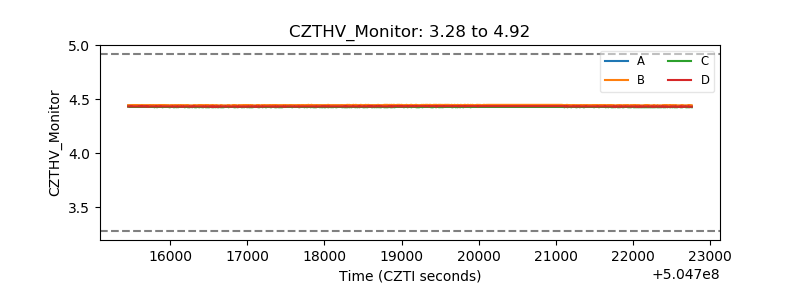 |
| D_VDD | 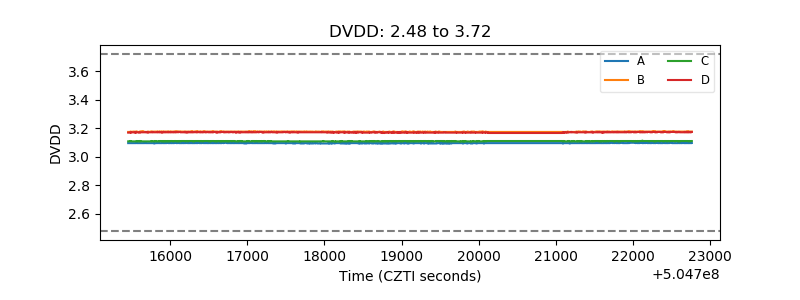 |
| Temperature 1 | 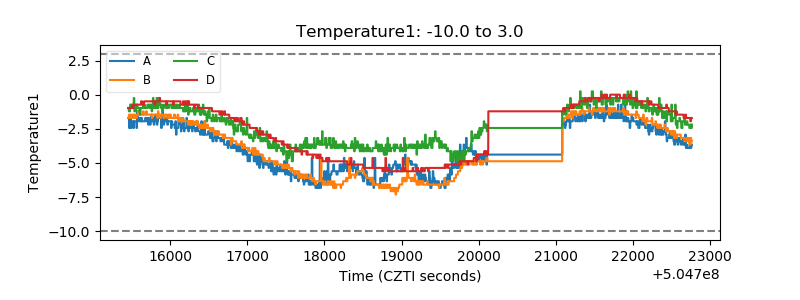 |
| Veto HV Monitor | 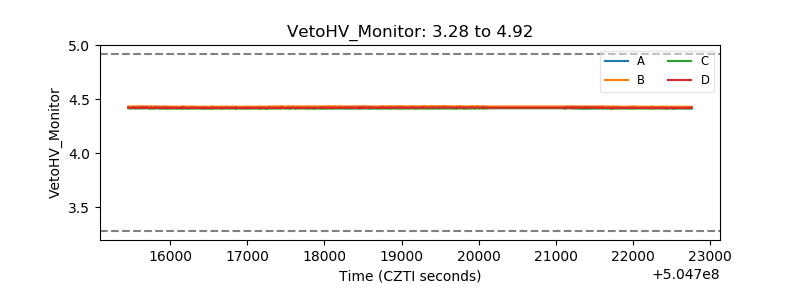 |
| Veto LLD | 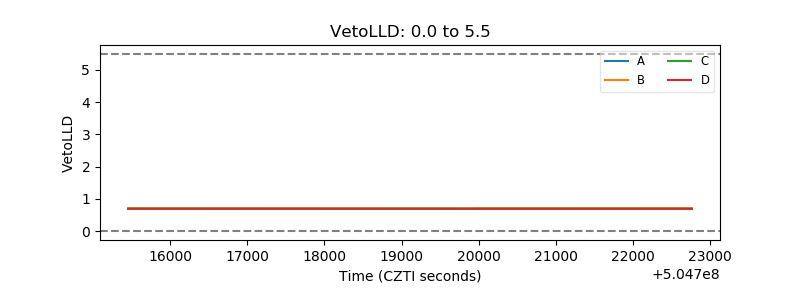 |
| Alpha Counter | 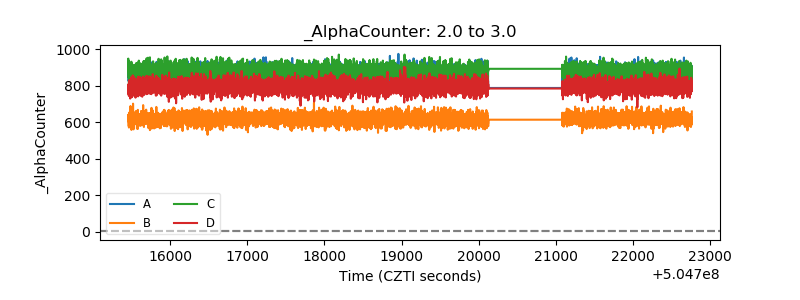 |
| _CPM_Rate | 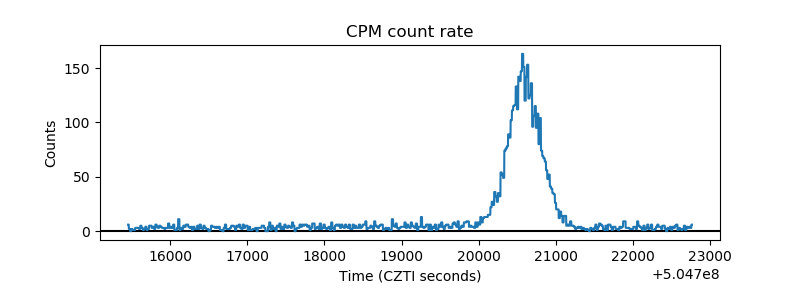 |
| CZT Counter | 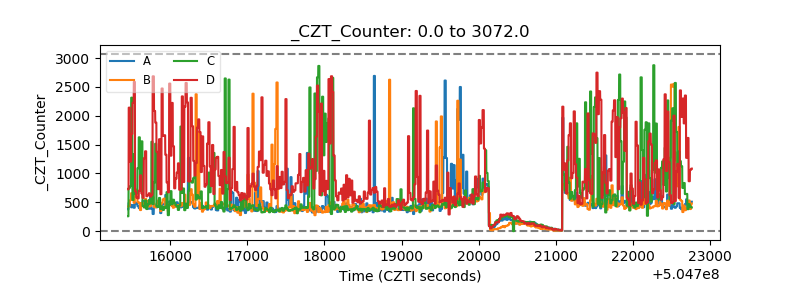 |
| +2.5 Volts monitor | 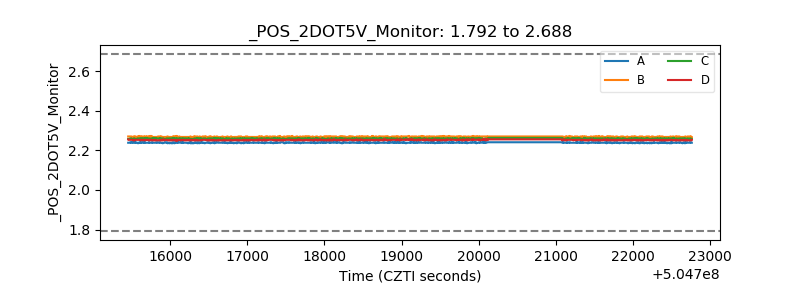 |
| +5 Volts monitor | 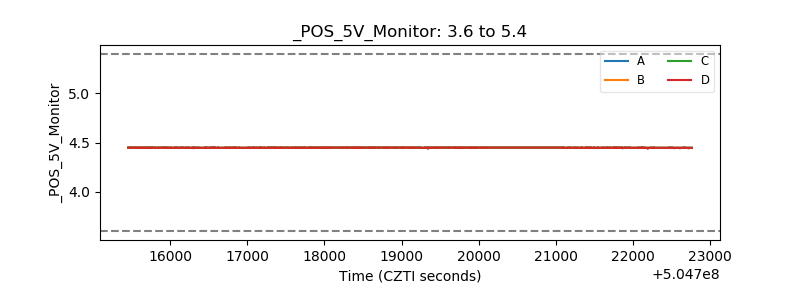 |
| _ROLL_ROT | 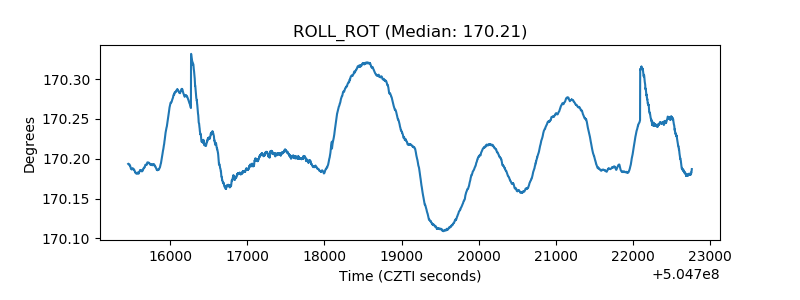 |
| _Roll_DEC | 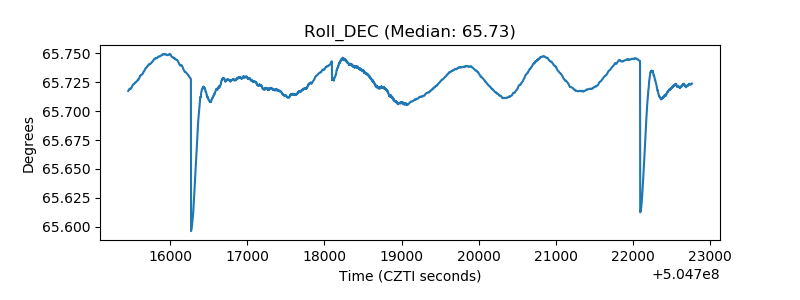 |
| _Roll_RA | 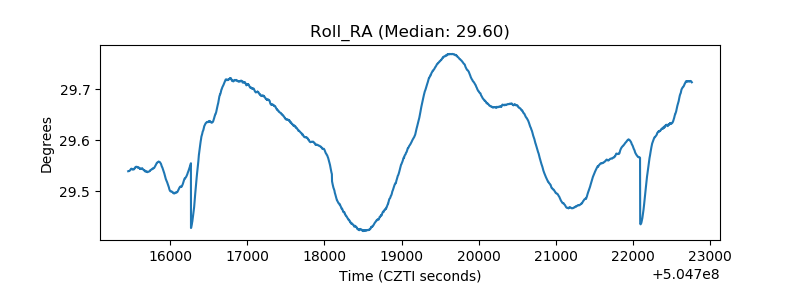 |
| Veto Counter | 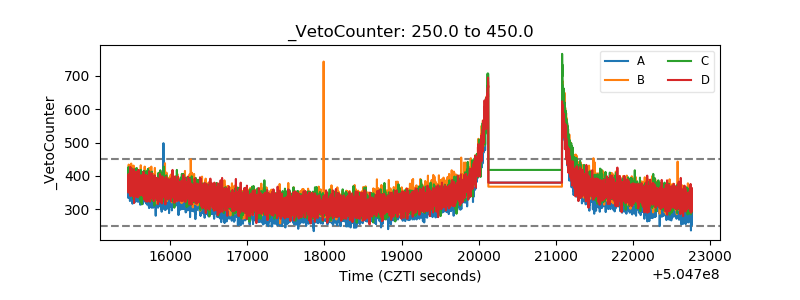 |