| Param | Original file | Final file |
|---|---|---|
| Filename | modeM0/AS1A14_099T01_9000006536_55478cztM0_level2.fits | modeM0/AS1A14_099T01_9000006536_55478cztM0_level2_quad_clean.evt |
| Size (bytes) | 420,500,160 | 91,206,720 |
| Size | 401.0 MB | 87.0 MB |
| Events in quadrant A | 3,111,523 | 605,600 |
| Events in quadrant B | 3,181,809 | 633,472 |
| Events in quadrant C | 3,879,186 | 554,813 |
| Events in quadrant D | 4,899,547 | 525,172 |
| Mode M9 | |||
|---|---|---|---|
| Quadrant | BADHDUFLAG | Total packets | Discarded packets |
| A | 0 | 6 | 0 |
| B | 0 | 6 | 0 |
| C | 0 | 6 | 0 |
| D | 0 | 6 | 0 |
| Mode SS | |||
|---|---|---|---|
| Quadrant | BADHDUFLAG | Total packets | Discarded packets |
| A | 0 | 130 | 0 |
| B | 0 | 130 | 2 |
| C | 0 | 130 | 2 |
| D | 0 | 130 | 2 |
| Mode M0 | |||
|---|---|---|---|
| Quadrant | BADHDUFLAG | Total packets | Discarded packets |
| A | 0 | 14109 | 239 |
| B | 0 | 14510 | 252 |
| C | 0 | 16788 | 334 |
| D | 0 | 19600 | 675 |
| Quadrant | Total seconds | Saturated seconds | Saturation percentage |
|---|---|---|---|
| A | 6352 | 59 | 0.928841% |
| B | 6348 | 169 | 2.662256% |
| C | 6344 | 294 | 4.634300% |
| D | 6326 | 352 | 5.564338% |
Noise dominated data is calculated using 1-second bins in cleaned event files. If a bin has >2000 counts, and if more than 50% of those come from <1% of pixels, then it is considered to be noise-dominated and hence unusable.
| Quadrant | # 1 sec bins | Bins with >0 counts | Bins with >2000 counts | High rate bins dominated by noise | Noise dominated (total time) | Noise dominated (detector-on time) | Marked lightcurve |
|---|---|---|---|---|---|---|---|
| A | 6943 | 6366 | 18 | 18 | 0.26% | 0.28% | 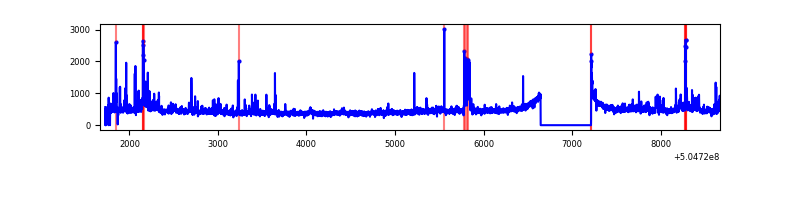 |
| B | 6962 | 6362 | 78 | 78 | 1.12% | 1.23% | 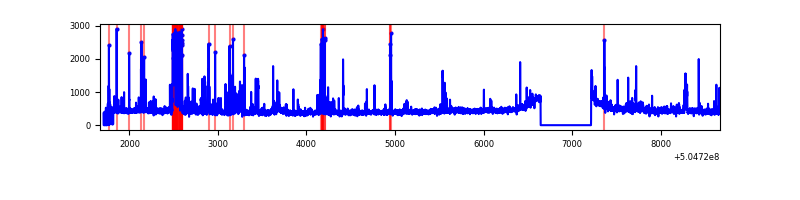 |
| C | 7000 | 6364 | 234 | 234 | 3.34% | 3.68% | 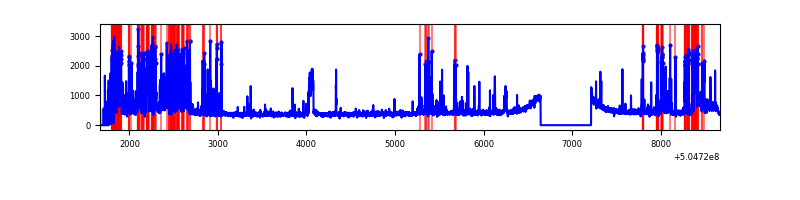 |
| D | 7002 | 6335 | 321 | 321 | 4.58% | 5.07% | 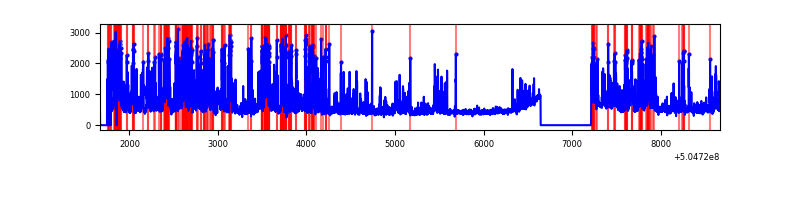 |
Top three noisy pixels from each quadrant. If the there are fewer than three noisy pixels in the level2.evt file, extra rows are filled as -1
| Pixel properties | Quadrant properties | ||||||
|---|---|---|---|---|---|---|---|
| Quadrant | DetID | PixID | Counts | Sigma | Mean | Median | Sigma |
| A | 3 | 78 | 156041 | 928.72 | 674 | 658 | 167.3 |
| A | 12 | 115 | 136899 | 814.31 | 674 | 658 | 167.3 |
| A | 4 | 3 | 64815 | 383.47 | 674 | 658 | 167.3 |
| B | 5 | 248 | 180932 | 1270.18 | 663 | 638 | 141.9 |
| B | 4 | 206 | 109270 | 765.32 | 663 | 638 | 141.9 |
| B | 10 | 247 | 64618 | 450.74 | 663 | 638 | 141.9 |
| C | 9 | 38 | 633623 | 3539.76 | 652 | 643 | 178.8 |
| C | 13 | 3 | 589185 | 3291.25 | 652 | 643 | 178.8 |
| C | 12 | 252 | 32567 | 178.53 | 652 | 643 | 178.8 |
| D | 11 | 129 | 1598277 | 8761.33 | 647 | 620 | 182.4 |
| D | 5 | 113 | 165872 | 906.22 | 647 | 620 | 182.4 |
| D | 6 | 239 | 130840 | 714.11 | 647 | 620 | 182.4 |
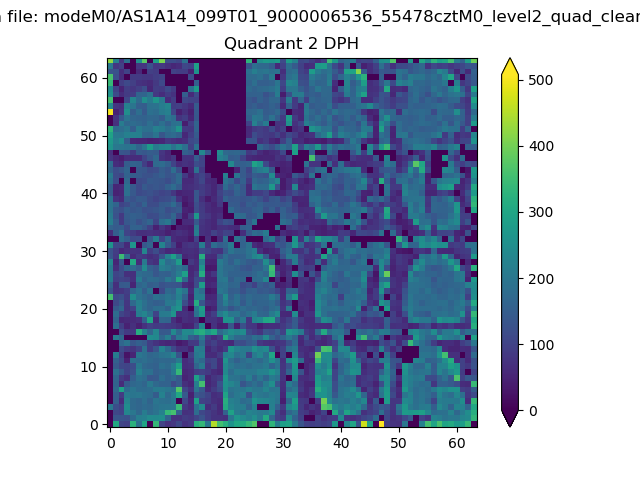
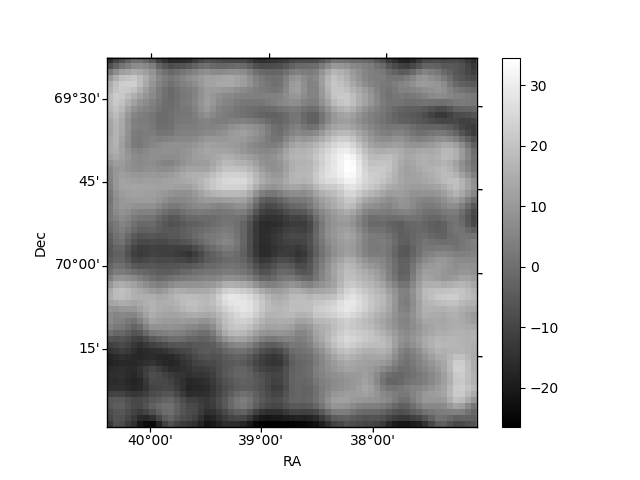
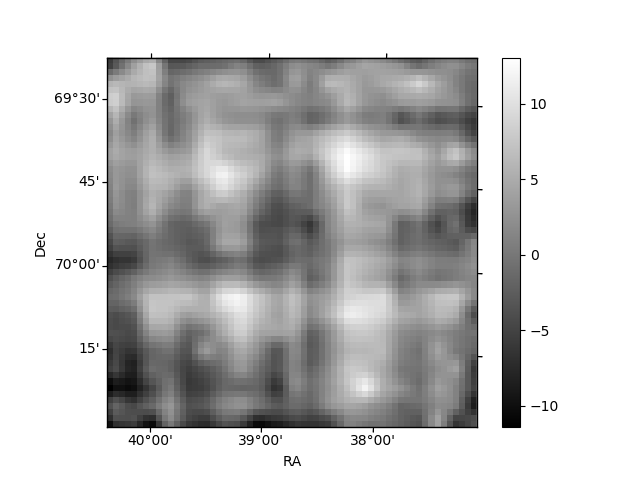
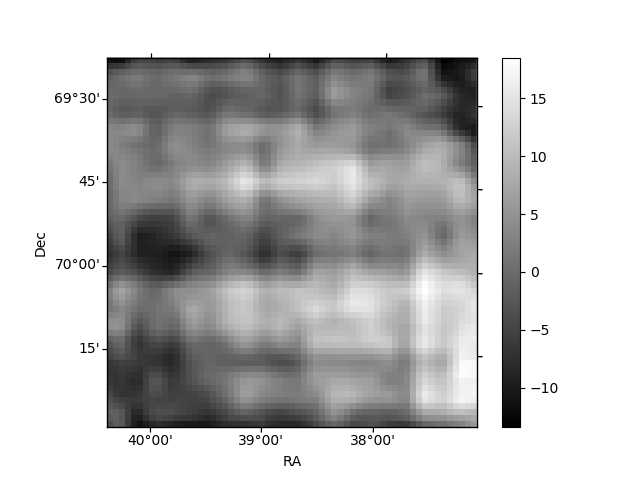
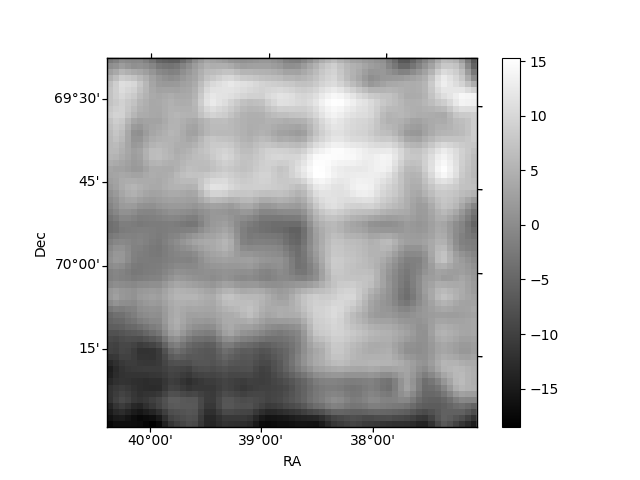
Histogram calculated using DETX and DETY for each event in the final _common_clean file
| Quadrant A | 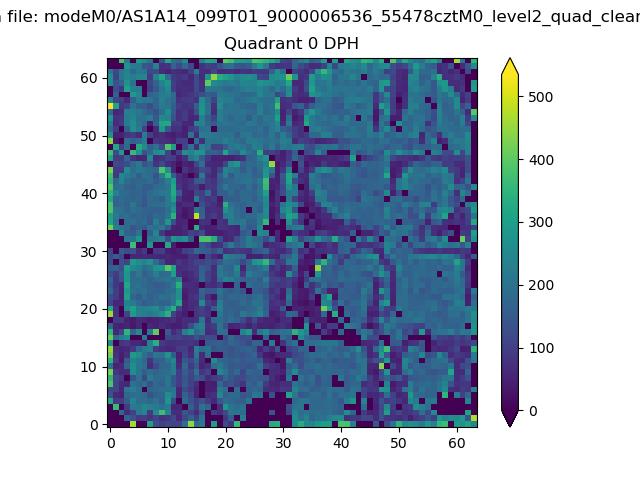 |
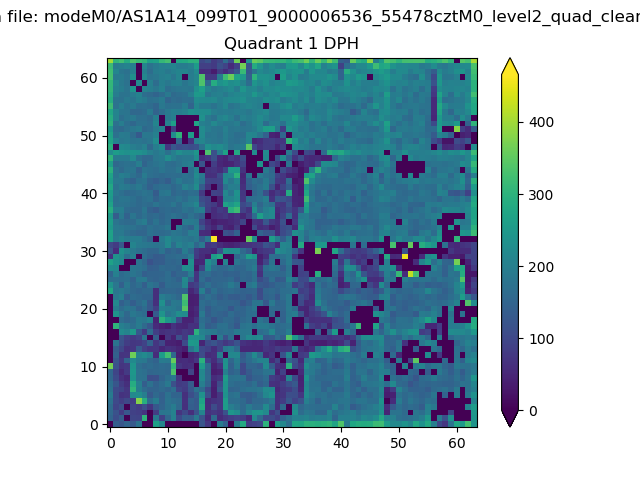 |
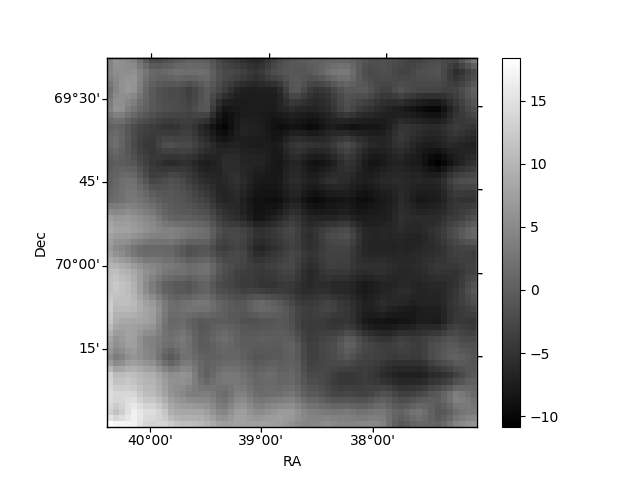
Quadrant B |
|---|---|---|---|
| Quadrant D | 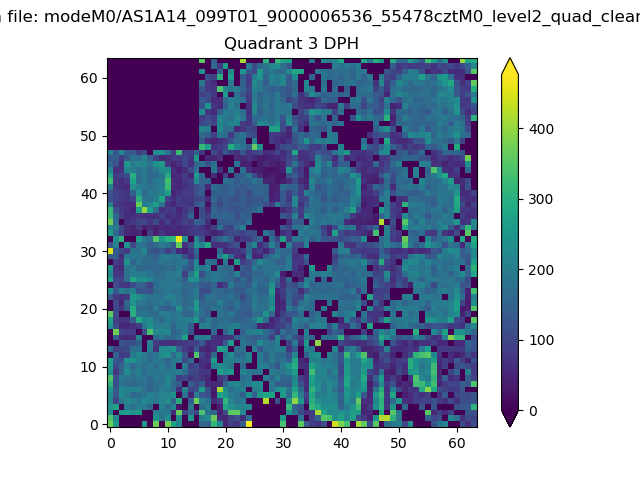 |
 |
Quadrant C |
| Plot type | Count rate plots | Images |
|---|---|---|
| Comparison with Poisson distribution Blue bars denote a histogram of data divided into 1 sec bins. Red curve is a Poisson curve with rate = median count rate of data. |
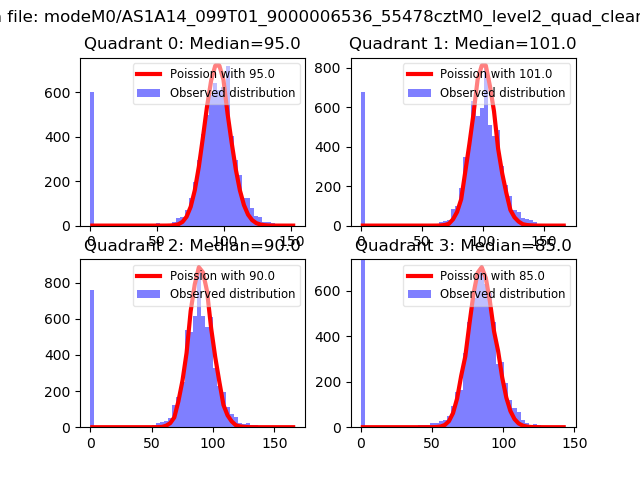 |
 |
| Quadrant-wise count rates Data is divided into 100 sec bins |
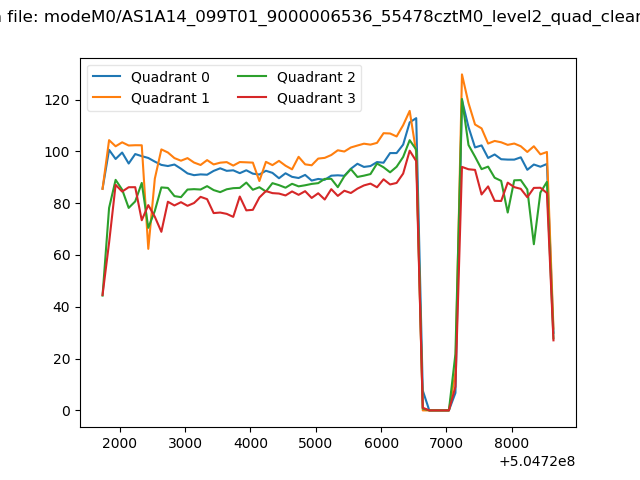 |
|
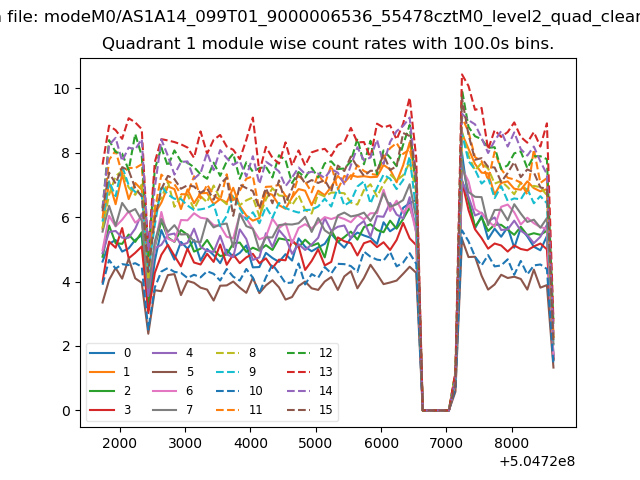
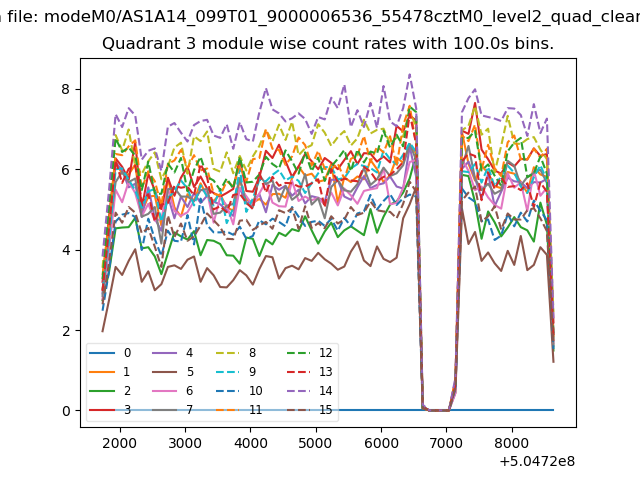
| Module-wise count rates for Quadrant A Data is divided into 100 sec bins |
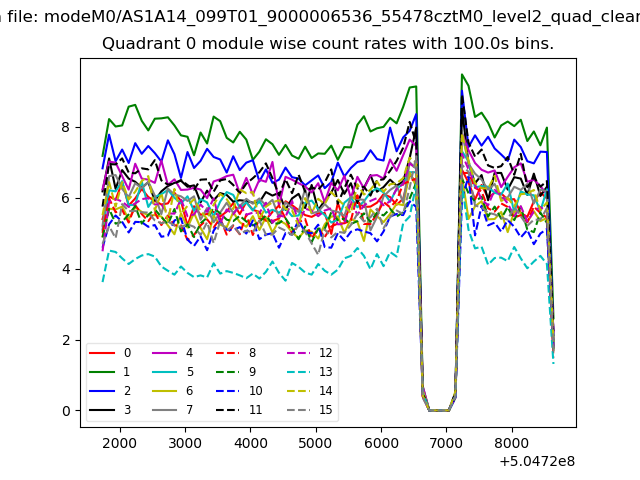 |
 |
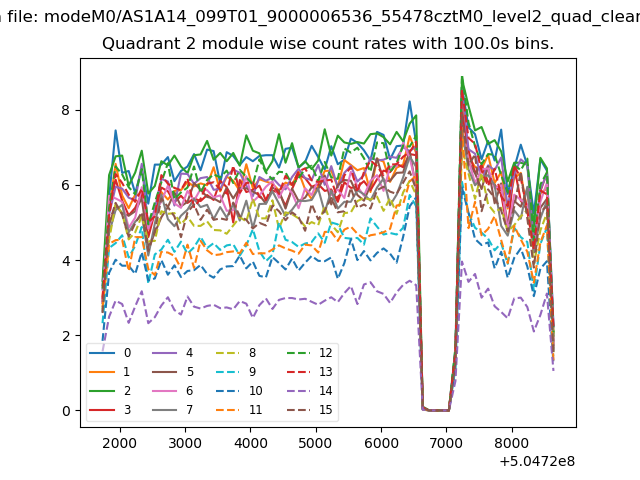
| Module-wise count rates for Quadrant B Data is divided into 100 sec bins |
 |
 |
| Module-wise count rates for Quadrant C Data is divided into 100 sec bins |
 |
 |
| Module-wise count rates for Quadrant D Data is divided into 100 sec bins |
 |
 |
| Parameter | Plot |
|---|---|
| CZT HV Monitor | 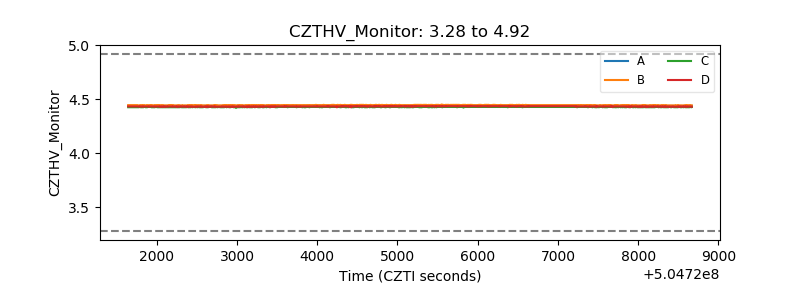 |
| D_VDD | 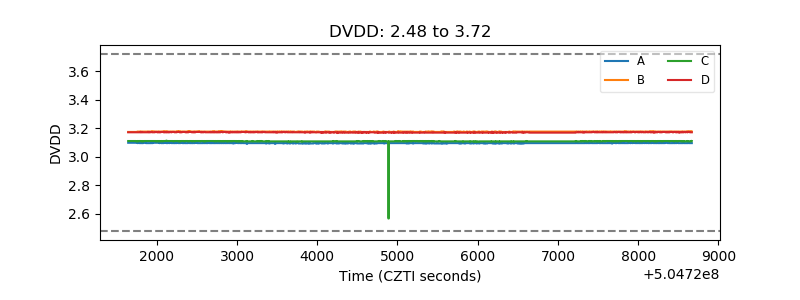 |
| Temperature 1 | 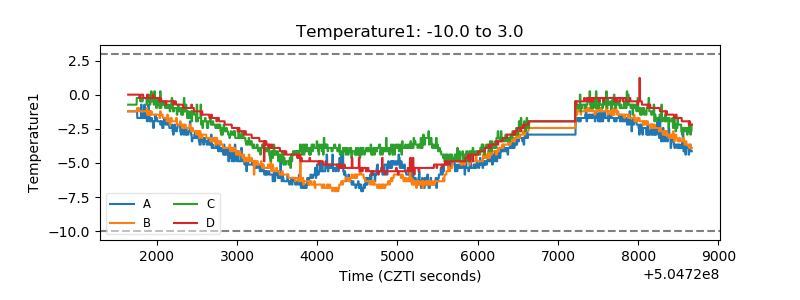 |
| Veto HV Monitor | 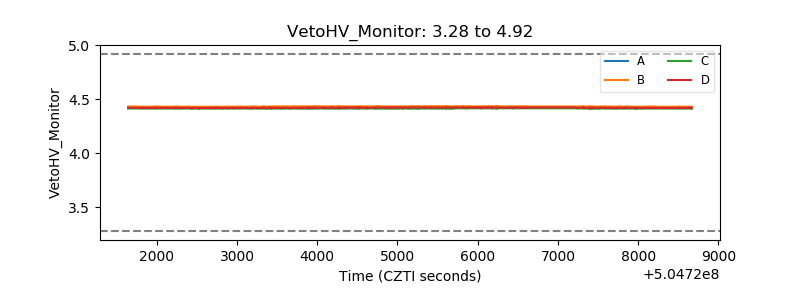 |
| Veto LLD | 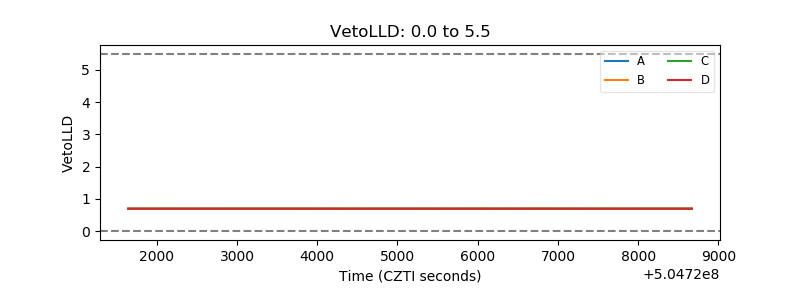 |
| Alpha Counter | 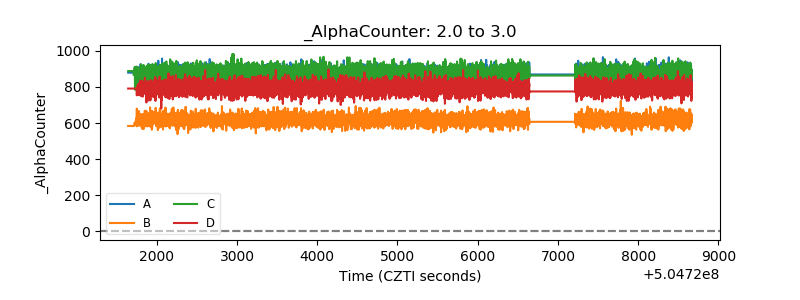 |
| _CPM_Rate | 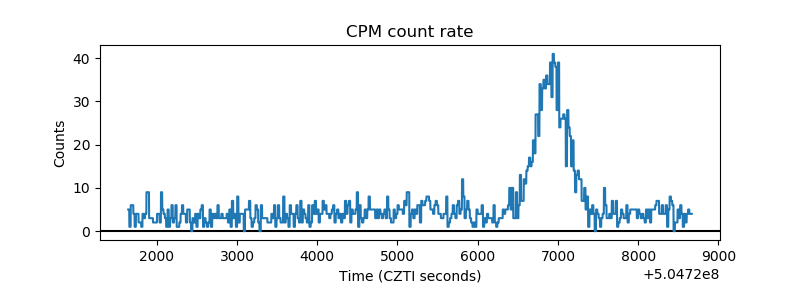 |
| CZT Counter | 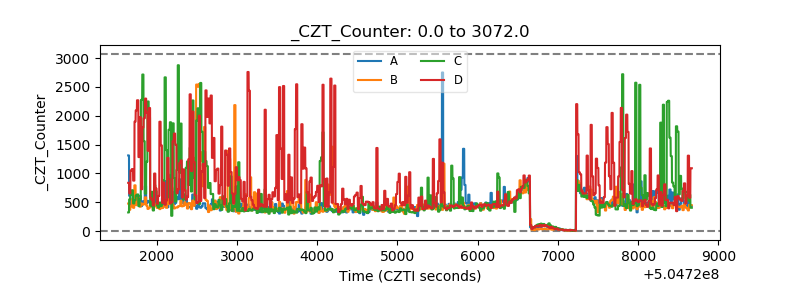 |
| +2.5 Volts monitor | 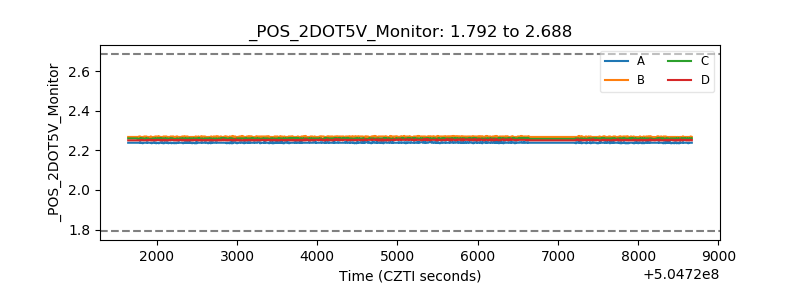 |
| +5 Volts monitor |  |
| _ROLL_ROT | 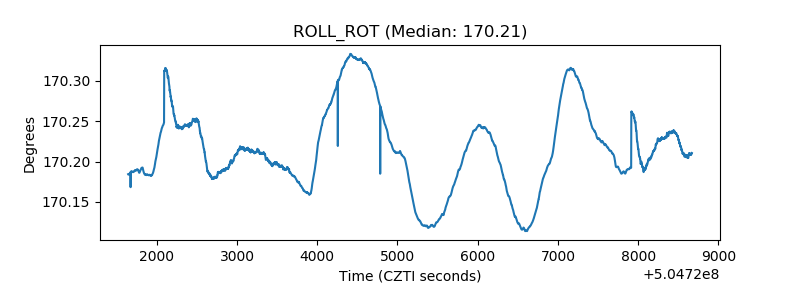 |
| _Roll_DEC | 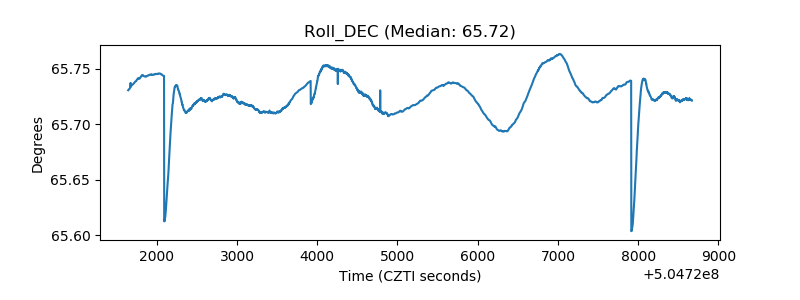 |
| _Roll_RA | 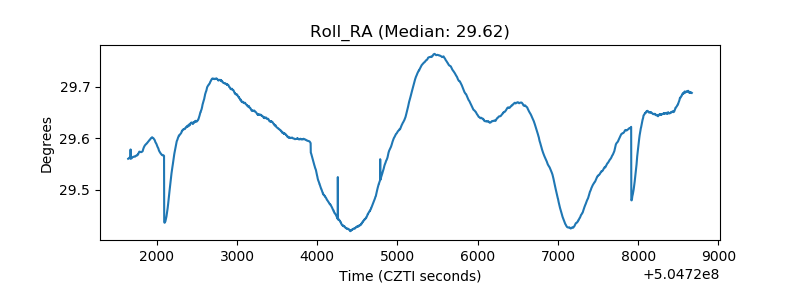 |
| Veto Counter | 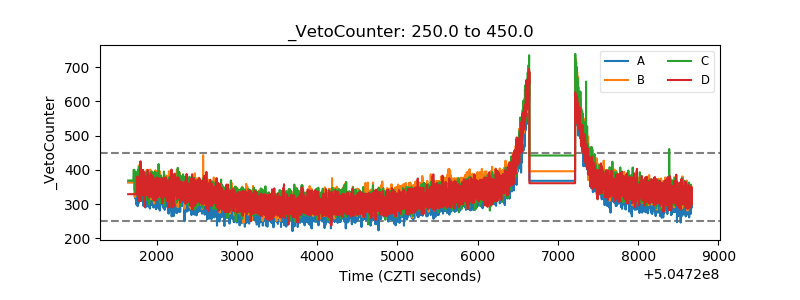 |