| Param | Original file | Final file |
|---|---|---|
| Filename | modeM0/AS1A14_099T01_9000006536_55479cztM0_level2.fits | modeM0/AS1A14_099T01_9000006536_55479cztM0_level2_quad_clean.evt |
| Size (bytes) | 511,395,840 | 111,536,640 |
| Size | 487.7 MB | 106.4 MB |
| Events in quadrant A | 4,462,109 | 725,532 |
| Events in quadrant B | 3,886,584 | 786,152 |
| Events in quadrant C | 4,103,205 | 695,936 |
| Events in quadrant D | 5,875,654 | 630,360 |
| Mode M9 | |||
|---|---|---|---|
| Quadrant | BADHDUFLAG | Total packets | Discarded packets |
| A | 0 | 6 | 1 |
| B | 0 | 6 | 1 |
| C | 0 | 6 | 1 |
| D | 0 | 6 | 1 |
| Mode SS | |||
|---|---|---|---|
| Quadrant | BADHDUFLAG | Total packets | Discarded packets |
| A | 0 | 156 | 2 |
| B | 0 | 156 | 2 |
| C | 0 | 156 | 2 |
| D | 0 | 156 | 2 |
| Mode M0 | |||
|---|---|---|---|
| Quadrant | BADHDUFLAG | Total packets | Discarded packets |
| A | 0 | 18805 | 2 |
| B | 0 | 17355 | 1 |
| C | 0 | 17896 | 1 |
| D | 0 | 22973 | 4 |
| Quadrant | Total seconds | Saturated seconds | Saturation percentage |
|---|---|---|---|
| A | 7756 | 237 | 3.055699% |
| B | 7756 | 120 | 1.547189% |
| C | 7756 | 131 | 1.689015% |
| D | 7756 | 543 | 7.001031% |
Noise dominated data is calculated using 1-second bins in cleaned event files. If a bin has >2000 counts, and if more than 50% of those come from <1% of pixels, then it is considered to be noise-dominated and hence unusable.
| Quadrant | # 1 sec bins | Bins with >0 counts | Bins with >2000 counts | High rate bins dominated by noise | Noise dominated (total time) | Noise dominated (detector-on time) | Marked lightcurve |
|---|---|---|---|---|---|---|---|
| A | 7756 | 7756 | 166 | 166 | 2.14% | 2.14% | 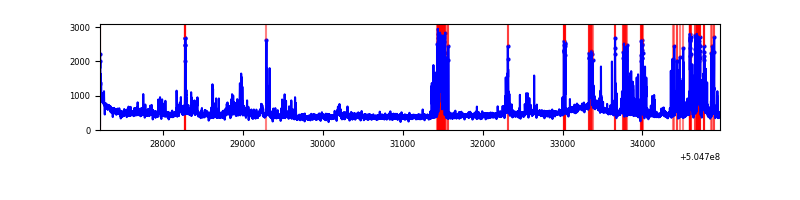 |
| B | 7756 | 7756 | 52 | 52 | 0.67% | 0.67% | 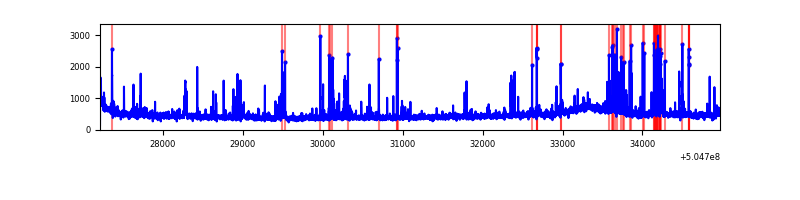 |
| C | 7756 | 7756 | 101 | 101 | 1.30% | 1.30% | 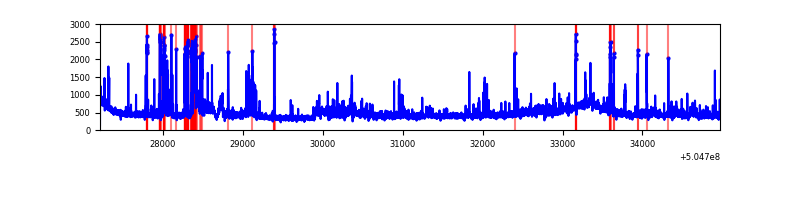 |
| D | 7756 | 7756 | 468 | 468 | 6.03% | 6.03% | 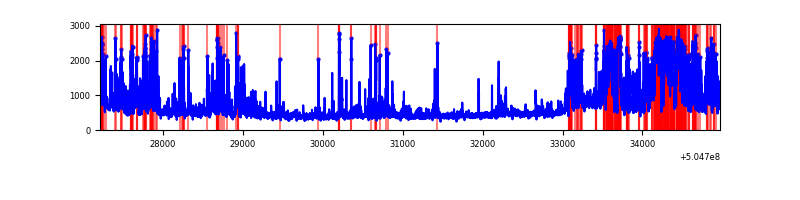 |
Top three noisy pixels from each quadrant. If the there are fewer than three noisy pixels in the level2.evt file, extra rows are filled as -1
| Pixel properties | Quadrant properties | ||||||
|---|---|---|---|---|---|---|---|
| Quadrant | DetID | PixID | Counts | Sigma | Mean | Median | Sigma |
| A | 0 | 8 | 534436 | 2572.01 | 833 | 808 | 207.5 |
| A | 3 | 78 | 236120 | 1134.17 | 833 | 808 | 207.5 |
| A | 13 | 248 | 176636 | 847.47 | 833 | 808 | 207.5 |
| B | 5 | 236 | 251810 | 1422.82 | 831 | 801 | 176.4 |
| B | 7 | 252 | 73602 | 412.67 | 831 | 801 | 176.4 |
| B | 10 | 247 | 68141 | 381.71 | 831 | 801 | 176.4 |
| C | 9 | 38 | 484995 | 2163.52 | 820 | 811 | 223.8 |
| C | 13 | 3 | 186257 | 828.65 | 820 | 811 | 223.8 |
| C | 15 | 147 | 45347 | 199.0 | 820 | 811 | 223.8 |
| D | 11 | 129 | 1661983 | 7319.09 | 805 | 766 | 227.0 |
| D | 7 | 70 | 275675 | 1211.21 | 805 | 766 | 227.0 |
| D | 5 | 113 | 191690 | 841.18 | 805 | 766 | 227.0 |
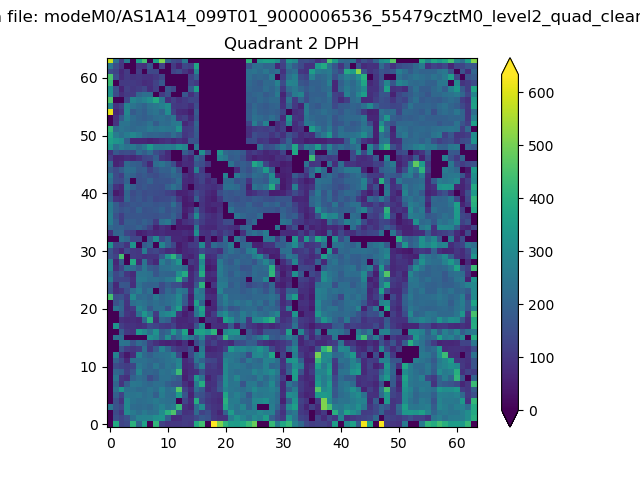
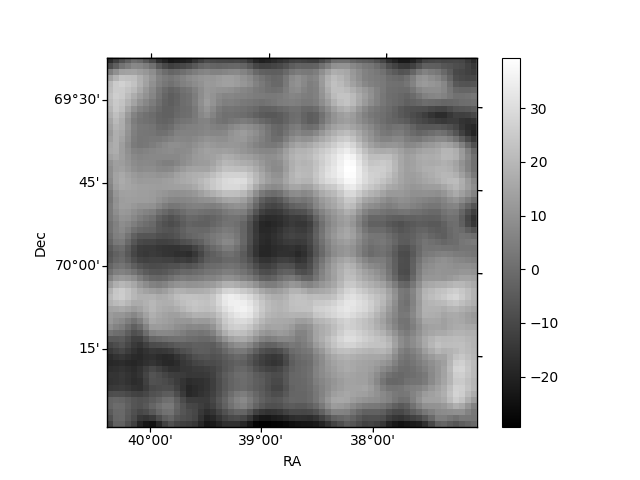
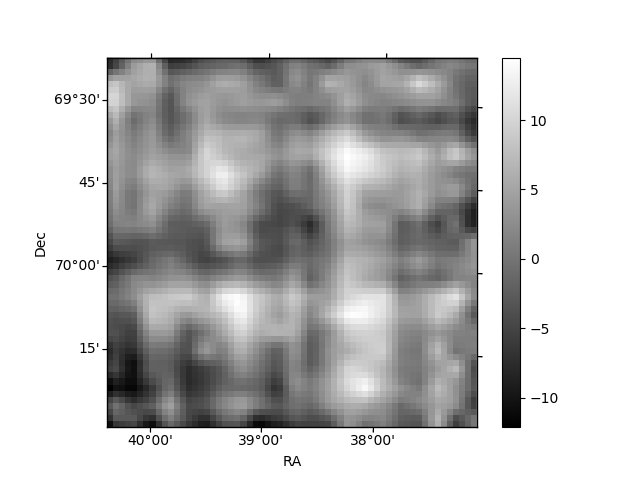
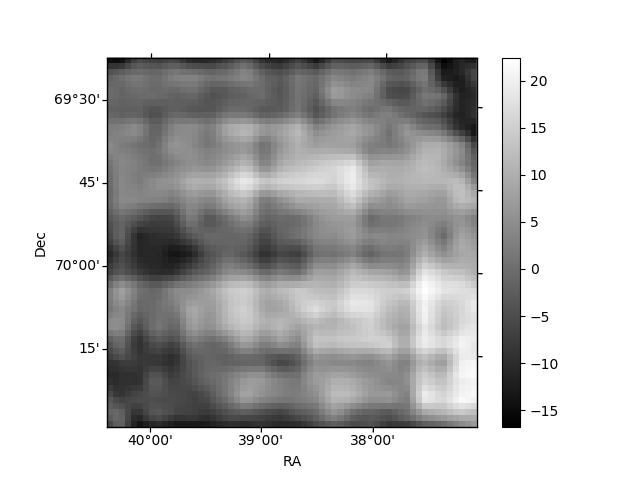
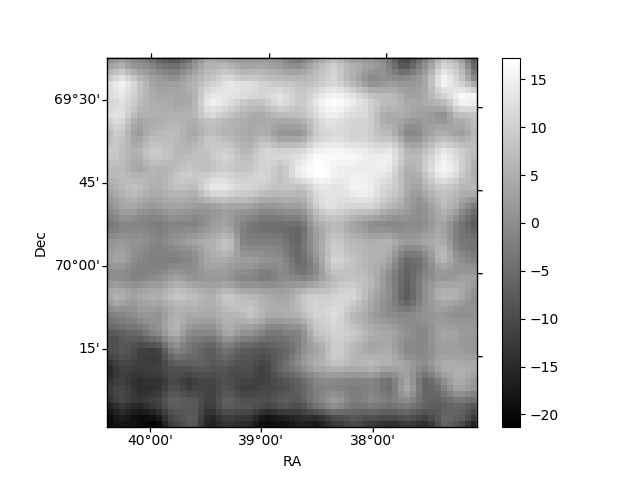
Histogram calculated using DETX and DETY for each event in the final _common_clean file
| Quadrant A | 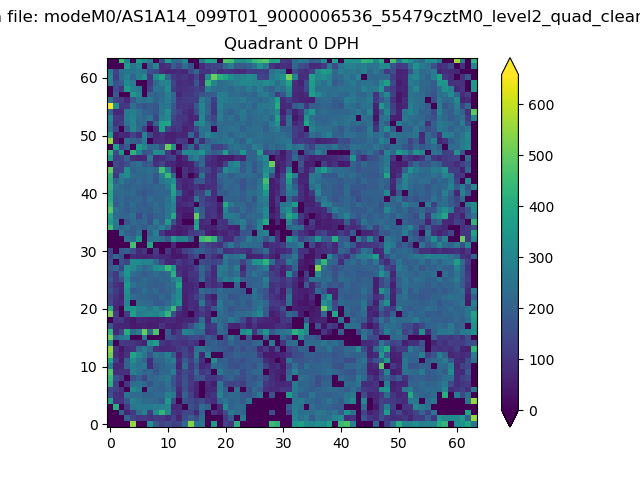 |
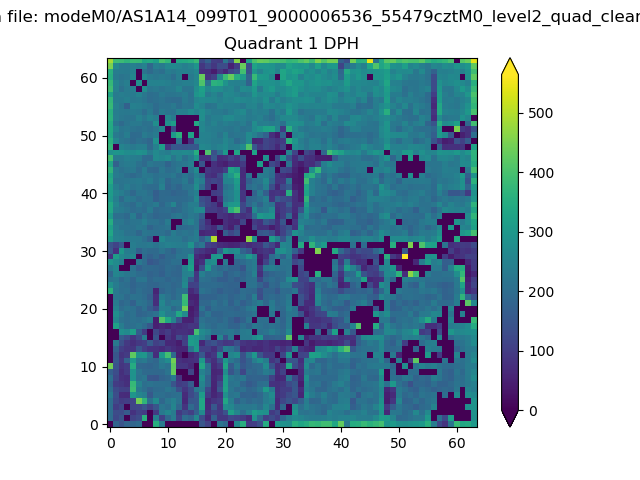 |
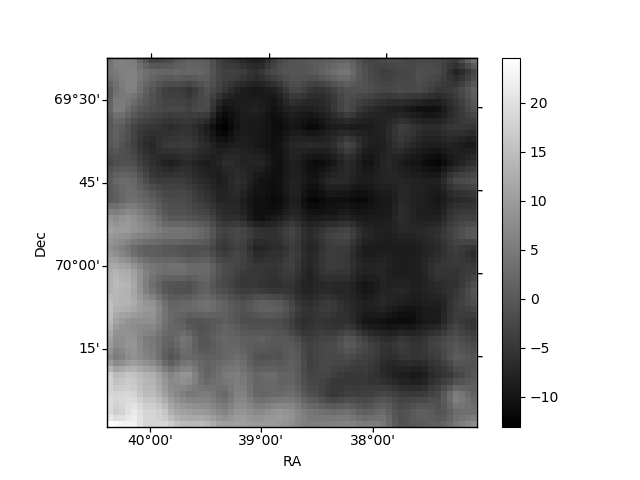
Quadrant B |
|---|---|---|---|
| Quadrant D | 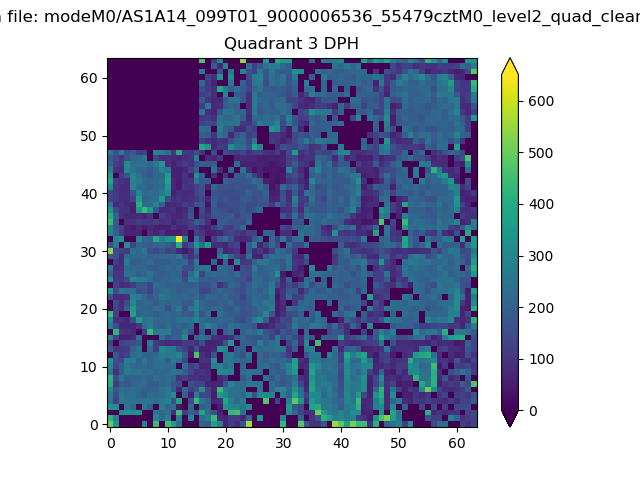 |
 |
Quadrant C |
| Plot type | Count rate plots | Images |
|---|---|---|
| Comparison with Poisson distribution Blue bars denote a histogram of data divided into 1 sec bins. Red curve is a Poisson curve with rate = median count rate of data. |
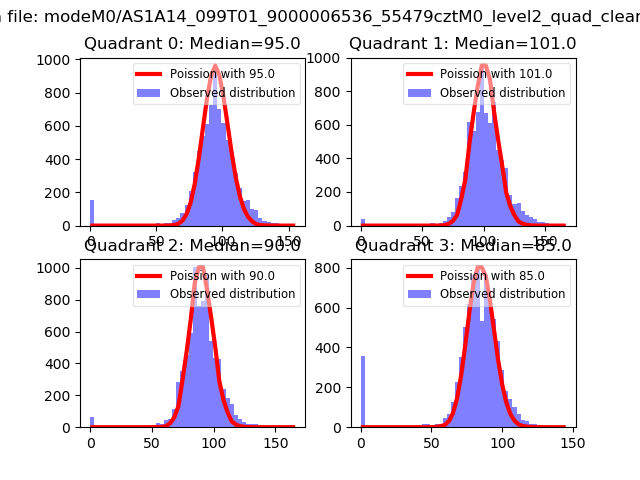 |
 |
| Quadrant-wise count rates Data is divided into 100 sec bins |
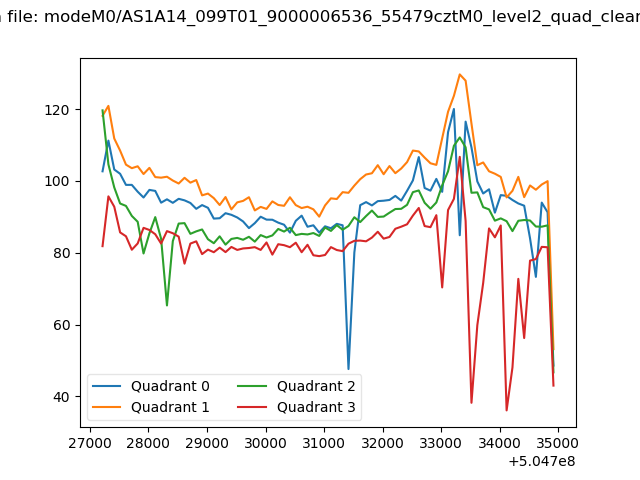 |
|
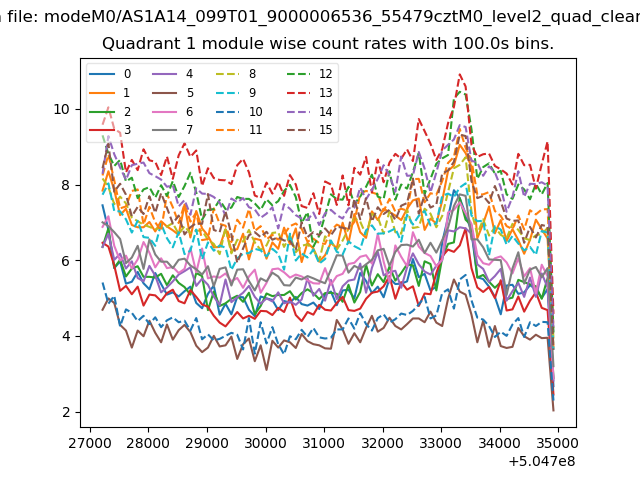
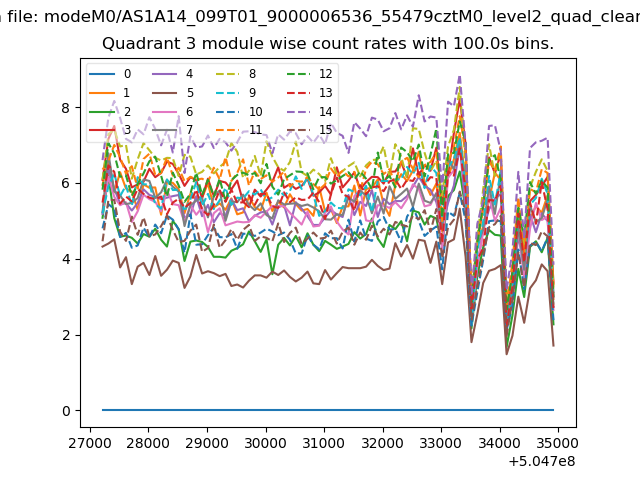
| Module-wise count rates for Quadrant A Data is divided into 100 sec bins |
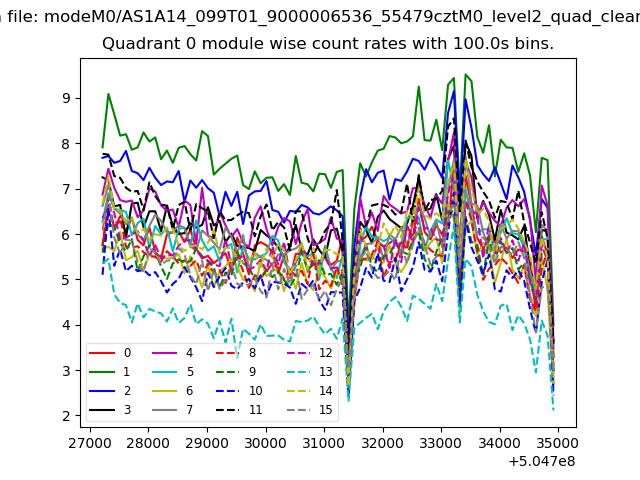 |
 |
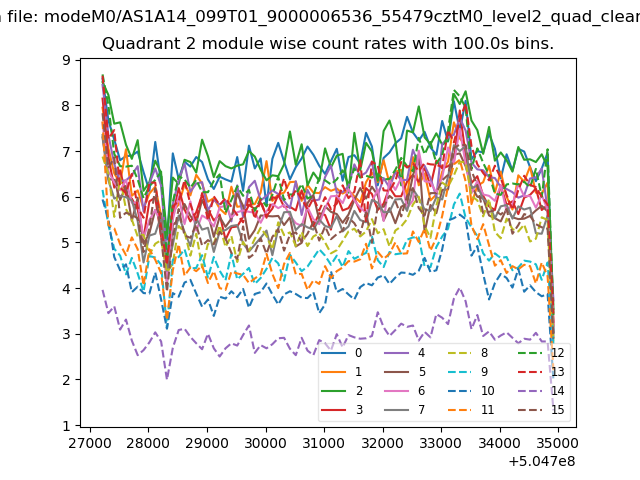
| Module-wise count rates for Quadrant B Data is divided into 100 sec bins |
 |
 |
| Module-wise count rates for Quadrant C Data is divided into 100 sec bins |
 |
 |
| Module-wise count rates for Quadrant D Data is divided into 100 sec bins |
 |
 |
| Parameter | Plot |
|---|---|
| CZT HV Monitor | 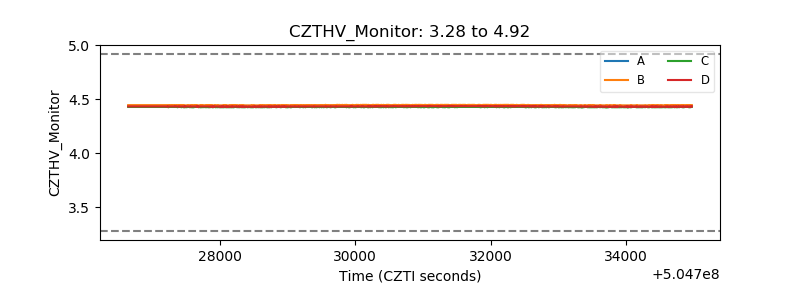 |
| D_VDD | 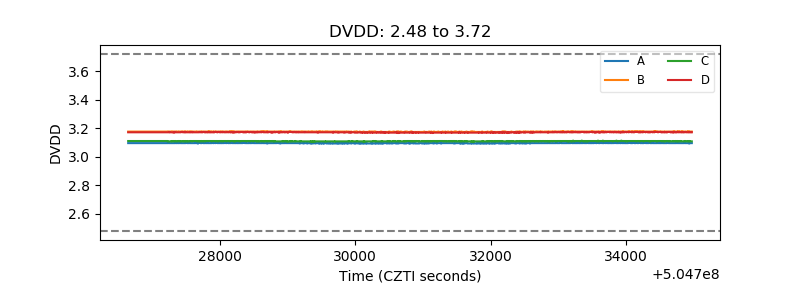 |
| Temperature 1 | 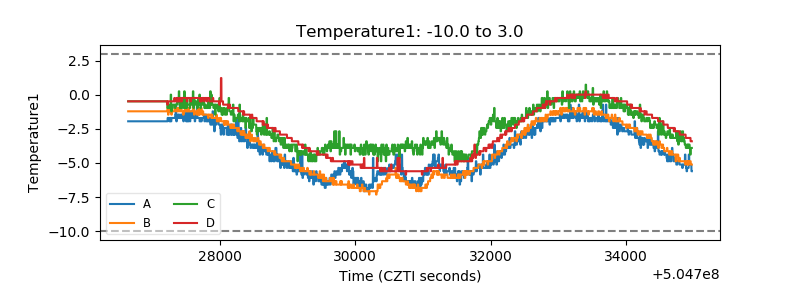 |
| Veto HV Monitor | 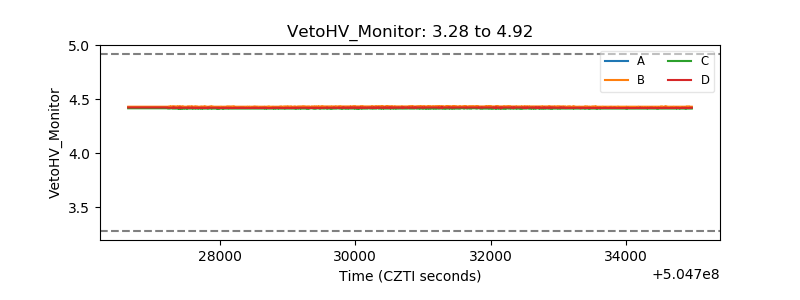 |
| Veto LLD | 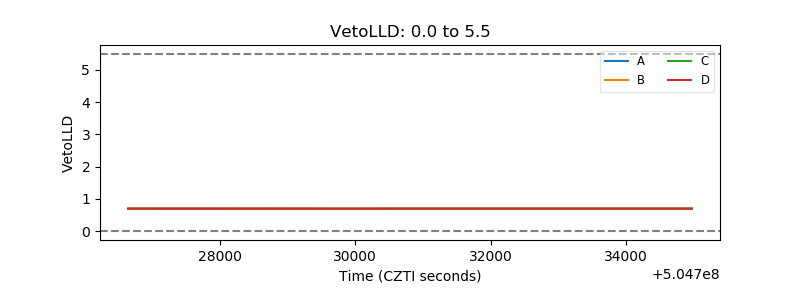 |
| Alpha Counter | 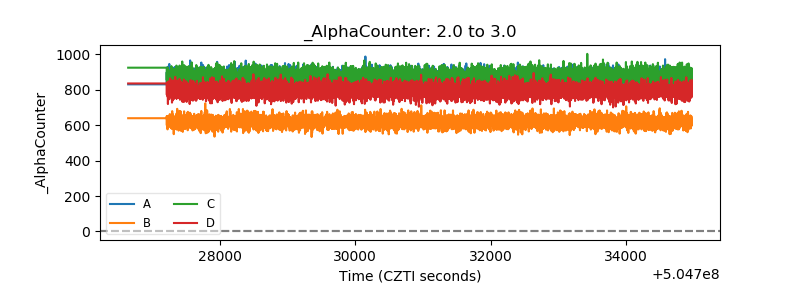 |
| _CPM_Rate | 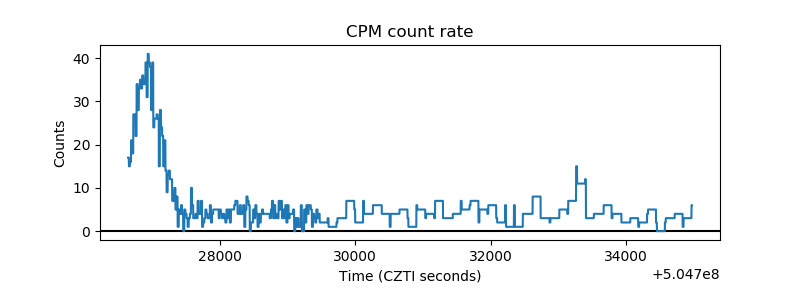 |
| CZT Counter | 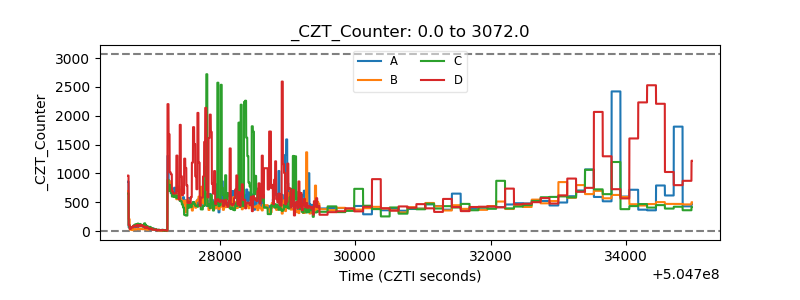 |
| +2.5 Volts monitor |  |
| +5 Volts monitor |  |
| _ROLL_ROT | 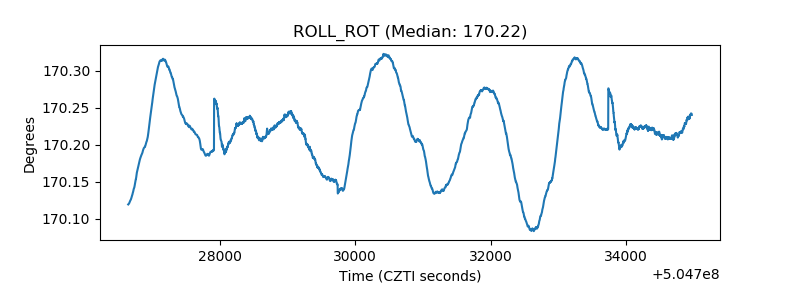 |
| _Roll_DEC | 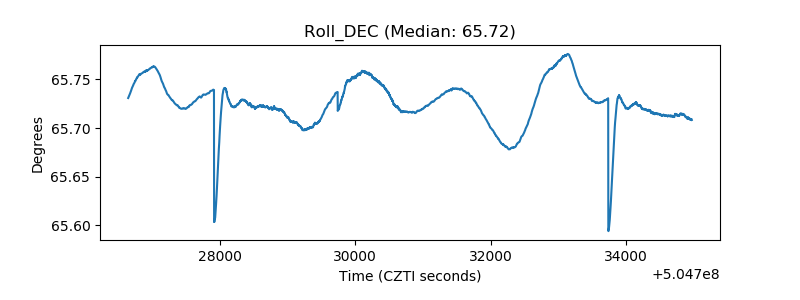 |
| _Roll_RA | 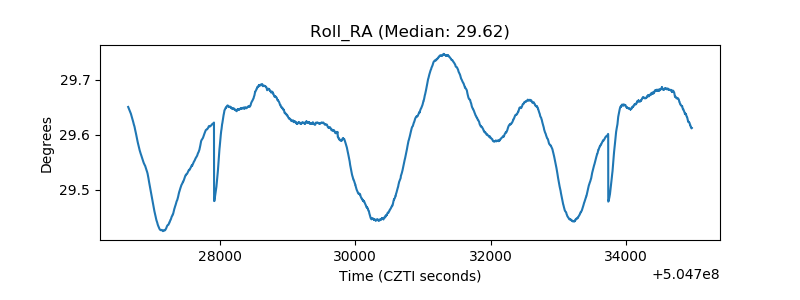 |
| Veto Counter | 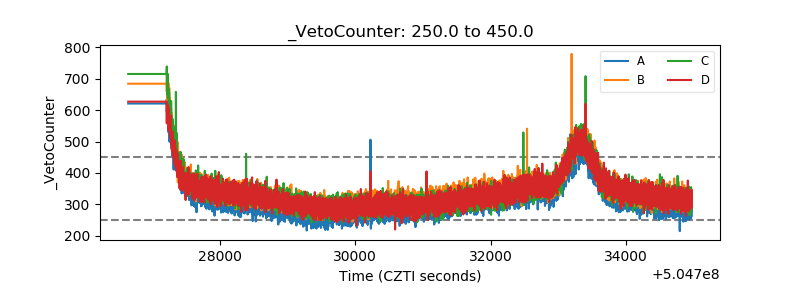 |