| Param | Original file | Final file |
|---|---|---|
| Filename | modeM0/AS1A14_099T01_9000006536_55480cztM0_level2.fits | modeM0/AS1A14_099T01_9000006536_55480cztM0_level2_quad_clean.evt |
| Size (bytes) | 607,754,880 | 116,994,240 |
| Size | 579.6 MB | 111.6 MB |
| Events in quadrant A | 4,975,190 | 771,640 |
| Events in quadrant B | 4,031,511 | 836,237 |
| Events in quadrant C | 4,002,269 | 743,448 |
| Events in quadrant D | 8,844,924 | 615,035 |
| Mode SS | |||
|---|---|---|---|
| Quadrant | BADHDUFLAG | Total packets | Discarded packets |
| A | 0 | 168 | 2 |
| B | 0 | 168 | 2 |
| C | 0 | 168 | 2 |
| D | 0 | 168 | 2 |
| Mode M0 | |||
|---|---|---|---|
| Quadrant | BADHDUFLAG | Total packets | Discarded packets |
| A | 0 | 21025 | 242 |
| B | 0 | 18300 | 247 |
| C | 0 | 18438 | 264 |
| D | 0 | 32293 | 225 |
| Quadrant | Total seconds | Saturated seconds | Saturation percentage |
|---|---|---|---|
| A | 8290 | 231 | 2.786490% |
| B | 8291 | 73 | 0.880473% |
| C | 8284 | 58 | 0.700145% |
| D | 8292 | 1268 | 15.291848% |
Noise dominated data is calculated using 1-second bins in cleaned event files. If a bin has >2000 counts, and if more than 50% of those come from <1% of pixels, then it is considered to be noise-dominated and hence unusable.
| Quadrant | # 1 sec bins | Bins with >0 counts | Bins with >2000 counts | High rate bins dominated by noise | Noise dominated (total time) | Noise dominated (detector-on time) | Marked lightcurve |
|---|---|---|---|---|---|---|---|
| A | 8360 | 8311 | 202 | 202 | 2.42% | 2.43% | 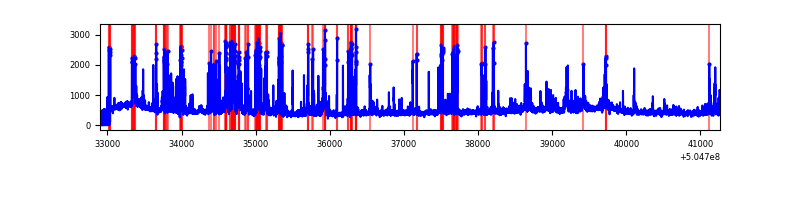 |
| B | 8365 | 8313 | 43 | 43 | 0.51% | 0.52% | 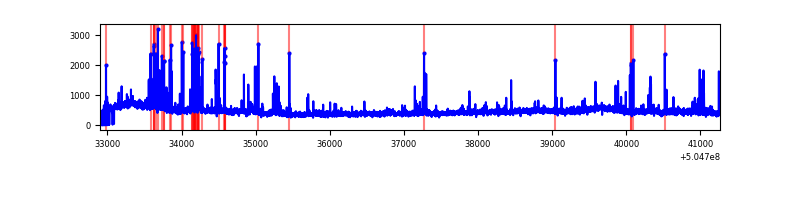 |
| C | 8345 | 8312 | 30 | 30 | 0.36% | 0.36% | 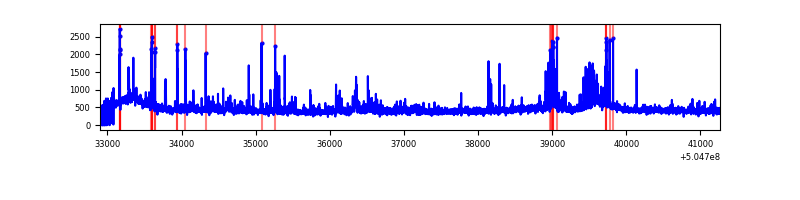 |
| D | 8355 | 8317 | 1097 | 1097 | 13.13% | 13.19% | 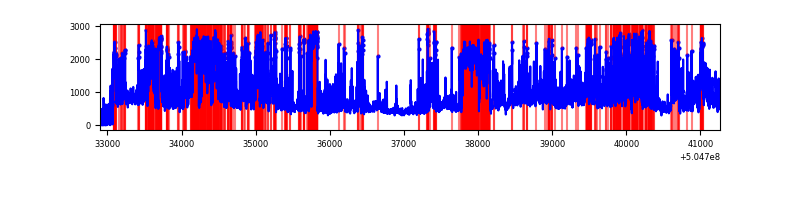 |
Top three noisy pixels from each quadrant. If the there are fewer than three noisy pixels in the level2.evt file, extra rows are filled as -1
| Pixel properties | Quadrant properties | ||||||
|---|---|---|---|---|---|---|---|
| Quadrant | DetID | PixID | Counts | Sigma | Mean | Median | Sigma |
| A | 0 | 8 | 795273 | 3621.1 | 887 | 866 | 219.4 |
| A | 3 | 78 | 253799 | 1152.93 | 887 | 866 | 219.4 |
| A | 13 | 248 | 177706 | 806.08 | 887 | 866 | 219.4 |
| B | 5 | 236 | 246761 | 1320.02 | 885 | 852 | 186.3 |
| B | 10 | 247 | 81971 | 435.44 | 885 | 852 | 186.3 |
| B | 7 | 252 | 68156 | 361.28 | 885 | 852 | 186.3 |
| C | 13 | 3 | 224111 | 931.98 | 878 | 868 | 239.5 |
| C | 9 | 38 | 151114 | 627.24 | 878 | 868 | 239.5 |
| C | 15 | 147 | 32684 | 132.82 | 878 | 868 | 239.5 |
| D | 11 | 129 | 2528547 | 10872.28 | 824 | 786 | 232.5 |
| D | 7 | 70 | 1151279 | 4948.44 | 824 | 786 | 232.5 |
| D | 6 | 239 | 709475 | 3048.18 | 824 | 786 | 232.5 |
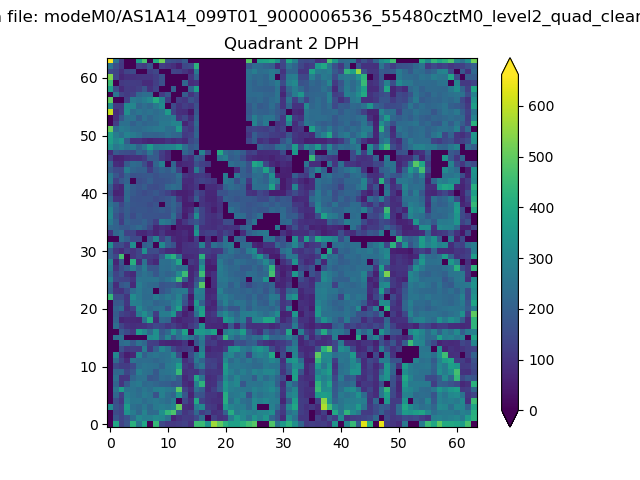
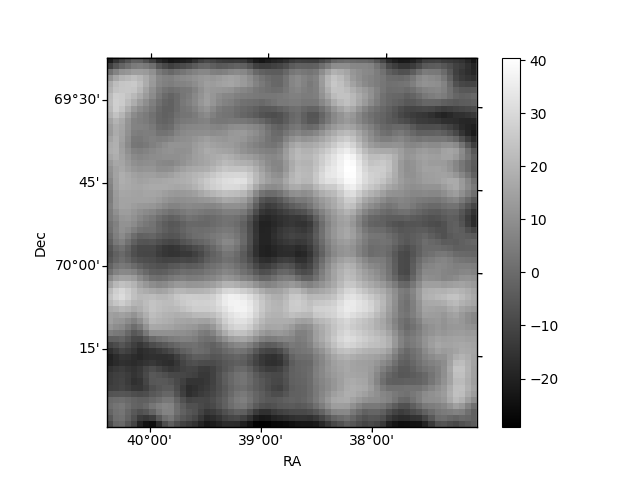
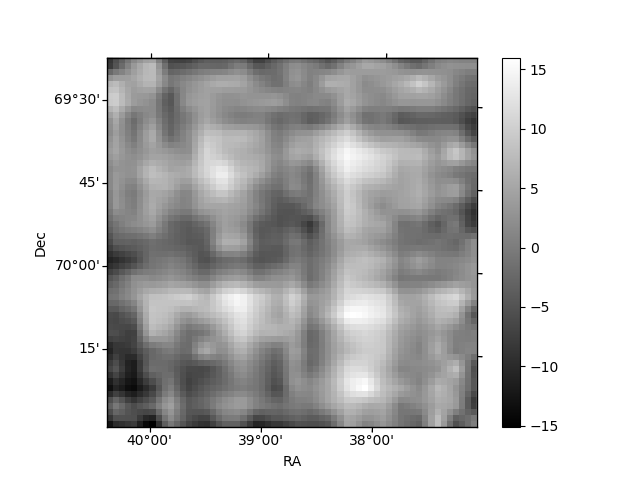
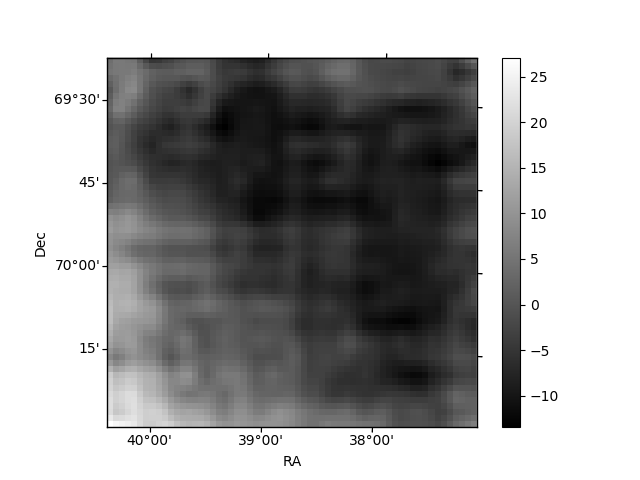
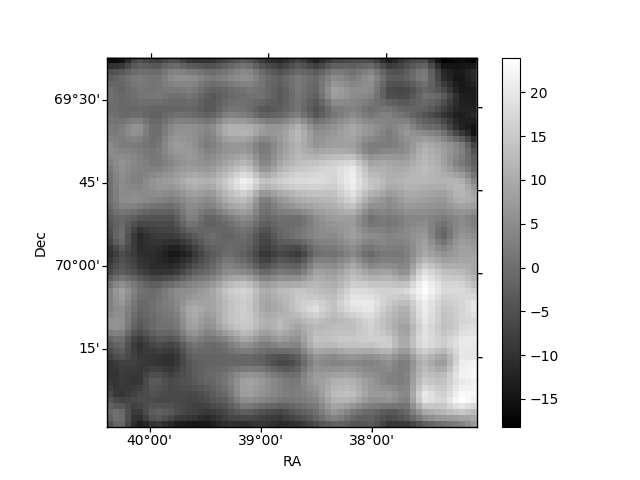
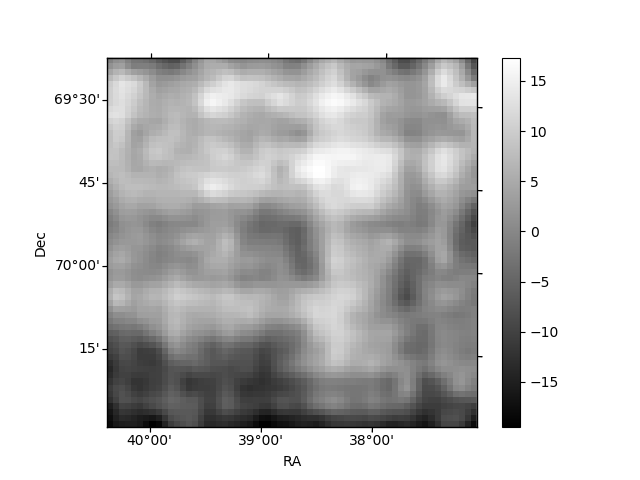
Histogram calculated using DETX and DETY for each event in the final _common_clean file
| Quadrant A | 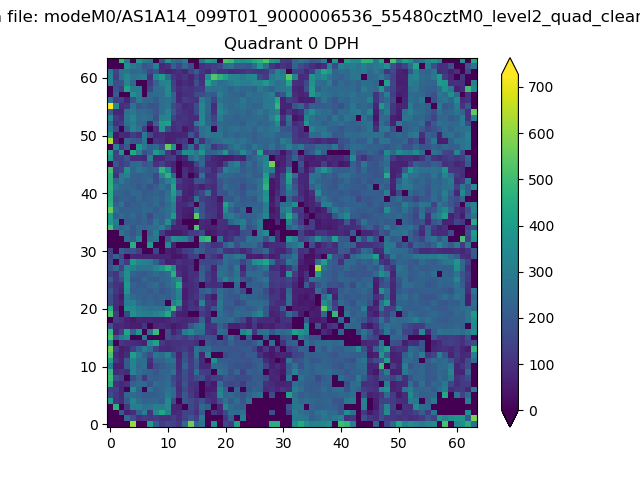 |
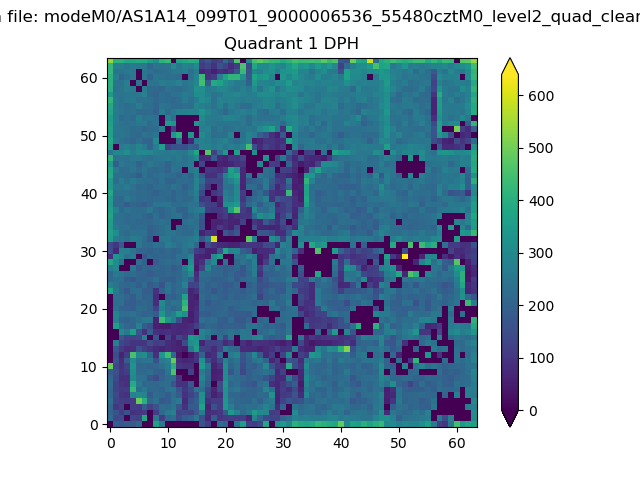 |
Quadrant B |
|---|---|---|---|
| Quadrant D | 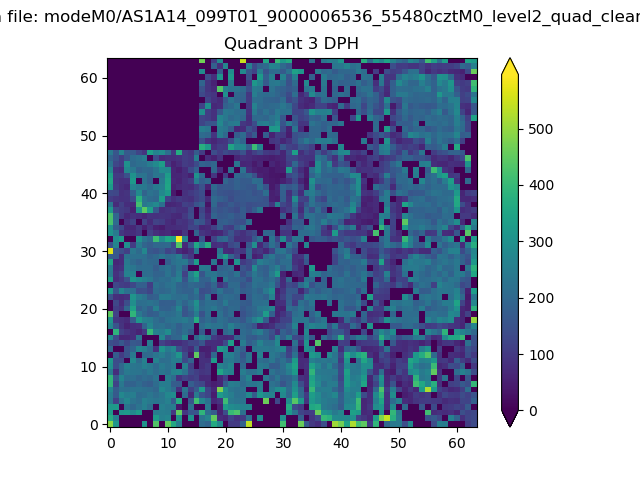 |
 |
Quadrant C |
| Plot type | Count rate plots | Images |
|---|---|---|
| Comparison with Poisson distribution Blue bars denote a histogram of data divided into 1 sec bins. Red curve is a Poisson curve with rate = median count rate of data. |
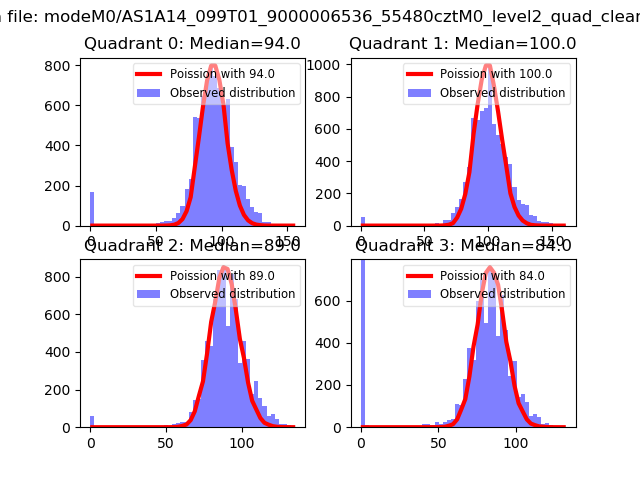 |
 |
| Quadrant-wise count rates Data is divided into 100 sec bins |
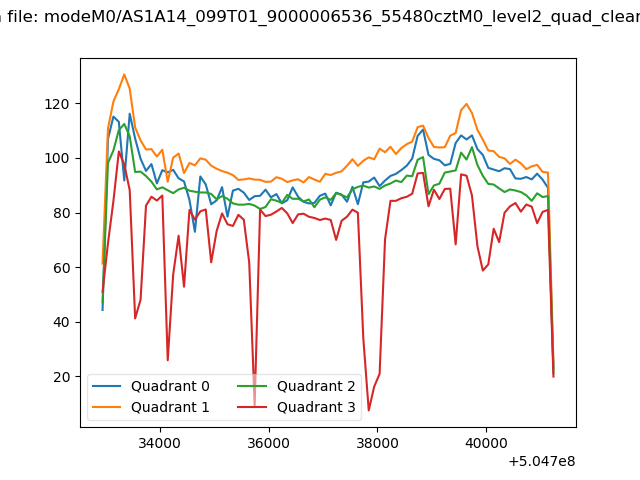 |
|
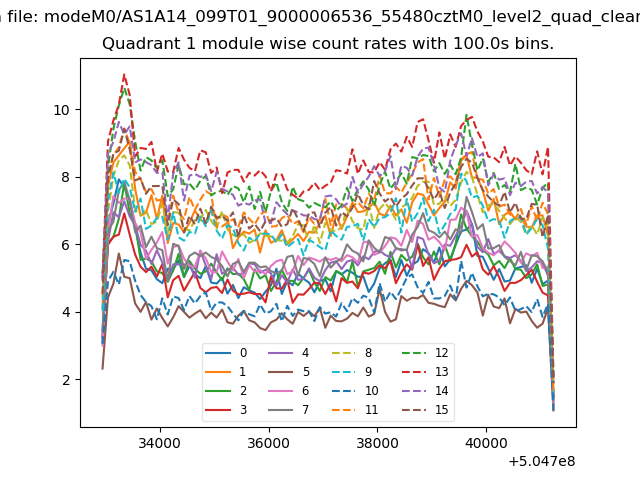
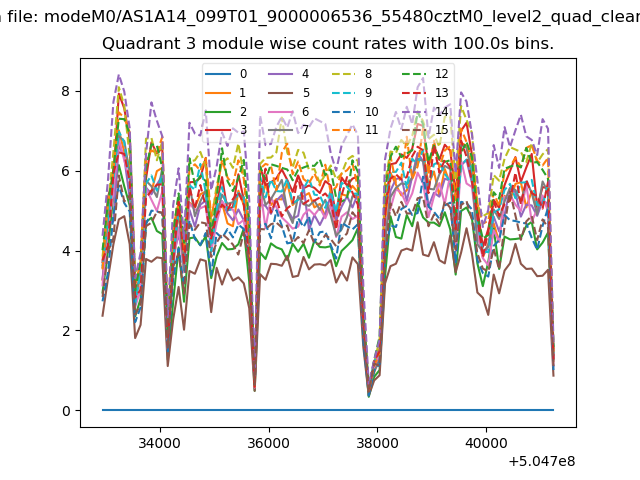
| Module-wise count rates for Quadrant A Data is divided into 100 sec bins |
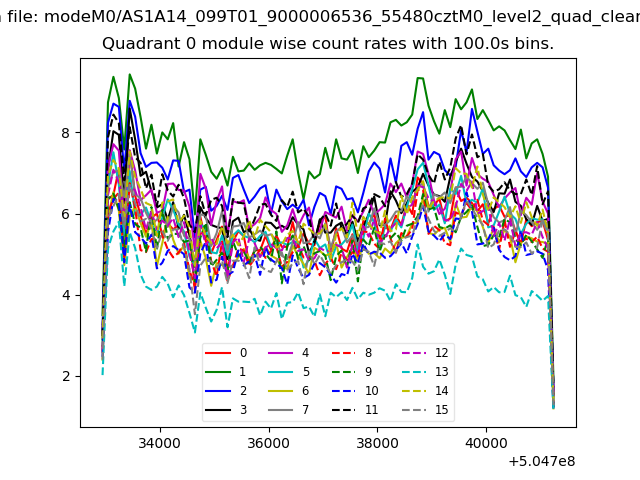 |
 |
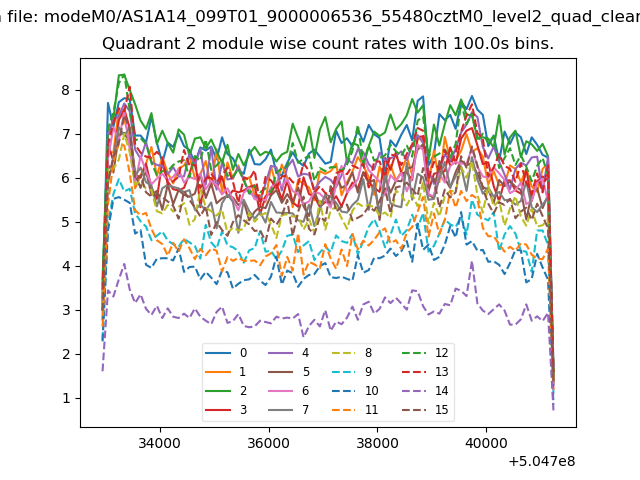
| Module-wise count rates for Quadrant B Data is divided into 100 sec bins |
 |
 |
| Module-wise count rates for Quadrant C Data is divided into 100 sec bins |
 |
 |
| Module-wise count rates for Quadrant D Data is divided into 100 sec bins |
 |
 |
| Parameter | Plot |
|---|---|
| CZT HV Monitor | 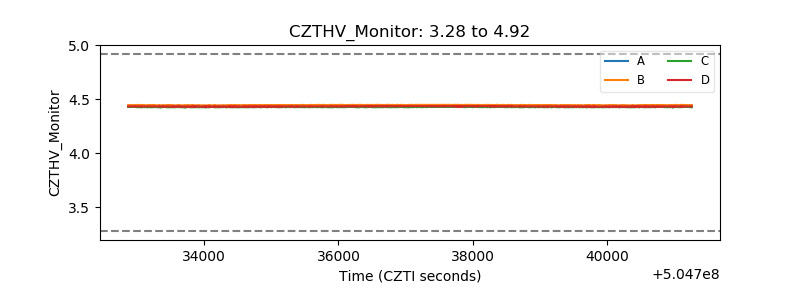 |
| D_VDD | 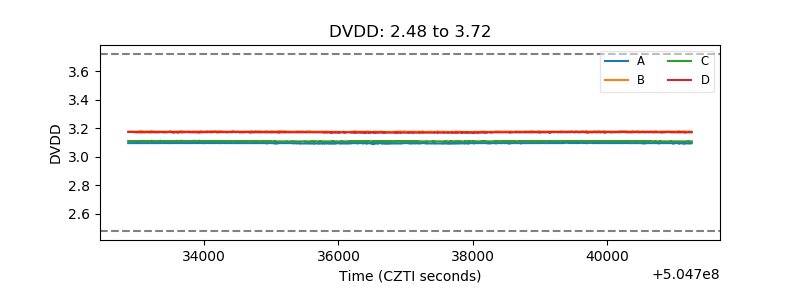 |
| Temperature 1 | 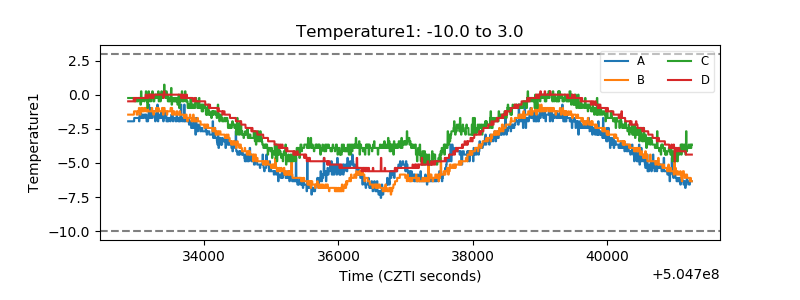 |
| Veto HV Monitor | 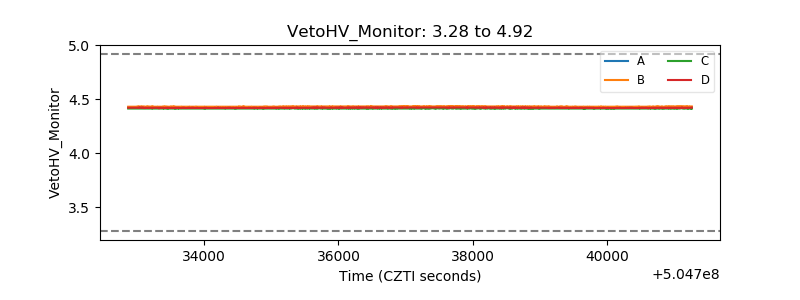 |
| Veto LLD | 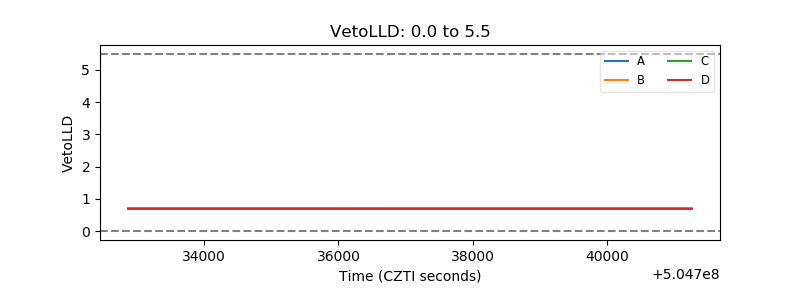 |
| Alpha Counter | 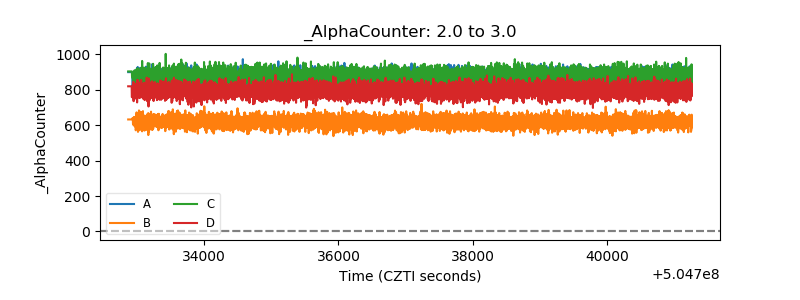 |
| _CPM_Rate | 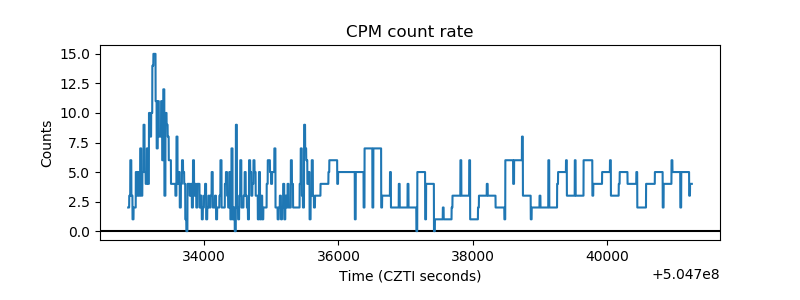 |
| CZT Counter | 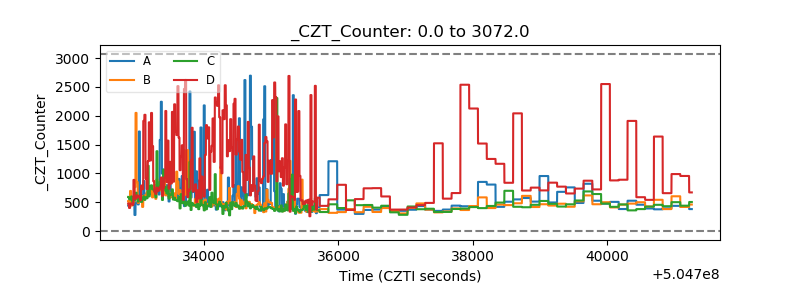 |
| +2.5 Volts monitor | 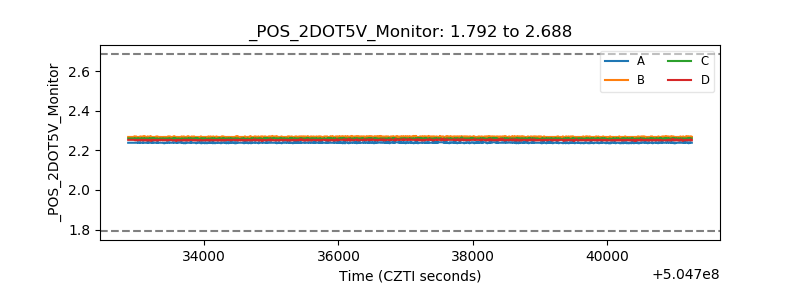 |
| +5 Volts monitor |  |
| _ROLL_ROT | 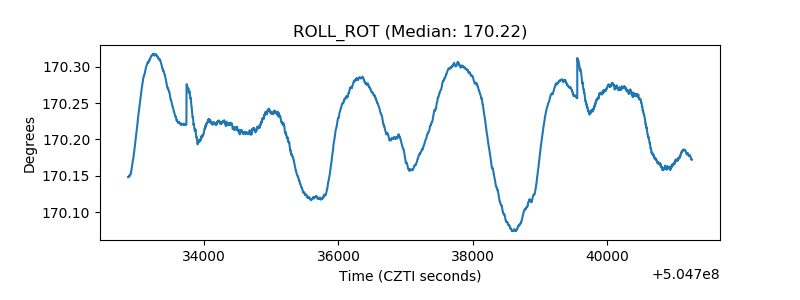 |
| _Roll_DEC | 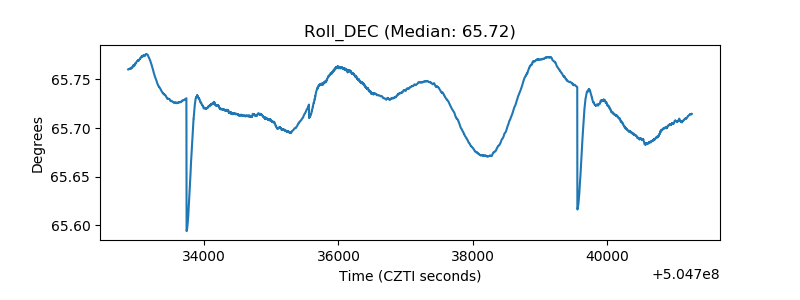 |
| _Roll_RA | 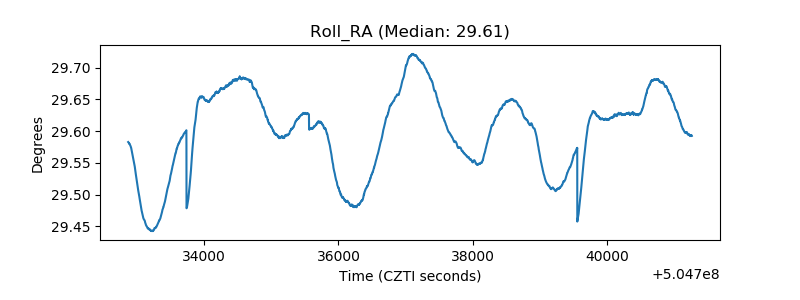 |
| Veto Counter | 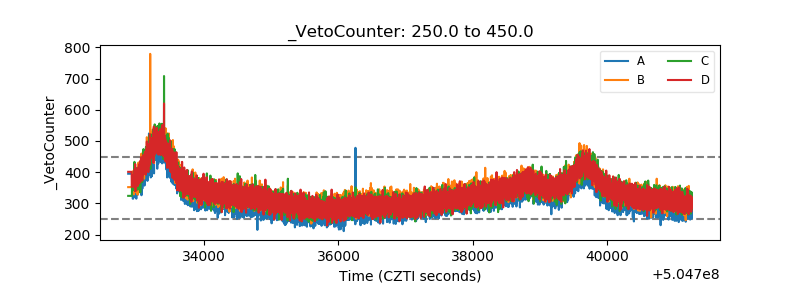 |