| Param | Original file | Final file |
|---|---|---|
| Filename | modeM0/AS1A14_099T01_9000006536_55481cztM0_level2.fits | modeM0/AS1A14_099T01_9000006536_55481cztM0_level2_quad_clean.evt |
| Size (bytes) | 551,177,280 | 112,271,040 |
| Size | 525.6 MB | 107.1 MB |
| Events in quadrant A | 4,022,701 | 745,154 |
| Events in quadrant B | 3,704,535 | 803,222 |
| Events in quadrant C | 5,044,682 | 661,163 |
| Events in quadrant D | 7,006,435 | 631,216 |
| Mode SS | |||
|---|---|---|---|
| Quadrant | BADHDUFLAG | Total packets | Discarded packets |
| A | 0 | 164 | 4 |
| B | 0 | 164 | 4 |
| C | 0 | 164 | 2 |
| D | 0 | 164 | 4 |
| Mode M0 | |||
|---|---|---|---|
| Quadrant | BADHDUFLAG | Total packets | Discarded packets |
| A | 0 | 18405 | 334 |
| B | 0 | 17325 | 290 |
| C | 0 | 21625 | 449 |
| D | 0 | 27377 | 735 |
| Quadrant | Total seconds | Saturated seconds | Saturation percentage |
|---|---|---|---|
| A | 8044 | 139 | 1.727996% |
| B | 8043 | 36 | 0.447594% |
| C | 8040 | 658 | 8.184080% |
| D | 8021 | 747 | 9.313053% |
Noise dominated data is calculated using 1-second bins in cleaned event files. If a bin has >2000 counts, and if more than 50% of those come from <1% of pixels, then it is considered to be noise-dominated and hence unusable.
| Quadrant | # 1 sec bins | Bins with >0 counts | Bins with >2000 counts | High rate bins dominated by noise | Noise dominated (total time) | Noise dominated (detector-on time) | Marked lightcurve |
|---|---|---|---|---|---|---|---|
| A | 8148 | 8081 | 89 | 89 | 1.09% | 1.10% | 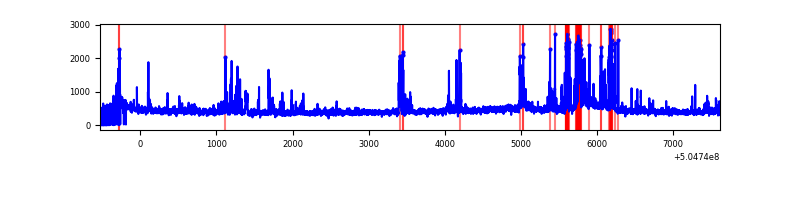 |
| B | 8143 | 8076 | 12 | 12 | 0.15% | 0.15% | 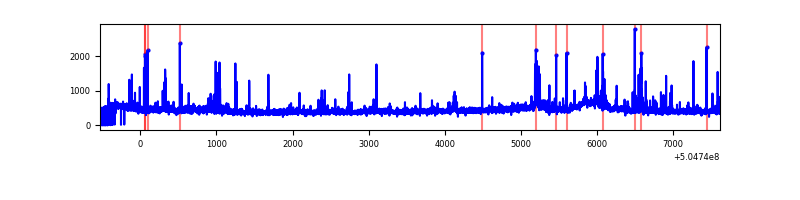 |
| C | 8143 | 8074 | 519 | 519 | 6.37% | 6.43% | 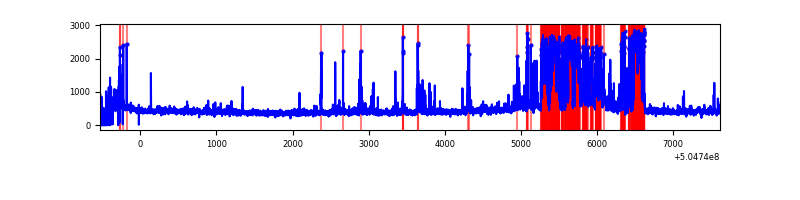 |
| D | 8082 | 8051 | 689 | 689 | 8.53% | 8.56% | 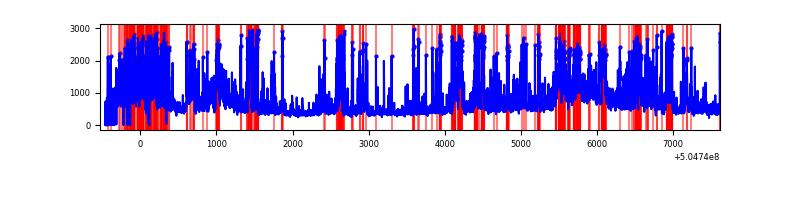 |
Top three noisy pixels from each quadrant. If the there are fewer than three noisy pixels in the level2.evt file, extra rows are filled as -1
| Pixel properties | Quadrant properties | ||||||
|---|---|---|---|---|---|---|---|
| Quadrant | DetID | PixID | Counts | Sigma | Mean | Median | Sigma |
| A | 8 | 63 | 154301 | 730.88 | 845 | 824 | 210.0 |
| A | 0 | 8 | 149193 | 706.56 | 845 | 824 | 210.0 |
| A | 3 | 45 | 130330 | 616.73 | 845 | 824 | 210.0 |
| B | 5 | 236 | 93132 | 516.85 | 841 | 810 | 178.6 |
| B | 10 | 247 | 69463 | 384.35 | 841 | 810 | 178.6 |
| B | 7 | 252 | 66328 | 366.79 | 841 | 810 | 178.6 |
| C | 13 | 3 | 1642296 | 7489.01 | 801 | 792 | 219.2 |
| C | 12 | 252 | 101993 | 461.71 | 801 | 792 | 219.2 |
| C | 1 | 16 | 42925 | 192.22 | 801 | 792 | 219.2 |
| D | 11 | 129 | 1887493 | 8378.11 | 795 | 757 | 225.2 |
| D | 6 | 239 | 522853 | 2318.38 | 795 | 757 | 225.2 |
| D | 2 | 249 | 319626 | 1415.95 | 795 | 757 | 225.2 |
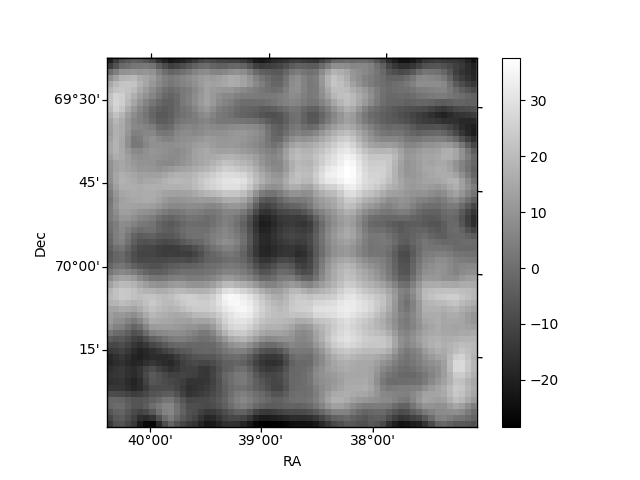
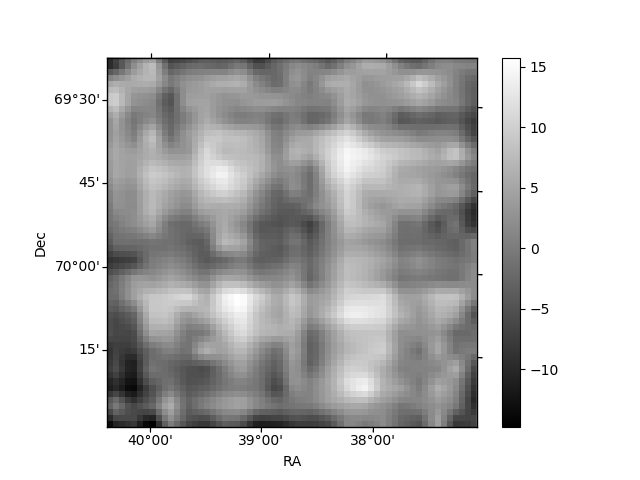
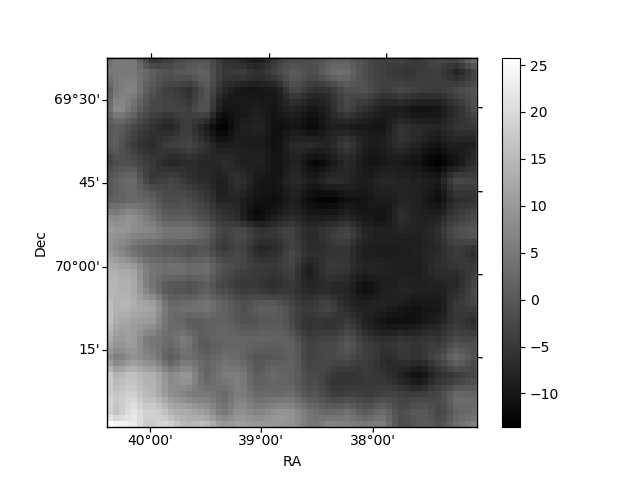
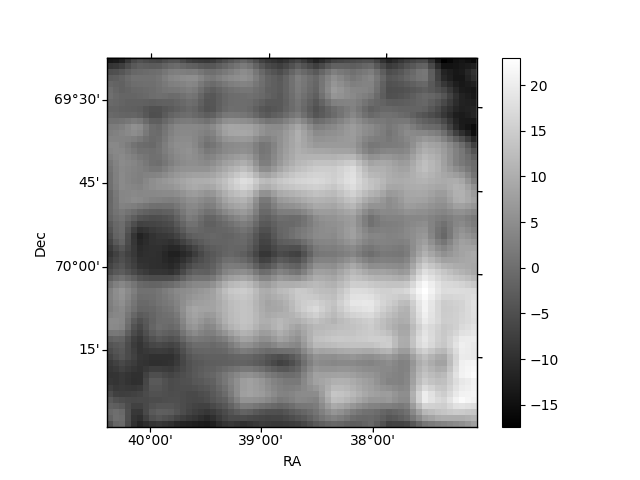
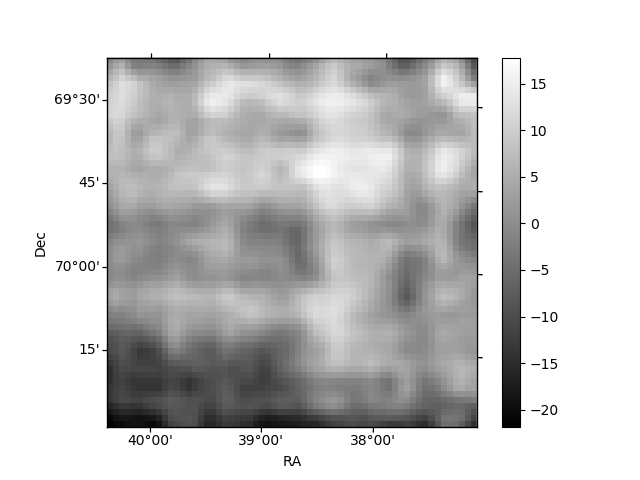
Histogram calculated using DETX and DETY for each event in the final _common_clean file
| Quadrant A | 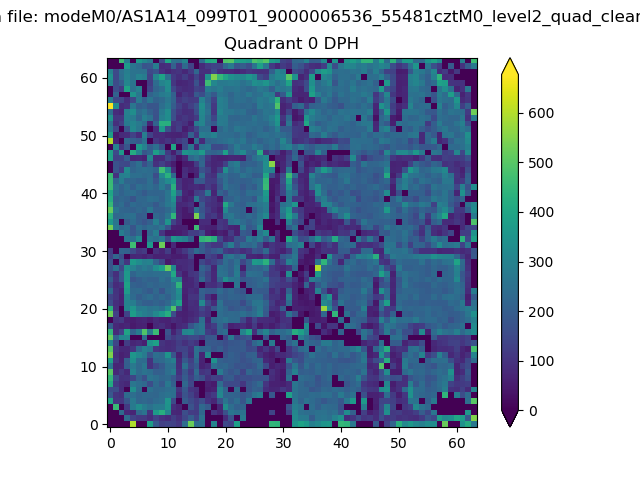 |
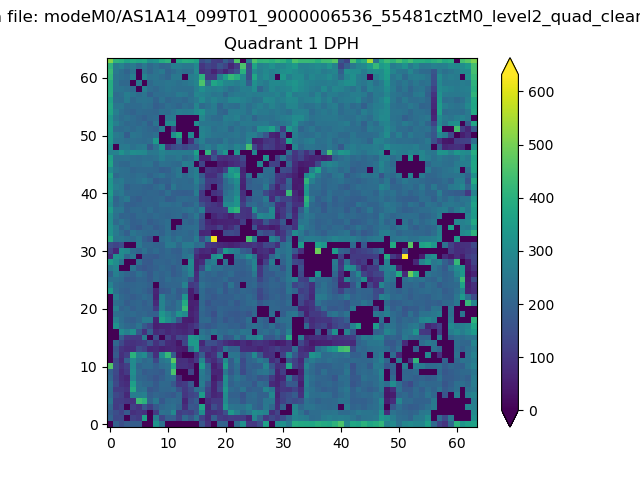 |
Quadrant B |
|---|---|---|---|
| Quadrant D | 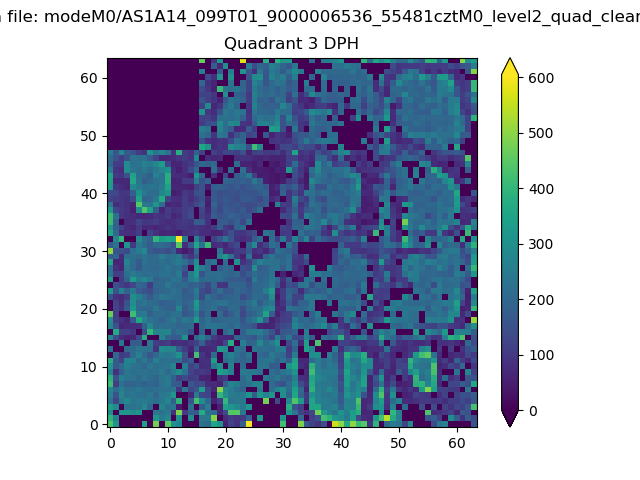 |
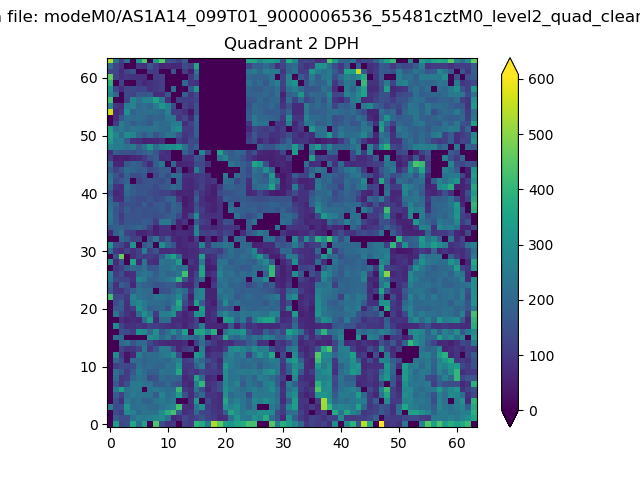 |
Quadrant C |
| Plot type | Count rate plots | Images |
|---|---|---|
| Comparison with Poisson distribution Blue bars denote a histogram of data divided into 1 sec bins. Red curve is a Poisson curve with rate = median count rate of data. |
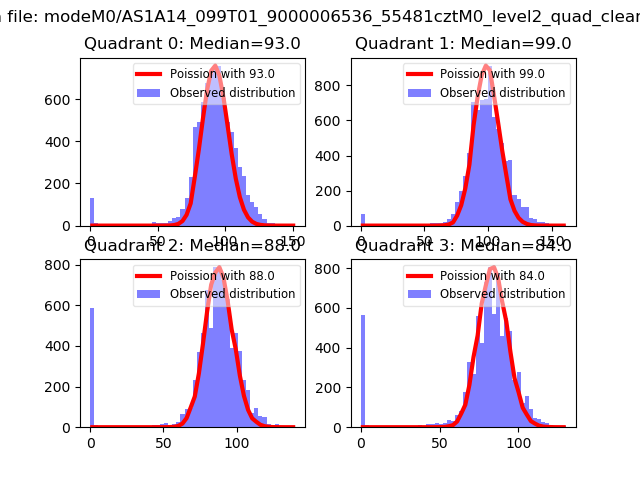 |
 |
| Quadrant-wise count rates Data is divided into 100 sec bins |
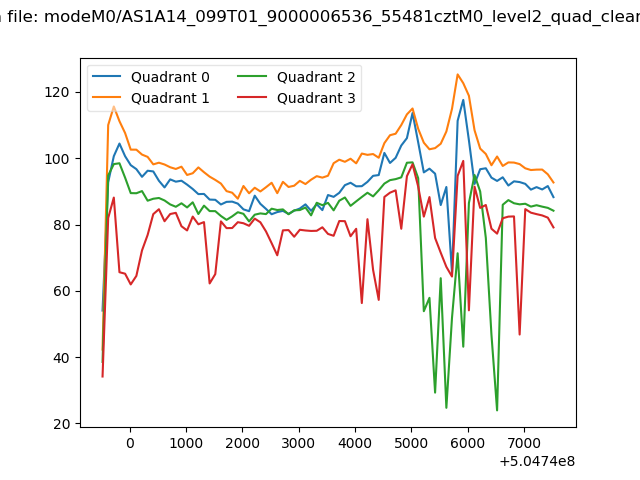 |
|
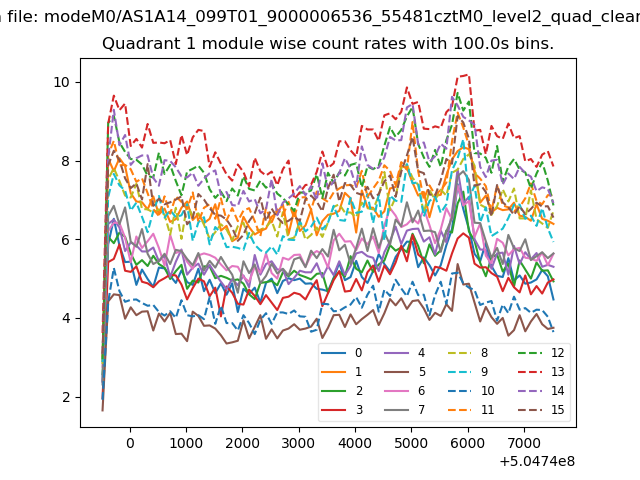
| Module-wise count rates for Quadrant A Data is divided into 100 sec bins |
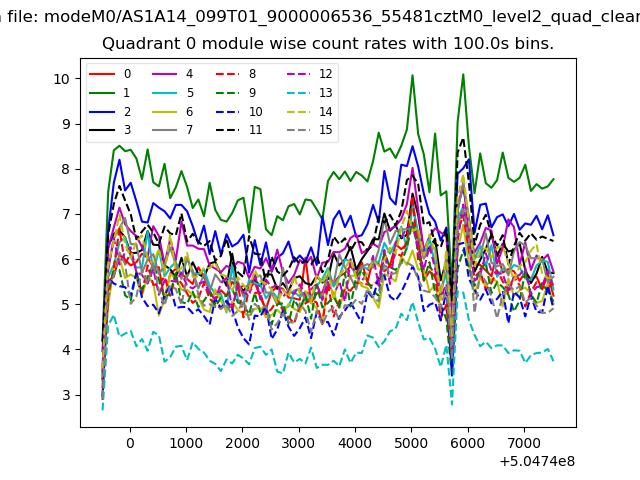 |
 |
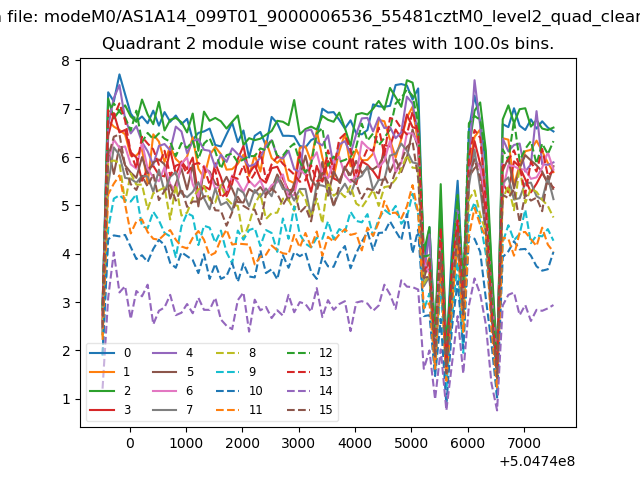
| Module-wise count rates for Quadrant B Data is divided into 100 sec bins |
 |
 |
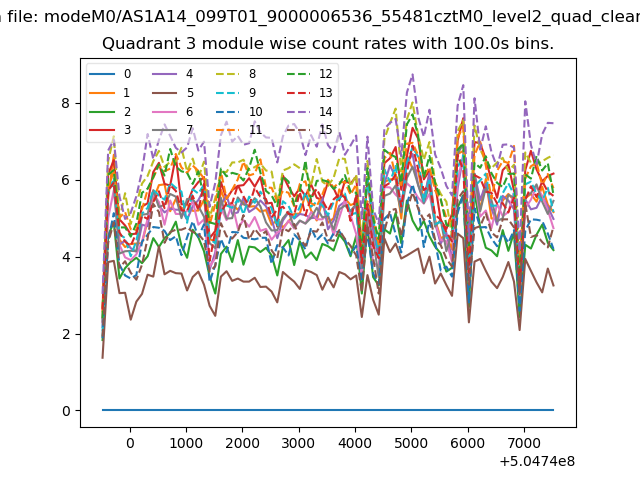
| Module-wise count rates for Quadrant C Data is divided into 100 sec bins |
 |
 |
| Module-wise count rates for Quadrant D Data is divided into 100 sec bins |
 |
 |
| Parameter | Plot |
|---|---|
| CZT HV Monitor | 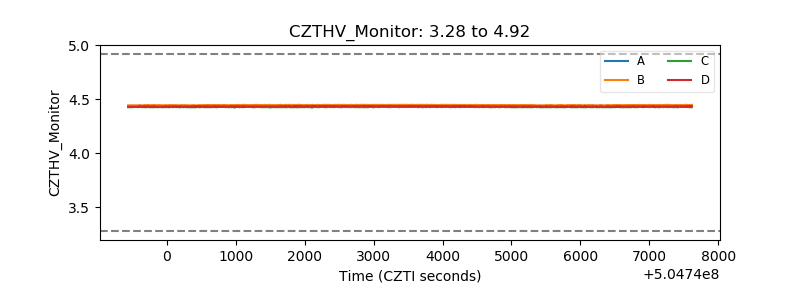 |
| D_VDD | 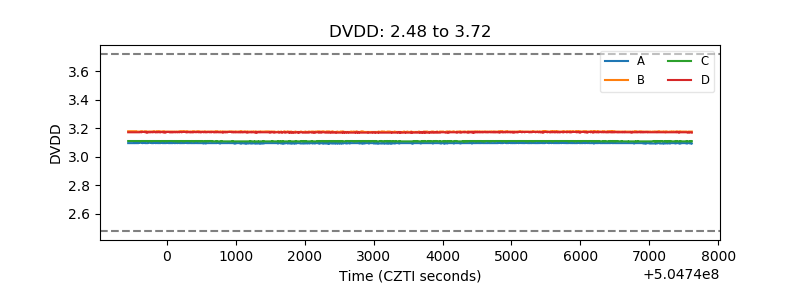 |
| Temperature 1 | 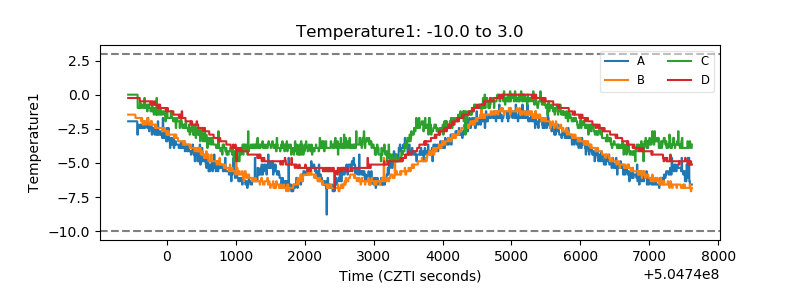 |
| Veto HV Monitor | 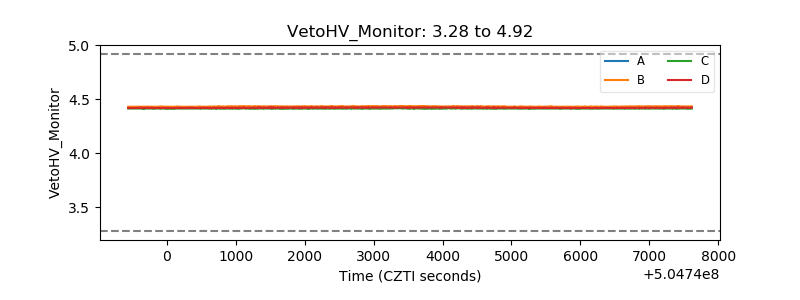 |
| Veto LLD | 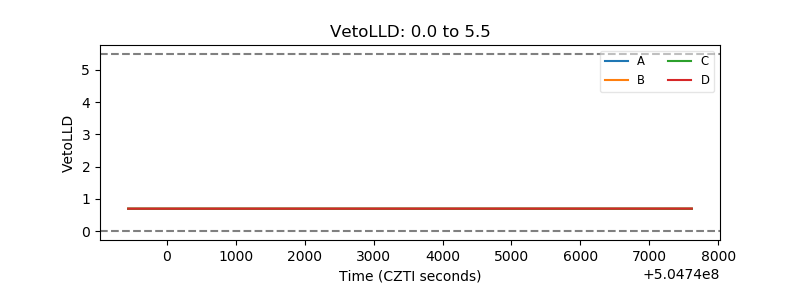 |
| Alpha Counter | 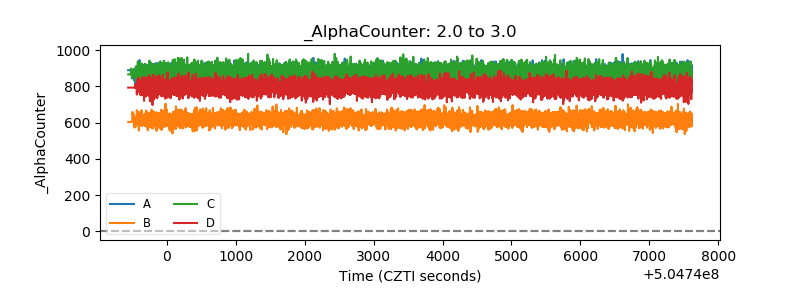 |
| _CPM_Rate | 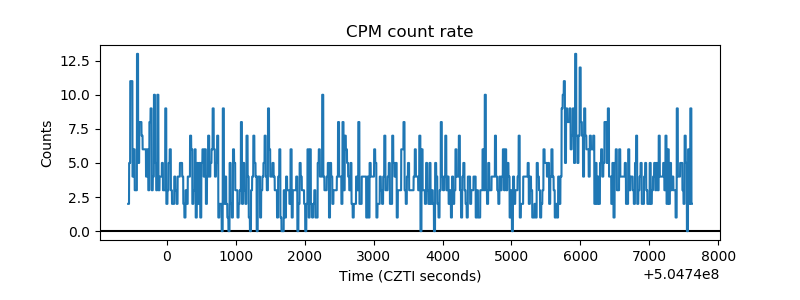 |
| CZT Counter | 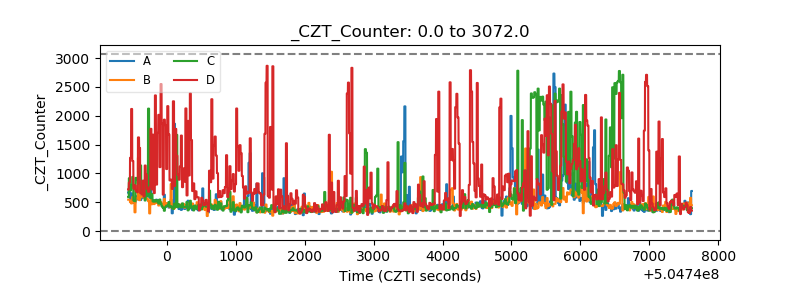 |
| +2.5 Volts monitor | 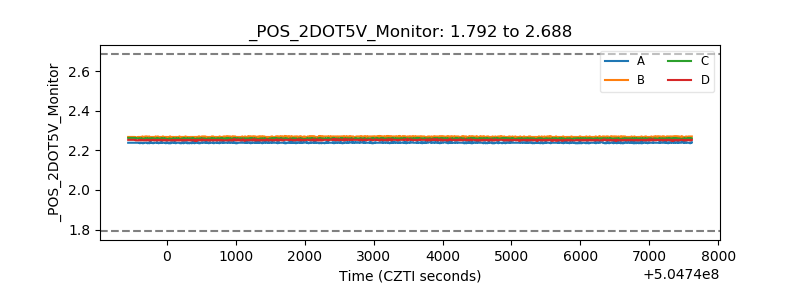 |
| +5 Volts monitor | 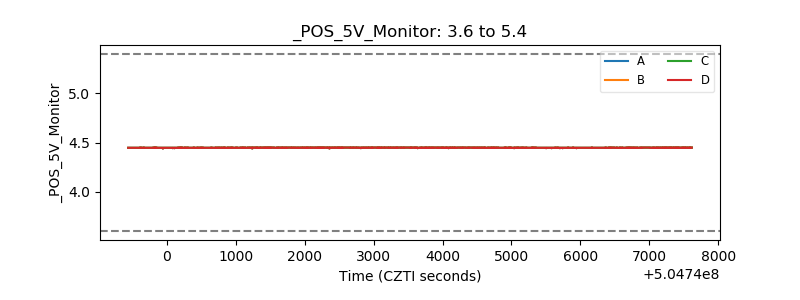 |
| _ROLL_ROT | 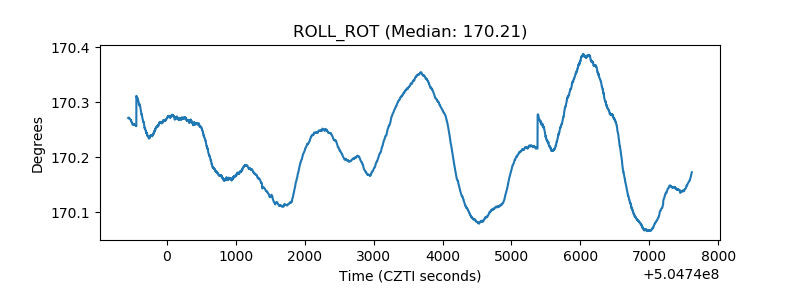 |
| _Roll_DEC | 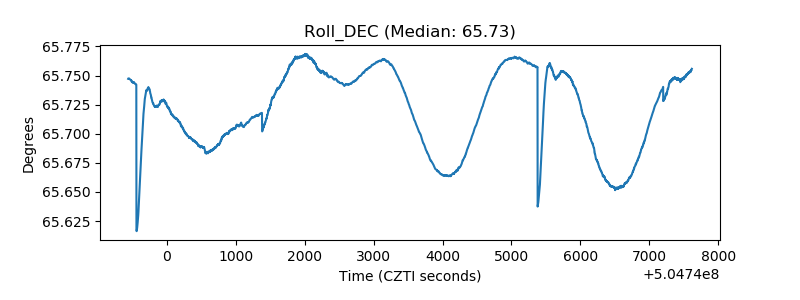 |
| _Roll_RA | 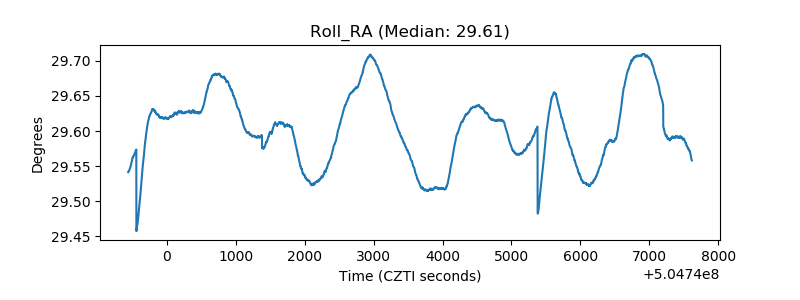 |
| Veto Counter | 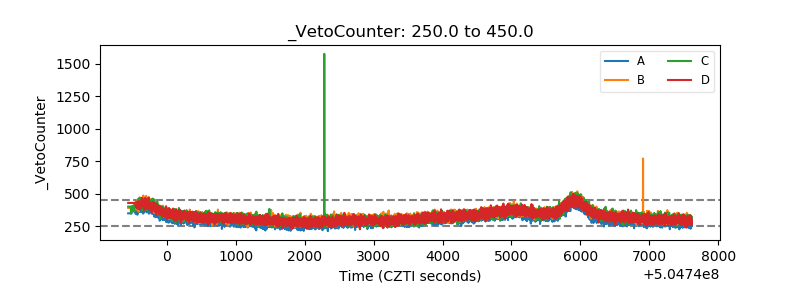 |