| Param | Original file | Final file |
|---|---|---|
| Filename | modeM0/AS1A14_099T01_9000006536_55484cztM0_level2.fits | modeM0/AS1A14_099T01_9000006536_55484cztM0_level2_quad_clean.evt |
| Size (bytes) | 871,934,400 | 211,429,440 |
| Size | 831.5 MB | 201.6 MB |
| Events in quadrant A | 10,187,449 | 1,778,671 |
| Events in quadrant B | 8,871,195 | 1,929,806 |
| Events in quadrant C | 12,065,863 | 1,655,872 |
| Events in quadrant D | 11,277 | 23 |
| Mode M9 | |||
|---|---|---|---|
| Quadrant | BADHDUFLAG | Total packets | Discarded packets |
| A | 0 | 15 | 0 |
| B | 0 | 15 | 0 |
| C | 0 | 15 | 0 |
| D | 0 | 15 | 0 |
| Mode SS | |||
|---|---|---|---|
| Quadrant | BADHDUFLAG | Total packets | Discarded packets |
| A | 0 | 398 | 0 |
| B | 0 | 398 | 0 |
| C | 0 | 398 | 0 |
| D | 0 | 398 | 0 |
| Mode M0 | |||
|---|---|---|---|
| Quadrant | BADHDUFLAG | Total packets | Discarded packets |
| A | 0 | 44891 | 3 |
| B | 0 | 41121 | 3 |
| C | 0 | 49938 | 3 |
| D | 0 | 48 | 1 |
| Quadrant | Total seconds | Saturated seconds | Saturation percentage |
|---|---|---|---|
| A | 19609 | 397 | 2.024581% |
| B | 19609 | 197 | 1.004641% |
| C | 19609 | 770 | 3.926768% |
| D | 20 | 0 | 0.000000% |
Noise dominated data is calculated using 1-second bins in cleaned event files. If a bin has >2000 counts, and if more than 50% of those come from <1% of pixels, then it is considered to be noise-dominated and hence unusable.
| Quadrant | # 1 sec bins | Bins with >0 counts | Bins with >2000 counts | High rate bins dominated by noise | Noise dominated (total time) | Noise dominated (detector-on time) | Marked lightcurve |
|---|---|---|---|---|---|---|---|
| A | 21033 | 19610 | 272 | 272 | 1.29% | 1.39% | 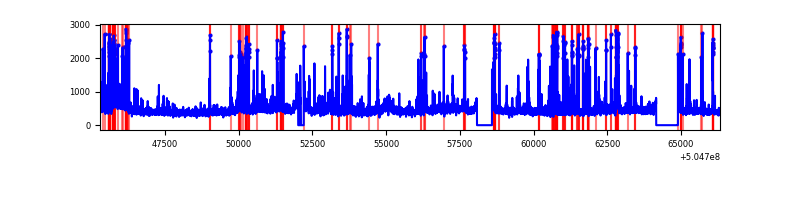 |
| B | 21033 | 19610 | 29 | 29 | 0.14% | 0.15% | 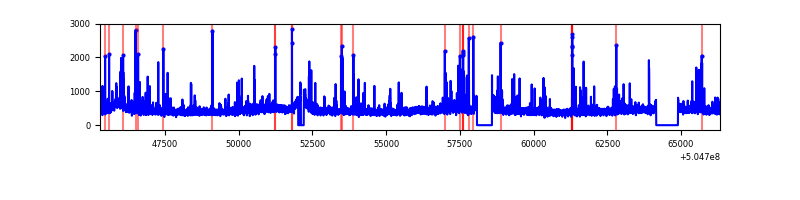 |
| C | 21033 | 19610 | 577 | 577 | 2.74% | 2.94% | 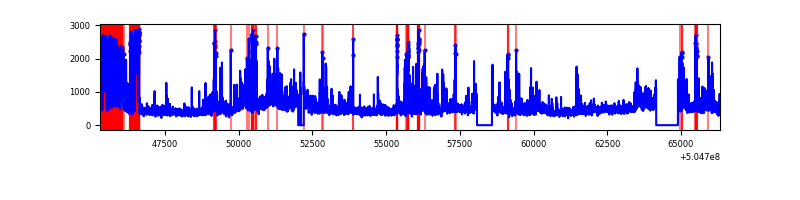 |
| D | 20 | 20 | 0 | 0 | 0.00% | 0.00% |  |
Top three noisy pixels from each quadrant. If the there are fewer than three noisy pixels in the level2.evt file, extra rows are filled as -1
| Pixel properties | Quadrant properties | ||||||
|---|---|---|---|---|---|---|---|
| Quadrant | DetID | PixID | Counts | Sigma | Mean | Median | Sigma |
| A | 0 | 8 | 1001704 | 1965.56 | 2058 | 2002 | 508.6 |
| A | 3 | 78 | 545677 | 1068.94 | 2058 | 2002 | 508.6 |
| A | 13 | 248 | 198189 | 385.73 | 2058 | 2002 | 508.6 |
| B | 10 | 247 | 143794 | 326.23 | 2048 | 1967 | 434.7 |
| B | 5 | 236 | 123117 | 278.67 | 2048 | 1967 | 434.7 |
| B | 4 | 206 | 121419 | 274.76 | 2048 | 1967 | 434.7 |
| C | 13 | 3 | 1901615 | 3523.29 | 1987 | 1970 | 539.2 |
| C | 9 | 38 | 1315270 | 2435.79 | 1987 | 1970 | 539.2 |
| C | 12 | 252 | 644650 | 1191.98 | 1987 | 1970 | 539.2 |
| D | 11 | 129 | 2079 | 1567.05 | 2 | 2 | 1.3 |
| D | 5 | 173 | 245 | 183.34 | 2 | 2 | 1.3 |
| D | 8 | 240 | 92 | 67.9 | 2 | 2 | 1.3 |
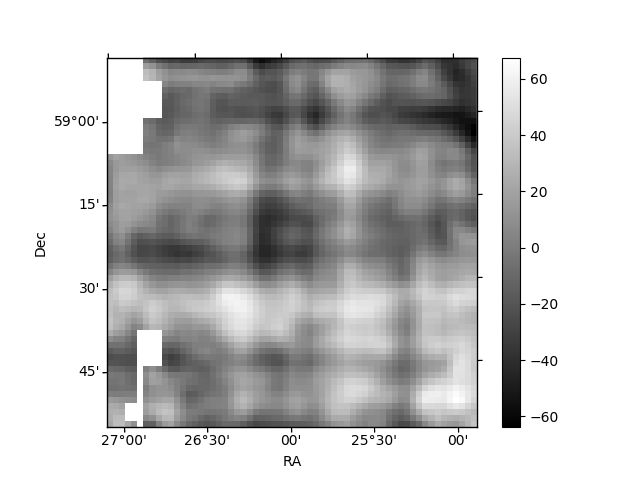
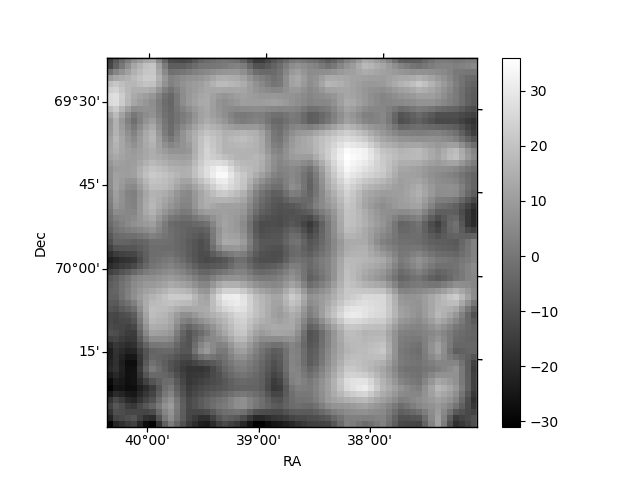
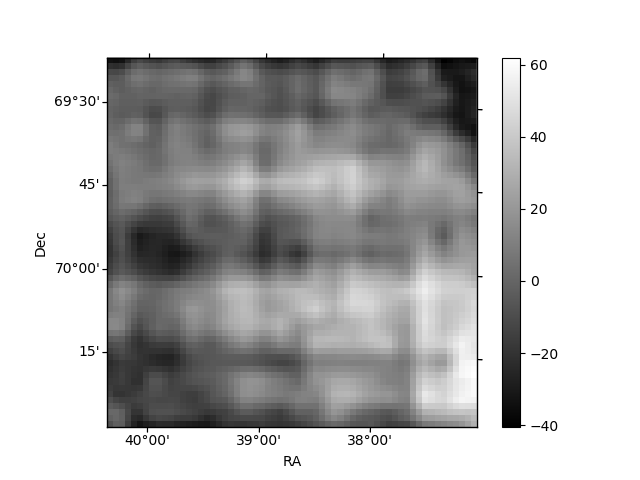
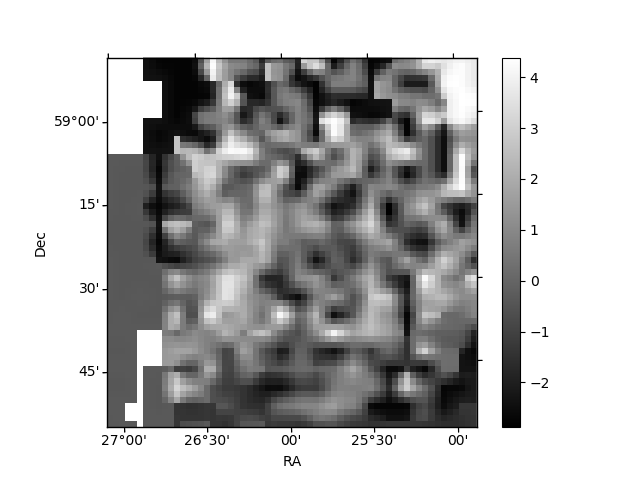
Histogram calculated using DETX and DETY for each event in the final _common_clean file
| Quadrant A | 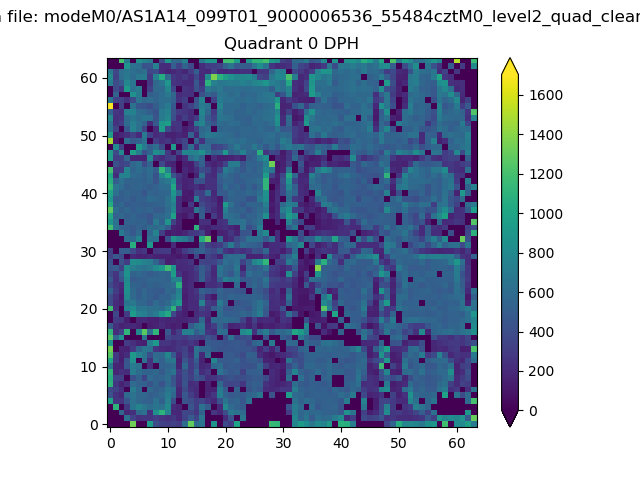 |
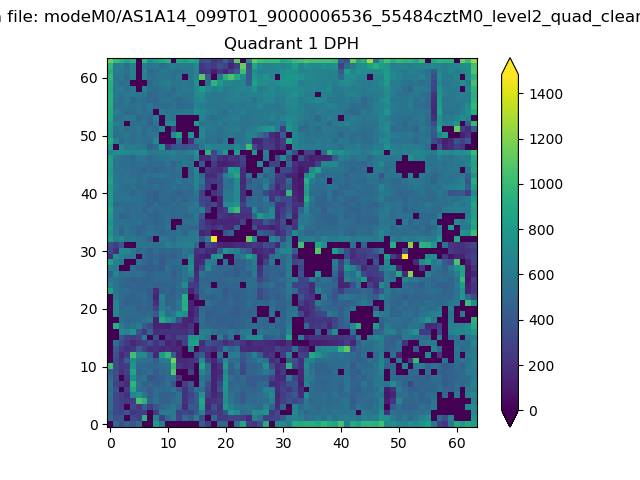 |
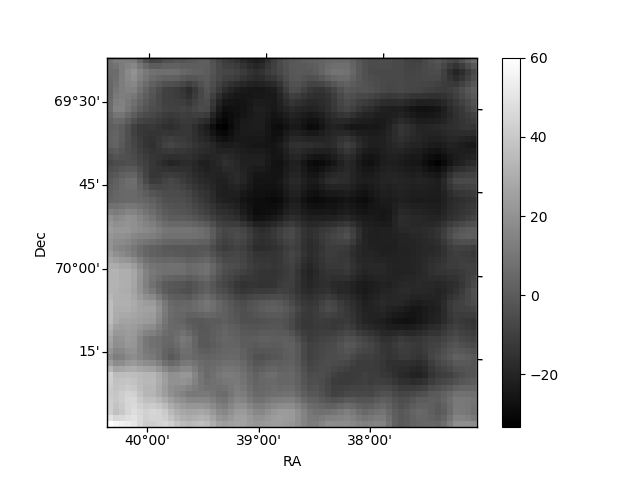
Quadrant B |
|---|---|---|---|
| Quadrant D | 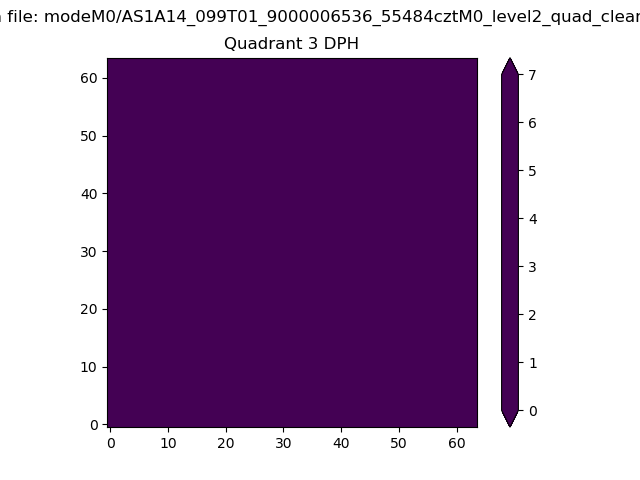 |
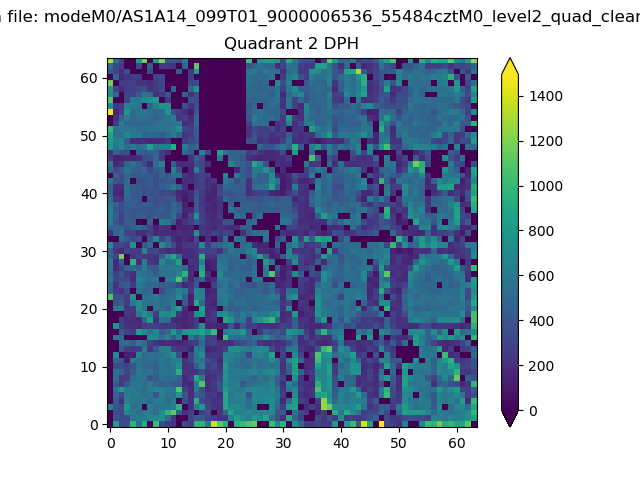 |
Quadrant C |
| Plot type | Count rate plots | Images |
|---|---|---|
| Comparison with Poisson distribution Blue bars denote a histogram of data divided into 1 sec bins. Red curve is a Poisson curve with rate = median count rate of data. |
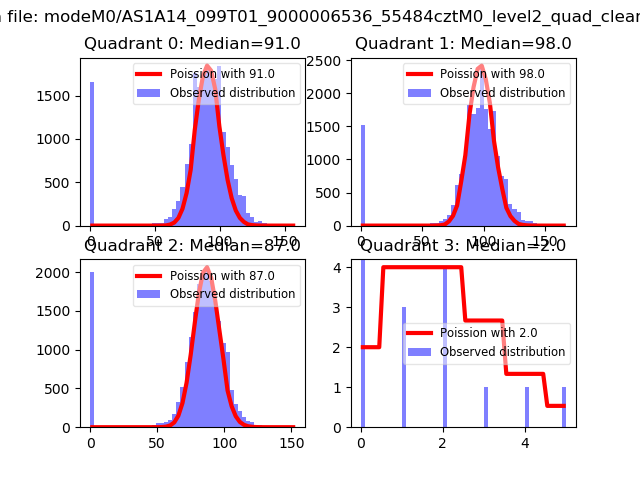 |
 |
| Quadrant-wise count rates Data is divided into 100 sec bins |
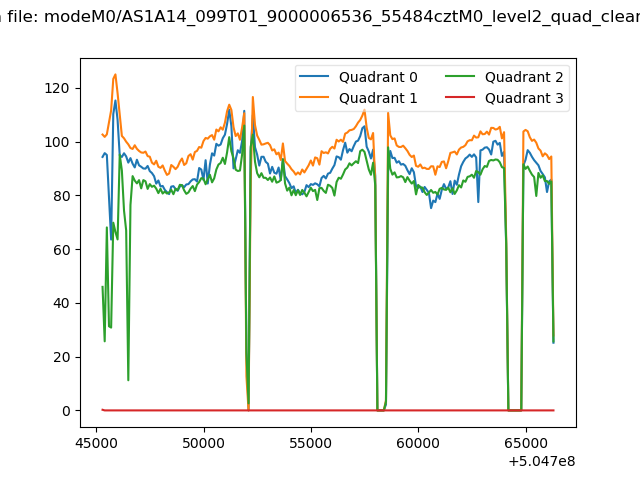 |
|
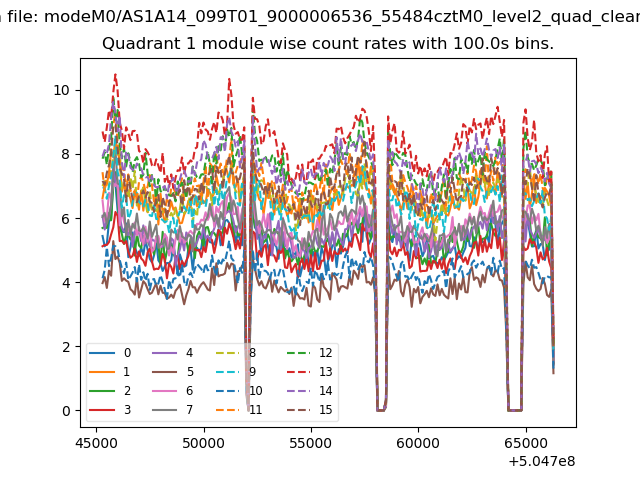
| Module-wise count rates for Quadrant A Data is divided into 100 sec bins |
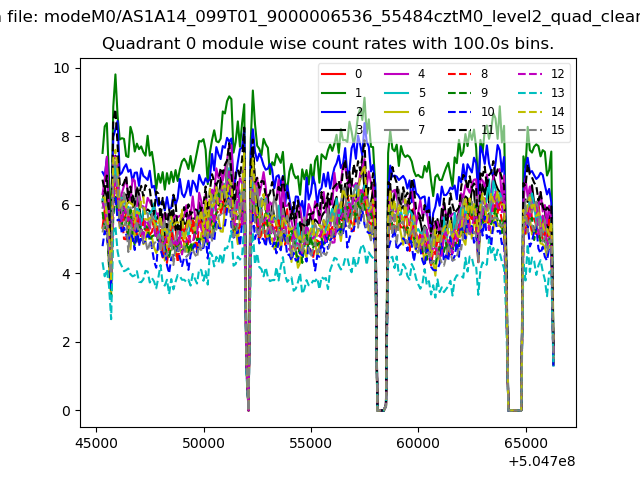 |
 |
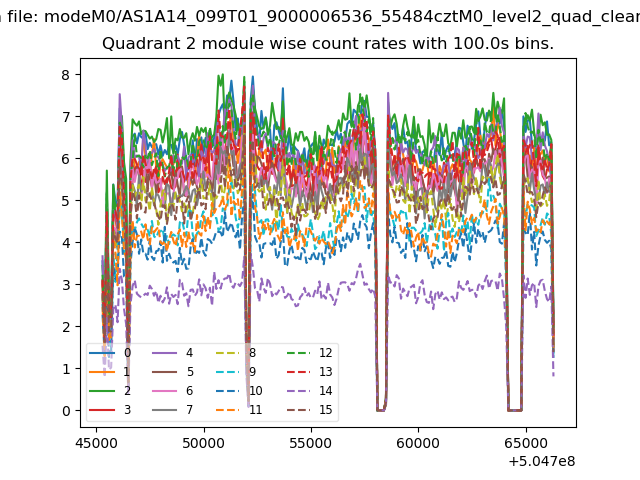
| Module-wise count rates for Quadrant B Data is divided into 100 sec bins |
 |
 |
| Module-wise count rates for Quadrant C Data is divided into 100 sec bins |
 |
 |
| Module-wise count rates for Quadrant D Data is divided into 100 sec bins |
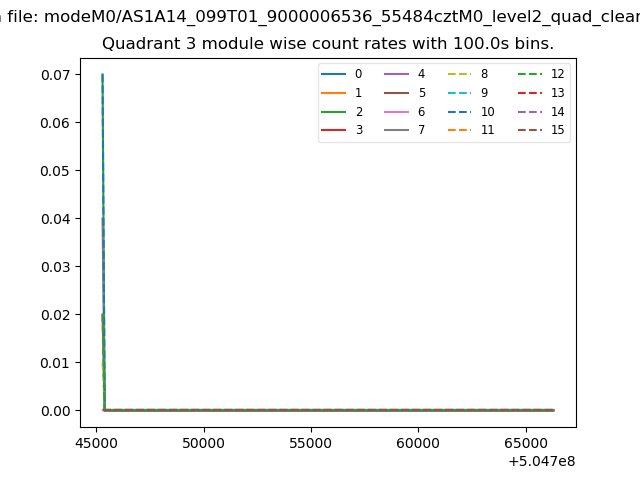 |
 |
| Parameter | Plot |
|---|---|
| CZT HV Monitor | 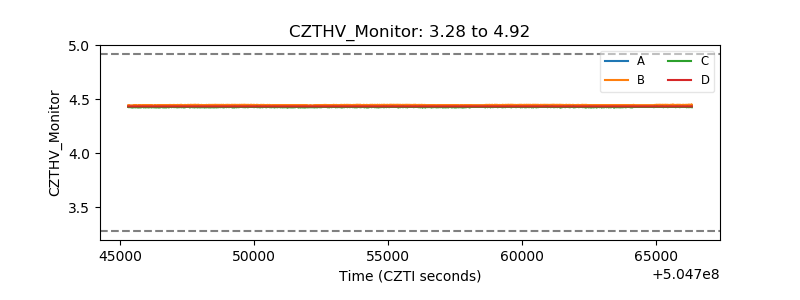 |
| D_VDD | 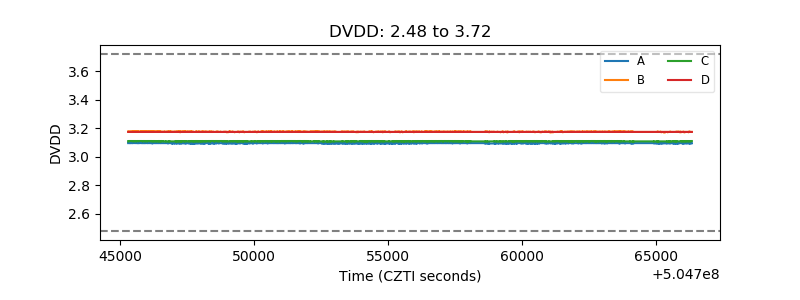 |
| Temperature 1 | 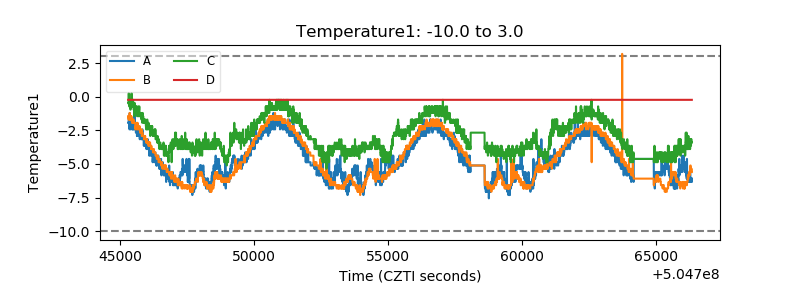 |
| Veto HV Monitor | 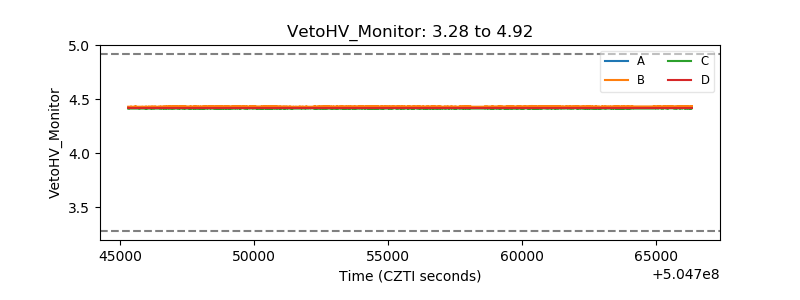 |
| Veto LLD | 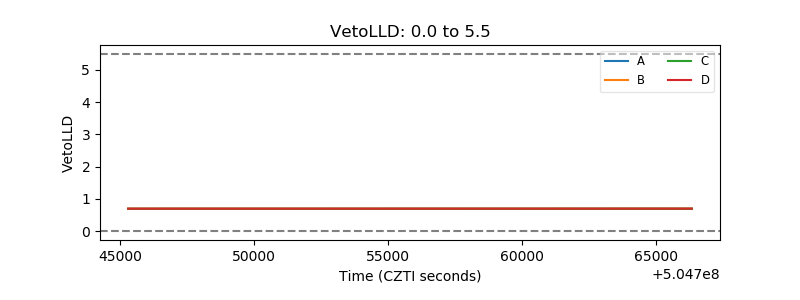 |
| Alpha Counter | 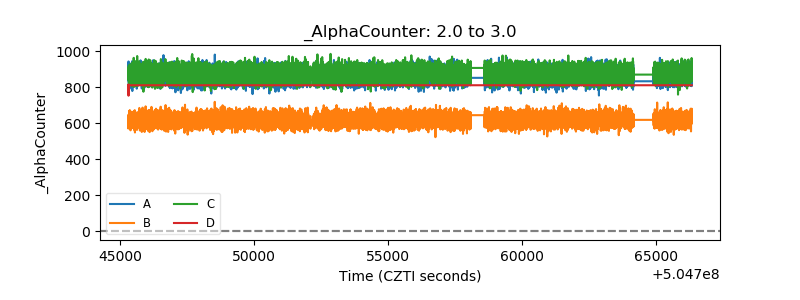 |
| _CPM_Rate | 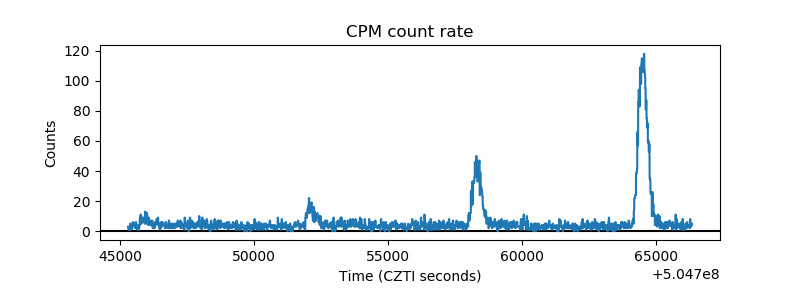 |
| CZT Counter | 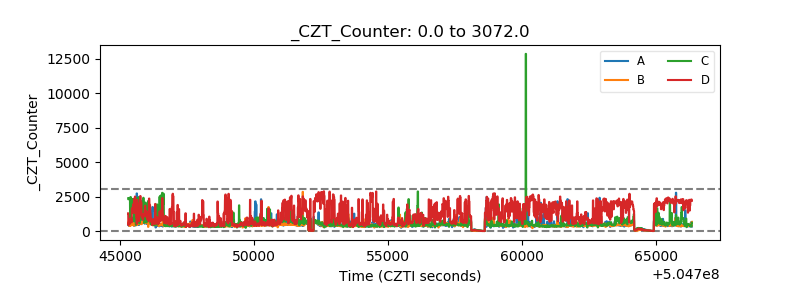 |
| +2.5 Volts monitor | 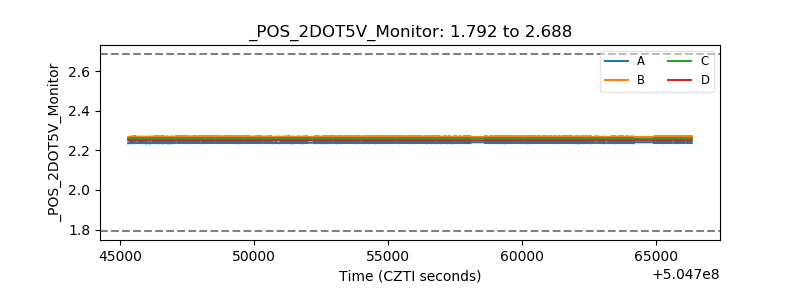 |
| +5 Volts monitor | 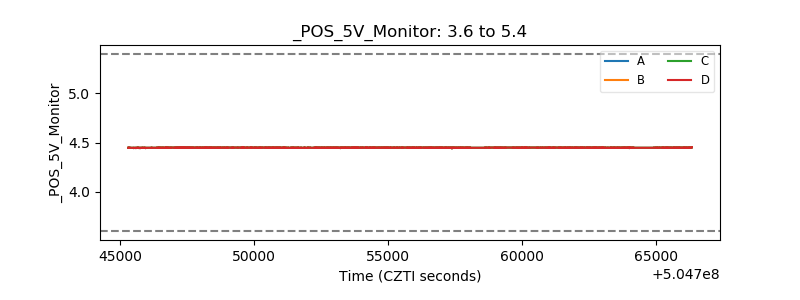 |
| _ROLL_ROT | 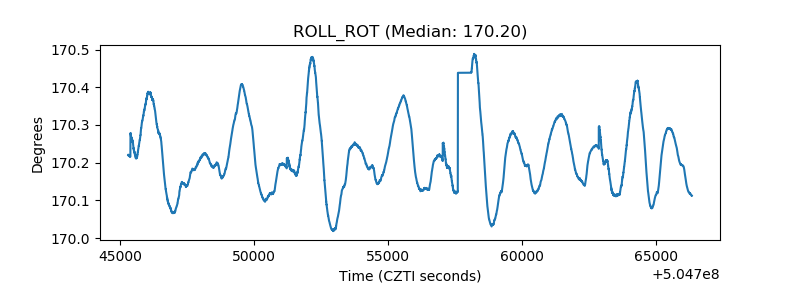 |
| _Roll_DEC | 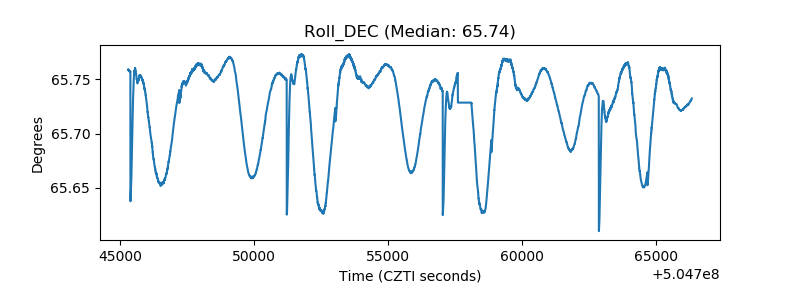 |
| _Roll_RA | 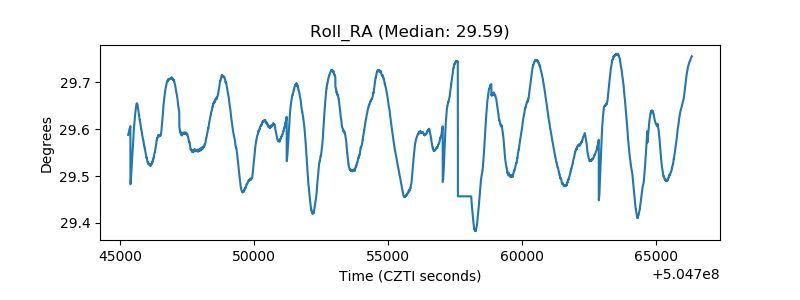 |
| Veto Counter | 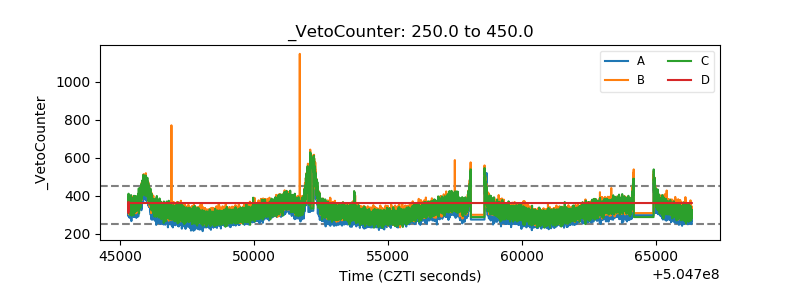 |