| Param | Original file | Final file |
|---|---|---|
| Filename | modeM0/AS1A14_099T01_9000006536_55491cztM0_level2.fits | modeM0/AS1A14_099T01_9000006536_55491cztM0_level2_quad_clean.evt |
| Size (bytes) | 619,968,960 | 76,956,480 |
| Size | 591.2 MB | 73.4 MB |
| Events in quadrant A | 3,009,566 | 583,599 |
| Events in quadrant B | 3,036,605 | 622,668 |
| Events in quadrant C | 6,241,224 | 474,917 |
| Events in quadrant D | 10,194,820 | 230,043 |
| Mode M9 | |||
|---|---|---|---|
| Quadrant | BADHDUFLAG | Total packets | Discarded packets |
| A | 0 | 11 | 0 |
| B | 0 | 11 | 0 |
| C | 0 | 11 | 0 |
| D | 0 | 11 | 0 |
| Mode SS | |||
|---|---|---|---|
| Quadrant | BADHDUFLAG | Total packets | Discarded packets |
| A | 0 | 122 | 2 |
| B | 0 | 122 | 2 |
| C | 0 | 122 | 2 |
| D | 0 | 122 | 2 |
| Mode M0 | |||
|---|---|---|---|
| Quadrant | BADHDUFLAG | Total packets | Discarded packets |
| A | 0 | 13331 | 128 |
| B | 0 | 13512 | 123 |
| C | 0 | 22913 | 147 |
| D | 0 | 34593 | 157 |
| Quadrant | Total seconds | Saturated seconds | Saturation percentage |
|---|---|---|---|
| A | 6001 | 168 | 2.799533% |
| B | 6005 | 145 | 2.414654% |
| C | 6003 | 1021 | 17.008163% |
| D | 5998 | 3628 | 60.486829% |
Noise dominated data is calculated using 1-second bins in cleaned event files. If a bin has >2000 counts, and if more than 50% of those come from <1% of pixels, then it is considered to be noise-dominated and hence unusable.
| Quadrant | # 1 sec bins | Bins with >0 counts | Bins with >2000 counts | High rate bins dominated by noise | Noise dominated (total time) | Noise dominated (detector-on time) | Marked lightcurve |
|---|---|---|---|---|---|---|---|
| A | 7039 | 6008 | 48 | 48 | 0.68% | 0.80% | 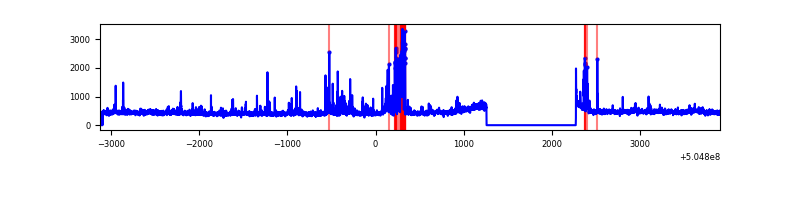 |
| B | 7032 | 6014 | 31 | 31 | 0.44% | 0.52% | 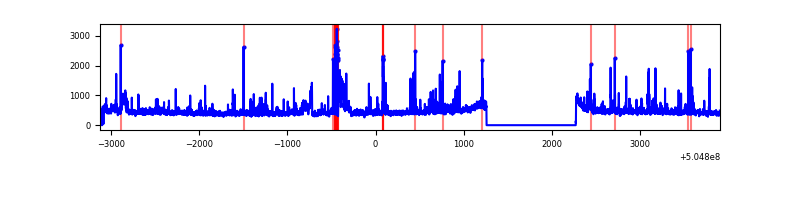 |
| C | 7029 | 6009 | 796 | 796 | 11.32% | 13.25% | 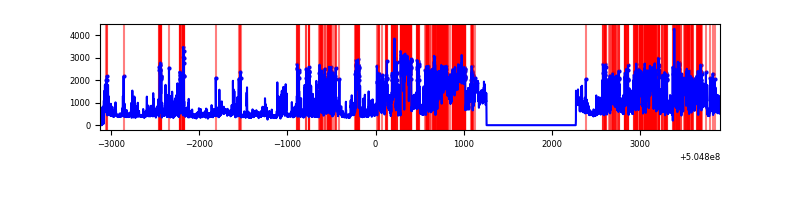 |
| D | 7028 | 6007 | 2446 | 2446 | 34.80% | 40.72% | 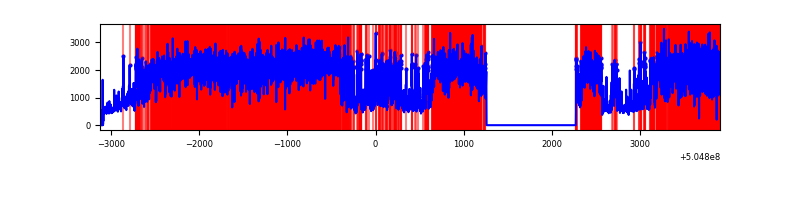 |
Top three noisy pixels from each quadrant. If the there are fewer than three noisy pixels in the level2.evt file, extra rows are filled as -1
| Pixel properties | Quadrant properties | ||||||
|---|---|---|---|---|---|---|---|
| Quadrant | DetID | PixID | Counts | Sigma | Mean | Median | Sigma |
| A | 3 | 78 | 266051 | 1660.97 | 646 | 629 | 159.8 |
| A | 0 | 8 | 95621 | 594.45 | 646 | 629 | 159.8 |
| A | 4 | 3 | 81695 | 507.3 | 646 | 629 | 159.8 |
| B | 0 | 171 | 163101 | 1198.85 | 635 | 612 | 135.5 |
| B | 5 | 172 | 138195 | 1015.09 | 635 | 612 | 135.5 |
| B | 10 | 247 | 82241 | 602.26 | 635 | 612 | 135.5 |
| C | 9 | 38 | 2794625 | 17238.48 | 589 | 582 | 162.1 |
| C | 13 | 3 | 791019 | 4876.78 | 589 | 582 | 162.1 |
| C | 12 | 2 | 108610 | 666.5 | 589 | 582 | 162.1 |
| D | 7 | 70 | 7719825 | 66592.81 | 406 | 387 | 115.9 |
| D | 5 | 113 | 192050 | 1653.41 | 406 | 387 | 115.9 |
| D | 11 | 129 | 165491 | 1424.29 | 406 | 387 | 115.9 |
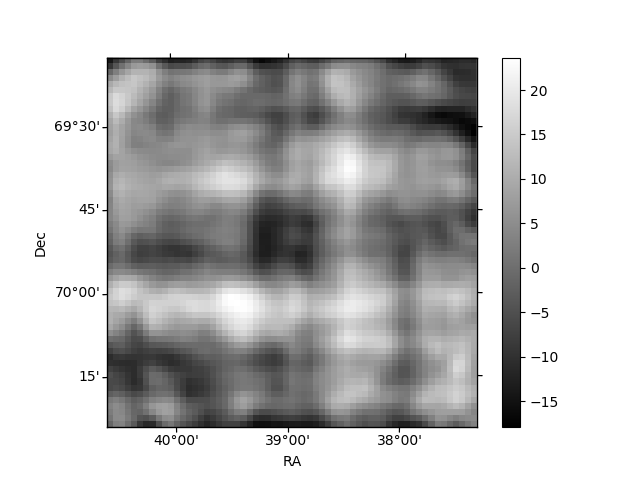
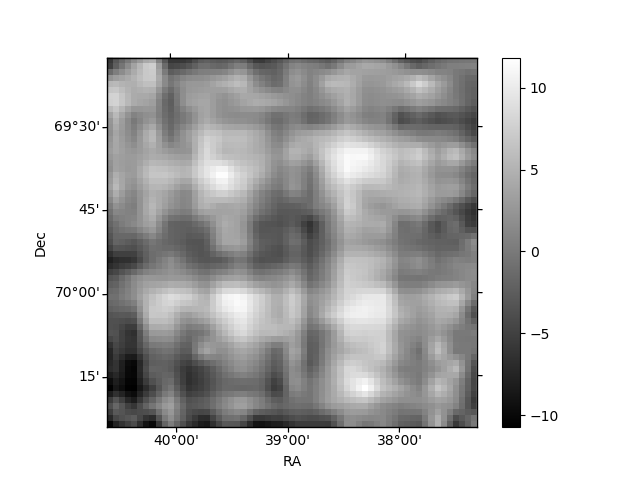
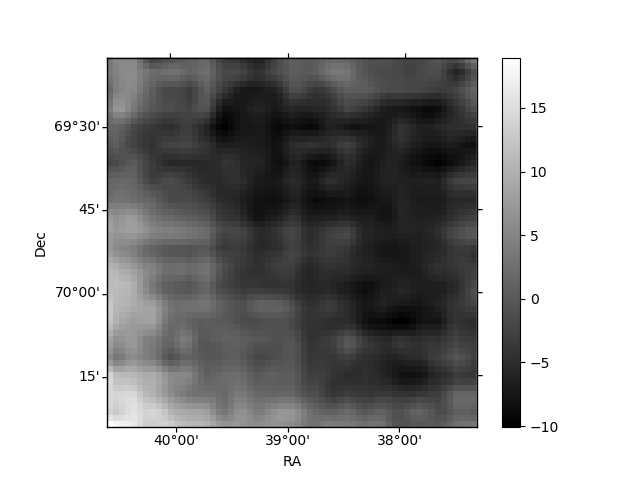
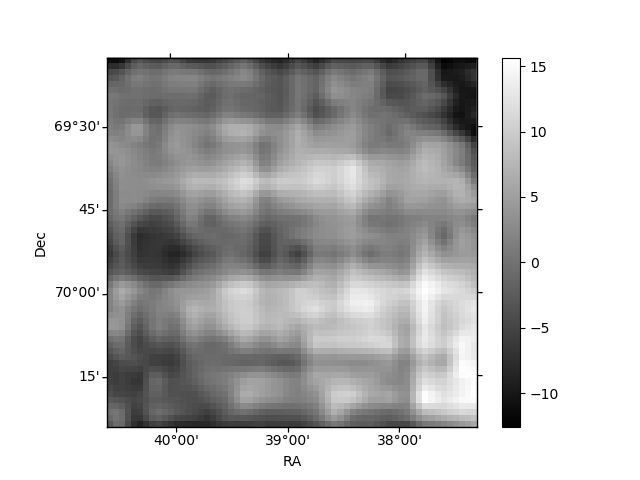
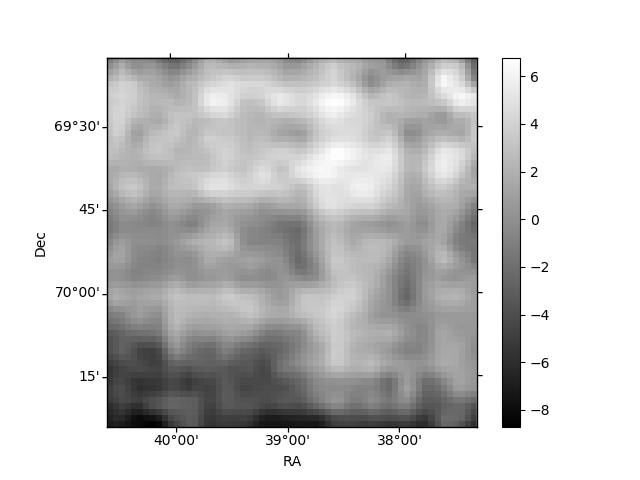
Histogram calculated using DETX and DETY for each event in the final _common_clean file
| Quadrant A | 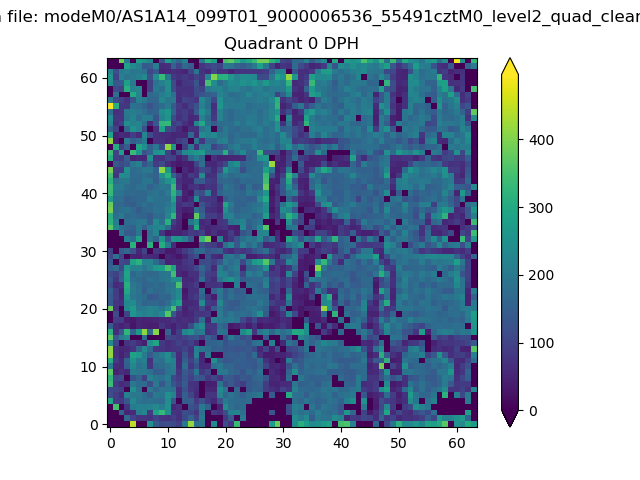 |
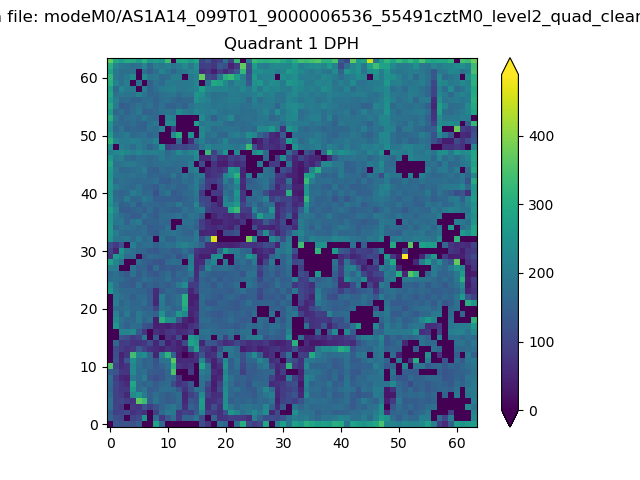 |
Quadrant B |
|---|---|---|---|
| Quadrant D | 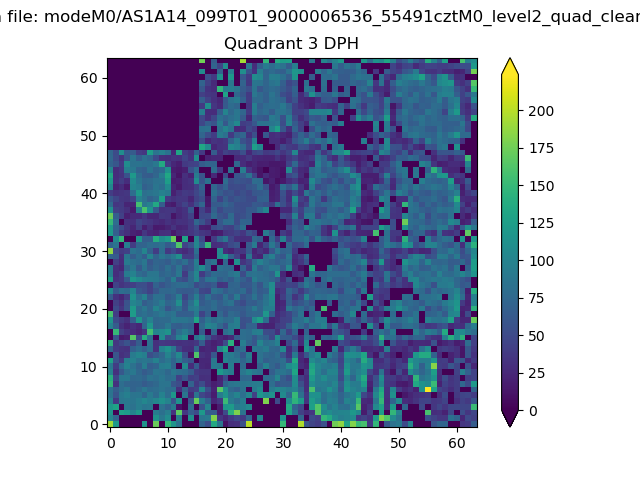 |
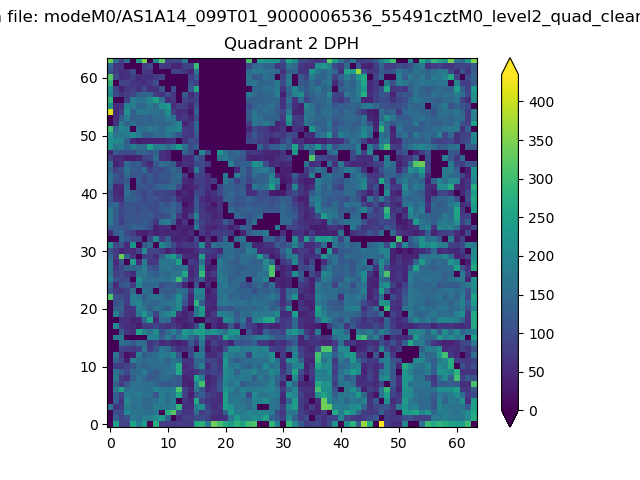 |
Quadrant C |
| Plot type | Count rate plots | Images |
|---|---|---|
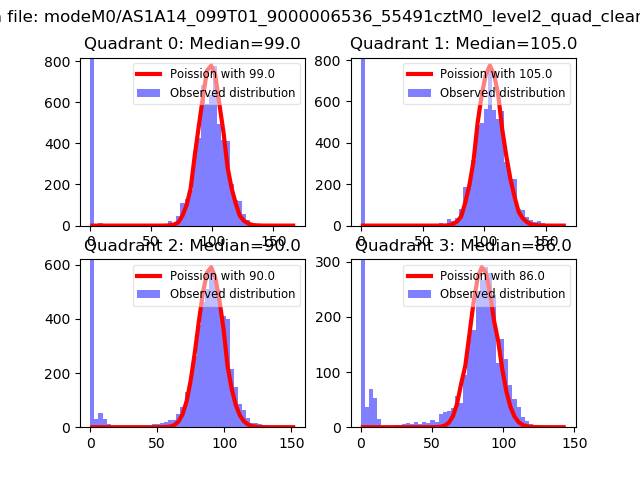
| Comparison with Poisson distribution Blue bars denote a histogram of data divided into 1 sec bins. Red curve is a Poisson curve with rate = median count rate of data. |
 |
 |
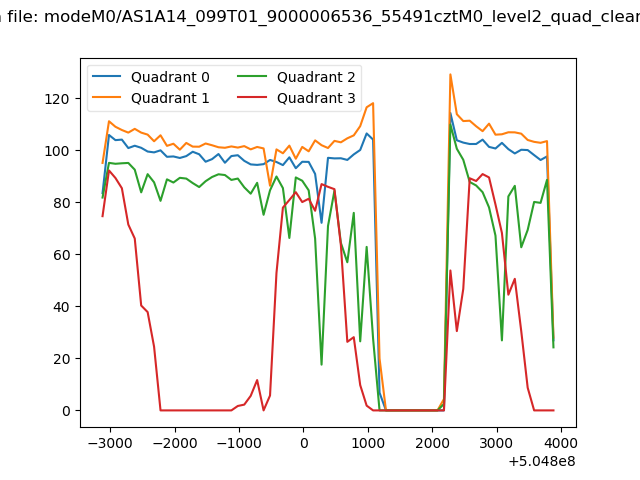
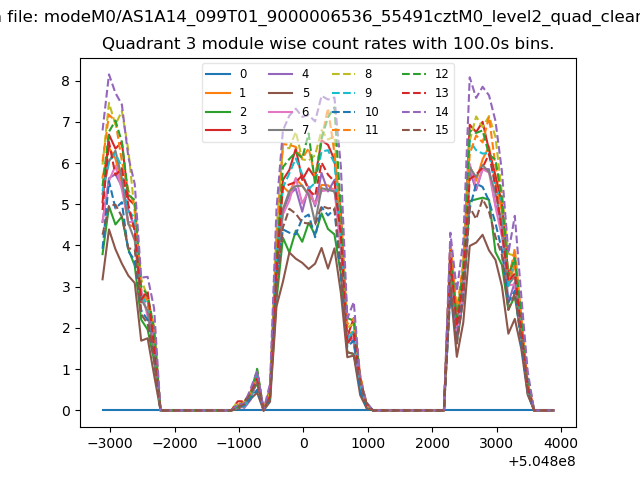
| Quadrant-wise count rates Data is divided into 100 sec bins |
 |
|
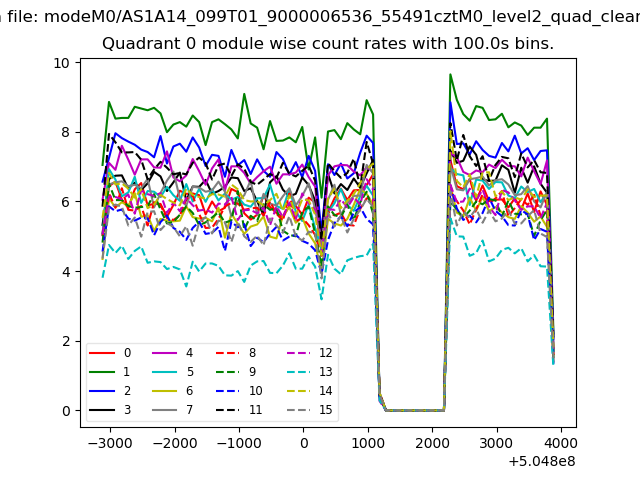
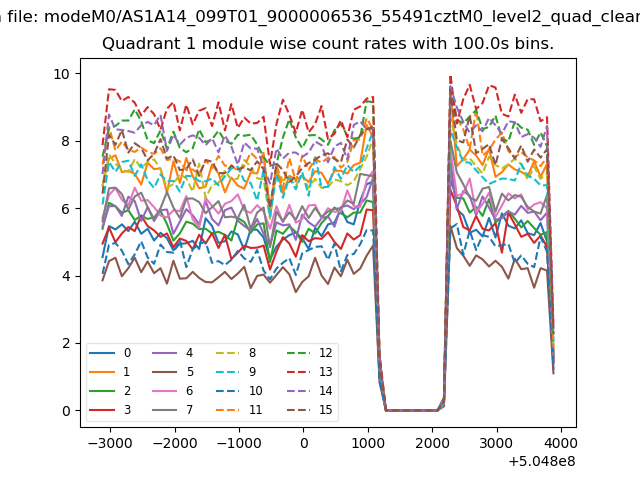
| Module-wise count rates for Quadrant A Data is divided into 100 sec bins |
 |
 |
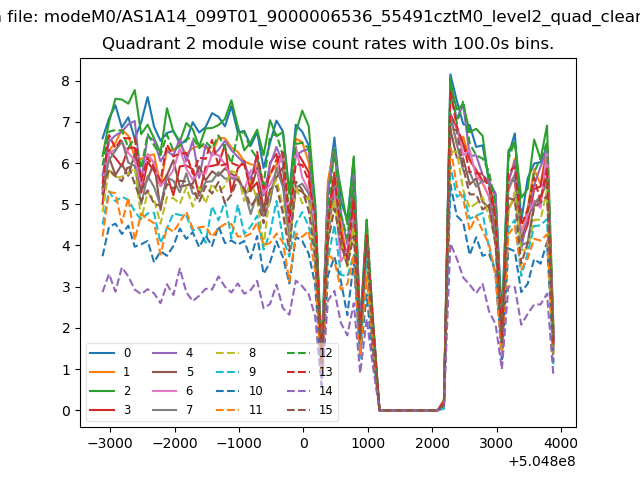
| Module-wise count rates for Quadrant B Data is divided into 100 sec bins |
 |
 |
| Module-wise count rates for Quadrant C Data is divided into 100 sec bins |
 |
 |
| Module-wise count rates for Quadrant D Data is divided into 100 sec bins |
 |
 |
| Parameter | Plot |
|---|---|
| CZT HV Monitor | 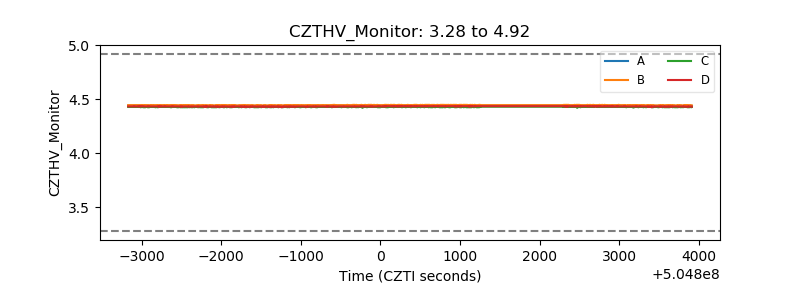 |
| D_VDD | 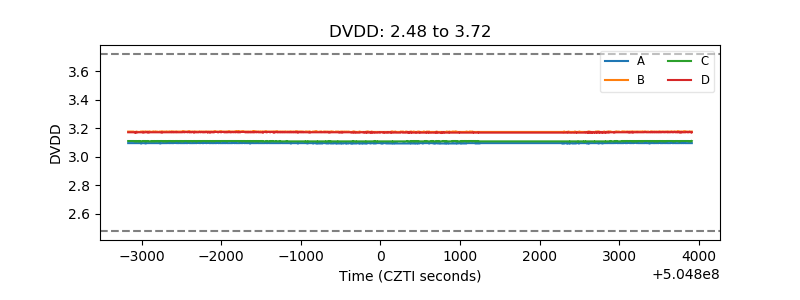 |
| Temperature 1 | 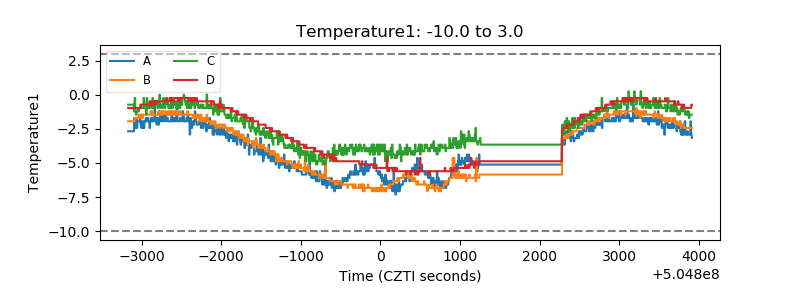 |
| Veto HV Monitor | 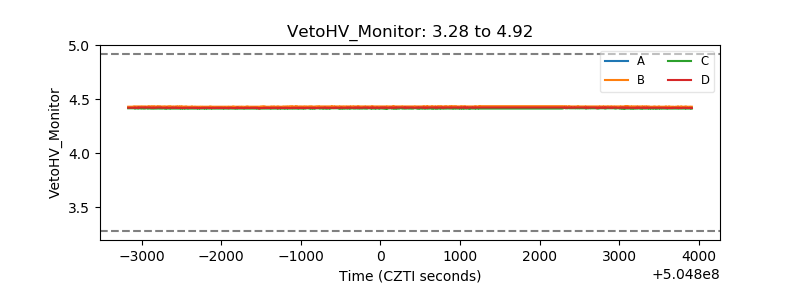 |
| Veto LLD | 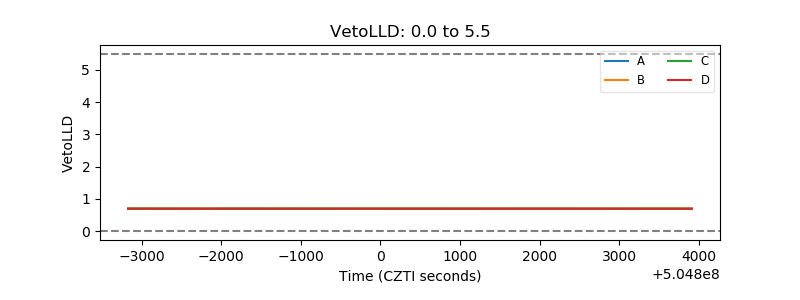 |
| Alpha Counter | 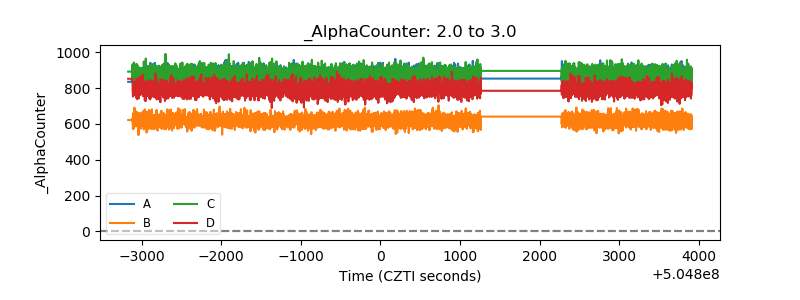 |
| _CPM_Rate | 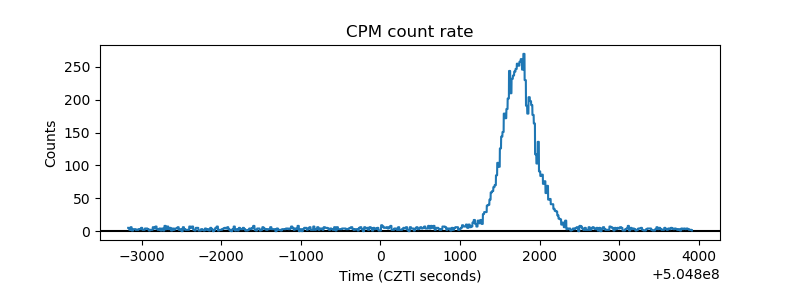 |
| CZT Counter | 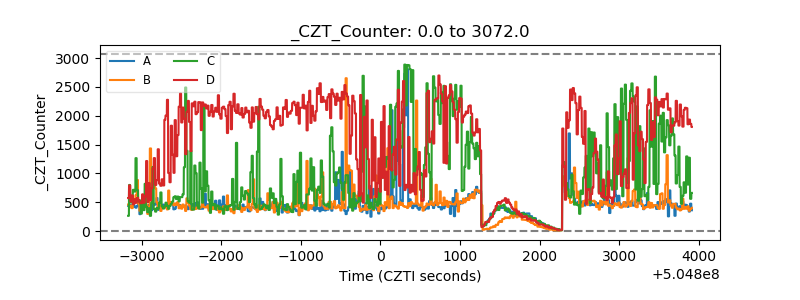 |
| +2.5 Volts monitor | 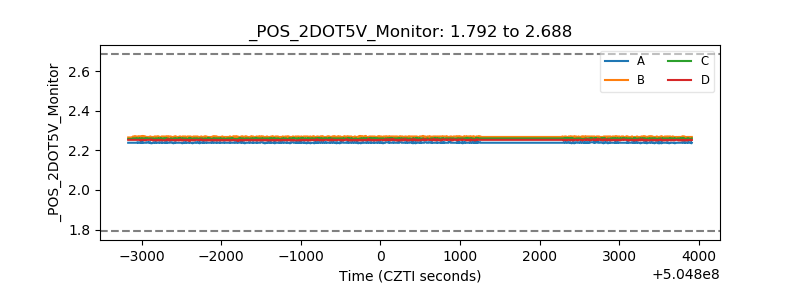 |
| +5 Volts monitor | 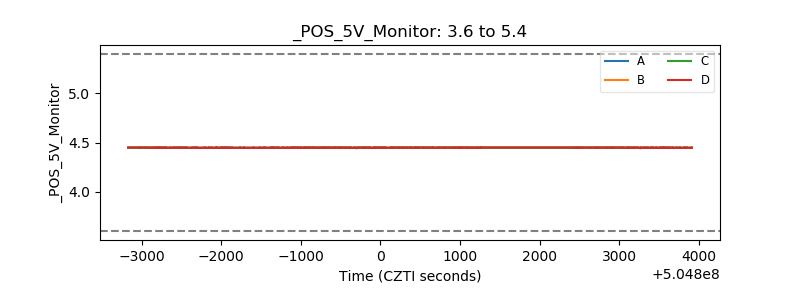 |
| _ROLL_ROT | 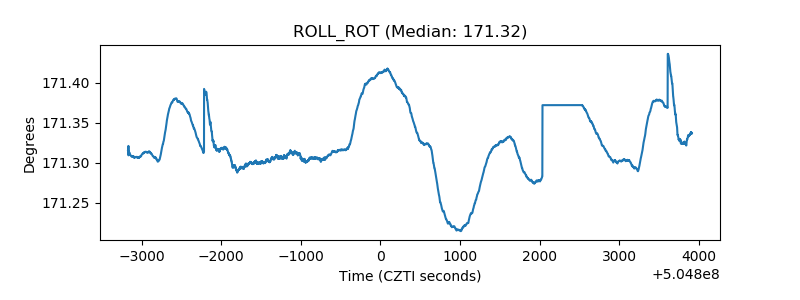 |
| _Roll_DEC | 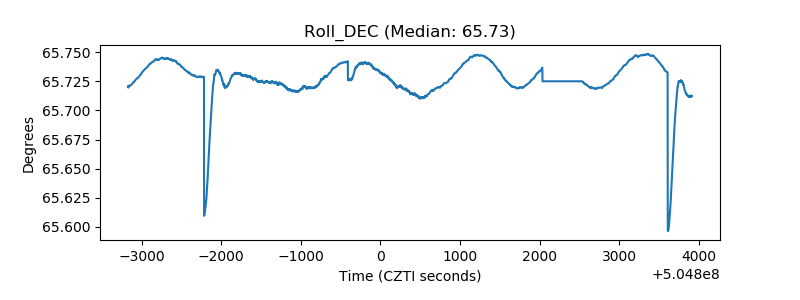 |
| _Roll_RA | 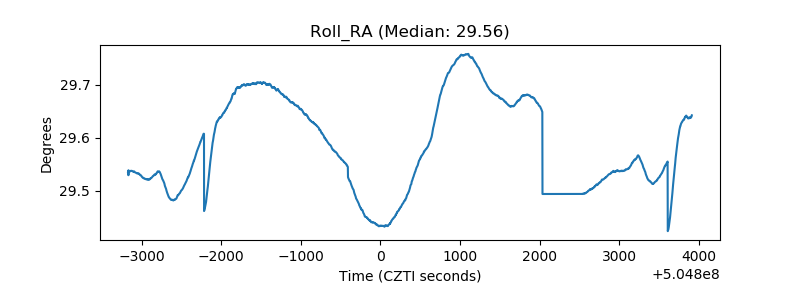 |
| Veto Counter | 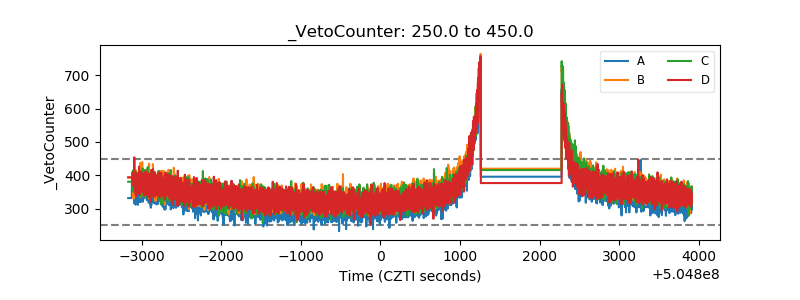 |