| Param | Original file | Final file |
|---|---|---|
| Filename | modeM0/AS1A14_099T01_9000006536_55492cztM0_level2.fits | modeM0/AS1A14_099T01_9000006536_55492cztM0_level2_quad_clean.evt |
| Size (bytes) | 595,333,440 | 91,172,160 |
| Size | 567.8 MB | 86.9 MB |
| Events in quadrant A | 3,432,042 | 635,447 |
| Events in quadrant B | 3,296,403 | 680,375 |
| Events in quadrant C | 7,026,943 | 549,763 |
| Events in quadrant D | 7,766,852 | 432,151 |
| Mode M9 | |||
|---|---|---|---|
| Quadrant | BADHDUFLAG | Total packets | Discarded packets |
| A | 0 | 9 | 0 |
| B | 0 | 9 | 0 |
| C | 0 | 9 | 0 |
| D | 0 | 9 | 0 |
| Mode SS | |||
|---|---|---|---|
| Quadrant | BADHDUFLAG | Total packets | Discarded packets |
| A | 0 | 136 | 0 |
| B | 0 | 136 | 0 |
| C | 0 | 136 | 0 |
| D | 0 | 136 | 0 |
| Mode M0 | |||
|---|---|---|---|
| Quadrant | BADHDUFLAG | Total packets | Discarded packets |
| A | 0 | 14914 | 1 |
| B | 0 | 14681 | 1 |
| C | 0 | 25544 | 7 |
| D | 0 | 27638 | 1 |
| Quadrant | Total seconds | Saturated seconds | Saturation percentage |
|---|---|---|---|
| A | 6637 | 102 | 1.536839% |
| B | 6637 | 107 | 1.612174% |
| C | 6637 | 808 | 12.174175% |
| D | 6637 | 1879 | 28.310984% |
Noise dominated data is calculated using 1-second bins in cleaned event files. If a bin has >2000 counts, and if more than 50% of those come from <1% of pixels, then it is considered to be noise-dominated and hence unusable.
| Quadrant | # 1 sec bins | Bins with >0 counts | Bins with >2000 counts | High rate bins dominated by noise | Noise dominated (total time) | Noise dominated (detector-on time) | Marked lightcurve |
|---|---|---|---|---|---|---|---|
| A | 7482 | 6639 | 55 | 55 | 0.74% | 0.83% | 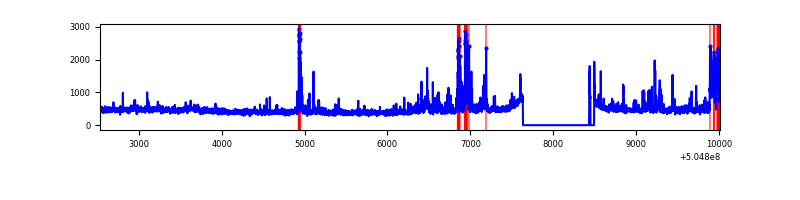 |
| B | 7482 | 6639 | 39 | 39 | 0.52% | 0.59% | 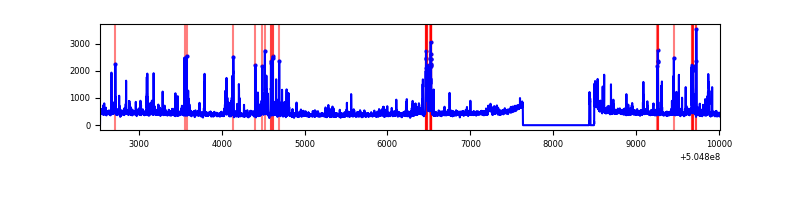 |
| C | 7482 | 6639 | 642 | 642 | 8.58% | 9.67% | 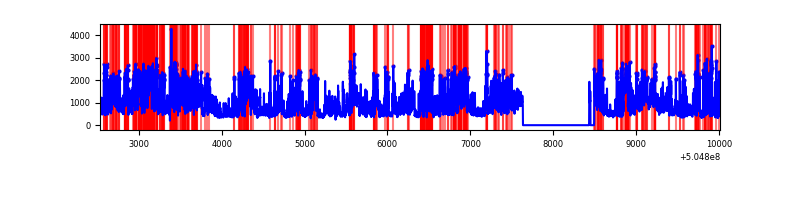 |
| D | 7482 | 6639 | 1179 | 1179 | 15.76% | 17.76% | 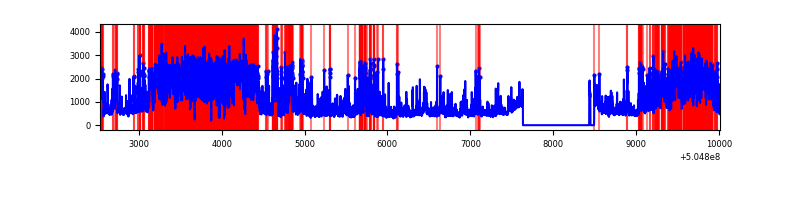 |
Top three noisy pixels from each quadrant. If the there are fewer than three noisy pixels in the level2.evt file, extra rows are filled as -1
| Pixel properties | Quadrant properties | ||||||
|---|---|---|---|---|---|---|---|
| Quadrant | DetID | PixID | Counts | Sigma | Mean | Median | Sigma |
| A | 3 | 78 | 329544 | 1909.79 | 703 | 684 | 172.2 |
| A | 12 | 115 | 134029 | 774.38 | 703 | 684 | 172.2 |
| A | 4 | 3 | 102126 | 589.11 | 703 | 684 | 172.2 |
| B | 5 | 172 | 323226 | 2163.97 | 692 | 666 | 149.1 |
| B | 10 | 247 | 109117 | 727.57 | 692 | 666 | 149.1 |
| B | 5 | 236 | 39898 | 263.2 | 692 | 666 | 149.1 |
| C | 9 | 38 | 3715436 | 20400.97 | 664 | 657 | 182.1 |
| C | 6 | 9 | 192816 | 1055.31 | 664 | 657 | 182.1 |
| C | 13 | 3 | 178478 | 976.56 | 664 | 657 | 182.1 |
| D | 7 | 70 | 3566103 | 21429.1 | 588 | 560 | 166.4 |
| D | 11 | 129 | 804480 | 4831.6 | 588 | 560 | 166.4 |
| D | 2 | 153 | 319435 | 1916.45 | 588 | 560 | 166.4 |
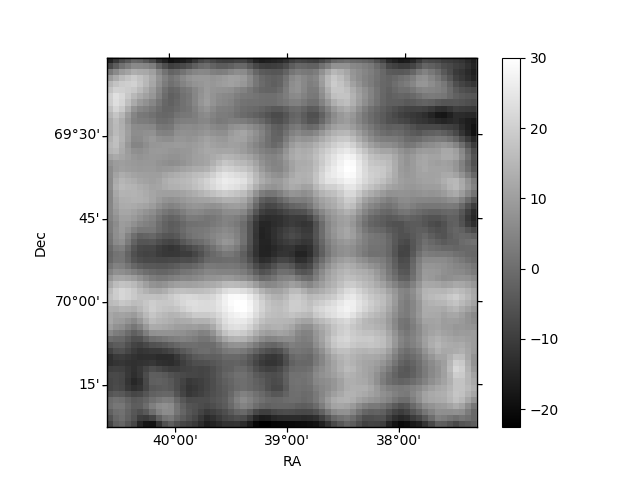
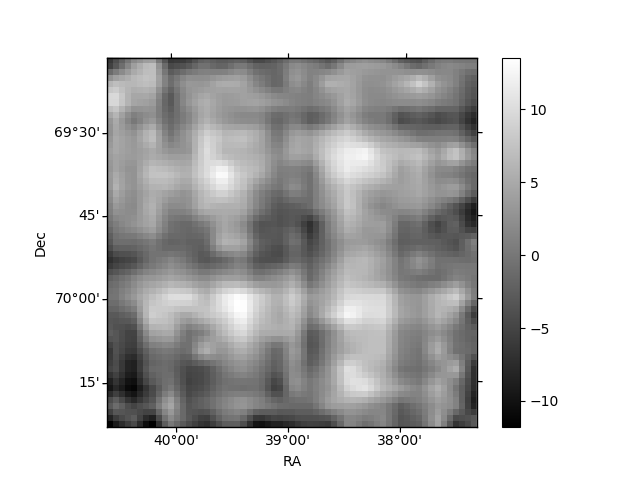
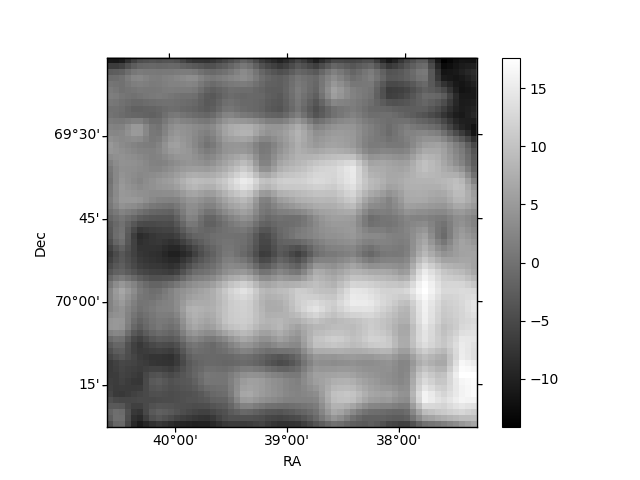
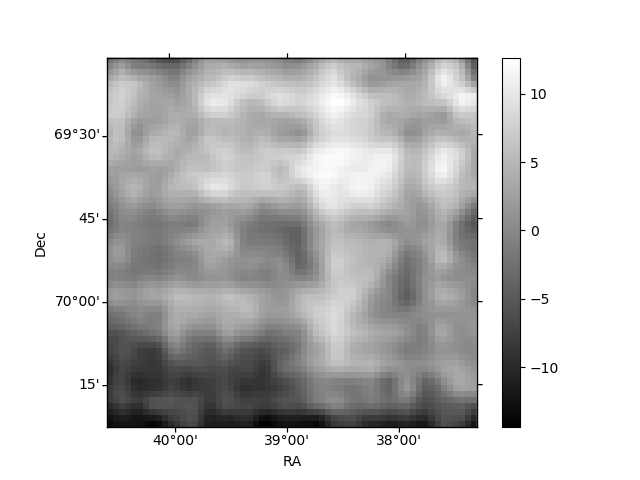
Histogram calculated using DETX and DETY for each event in the final _common_clean file
| Quadrant A | 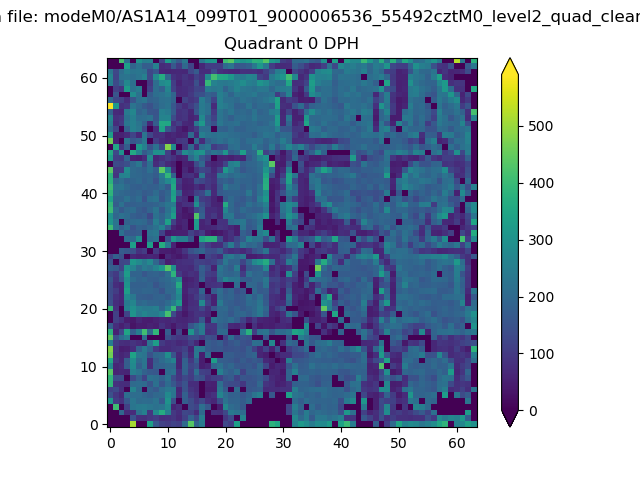 |
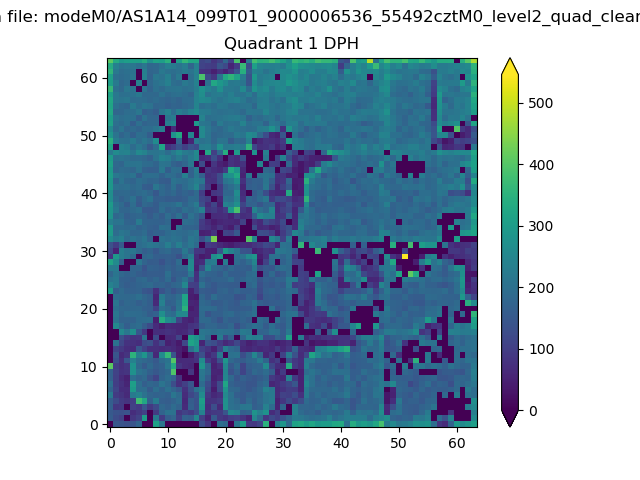 |
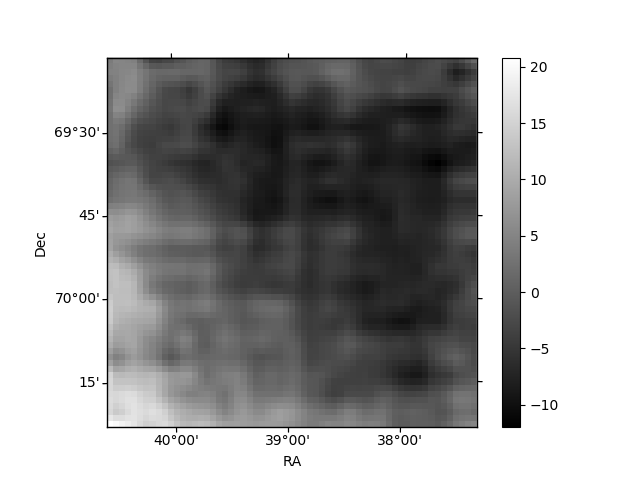
Quadrant B |
|---|---|---|---|
| Quadrant D | 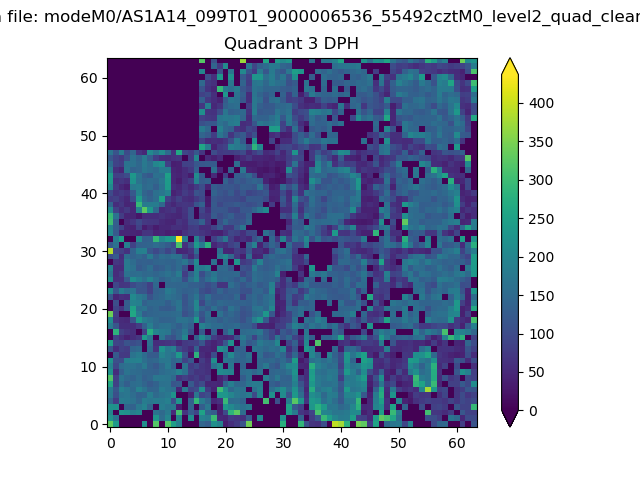 |
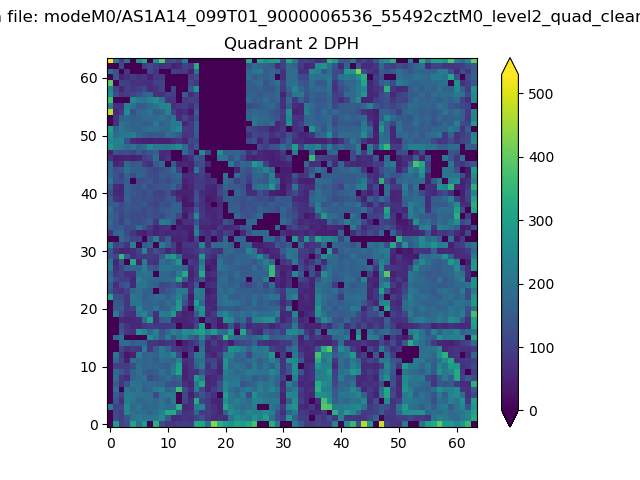 |
Quadrant C |
| Plot type | Count rate plots | Images |
|---|---|---|
| Comparison with Poisson distribution Blue bars denote a histogram of data divided into 1 sec bins. Red curve is a Poisson curve with rate = median count rate of data. |
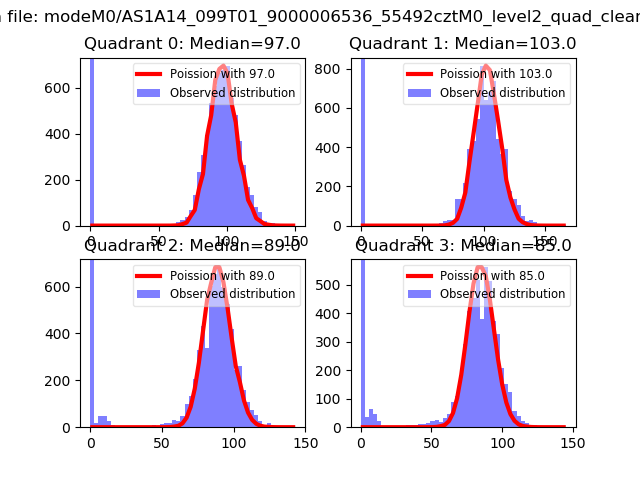 |
 |
| Quadrant-wise count rates Data is divided into 100 sec bins |
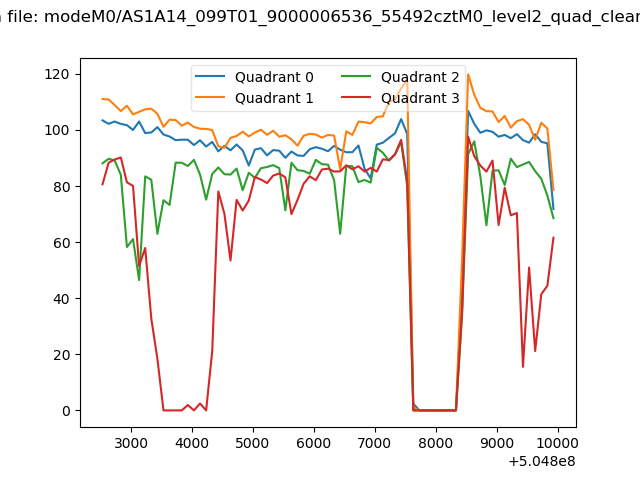 |
|
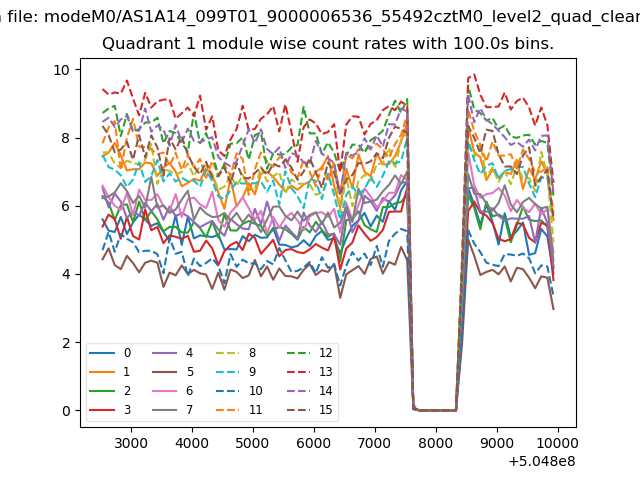
| Module-wise count rates for Quadrant A Data is divided into 100 sec bins |
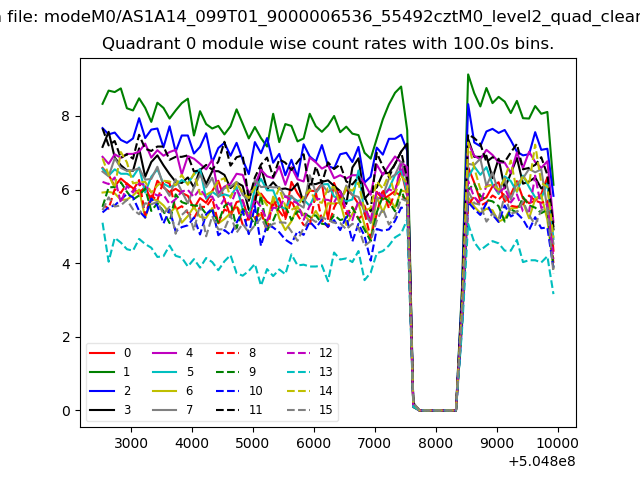 |
 |
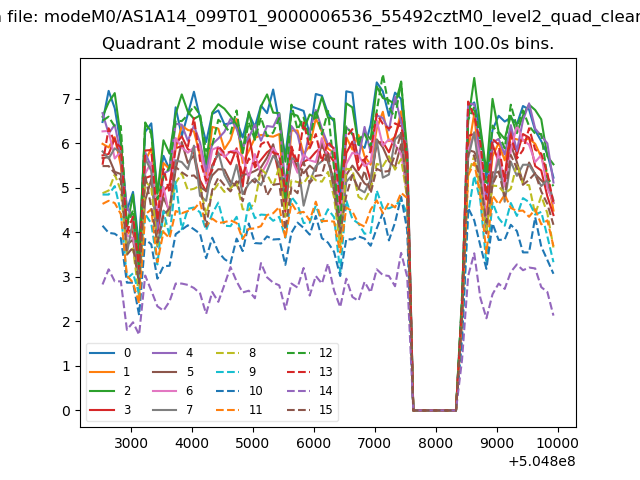
| Module-wise count rates for Quadrant B Data is divided into 100 sec bins |
 |
 |
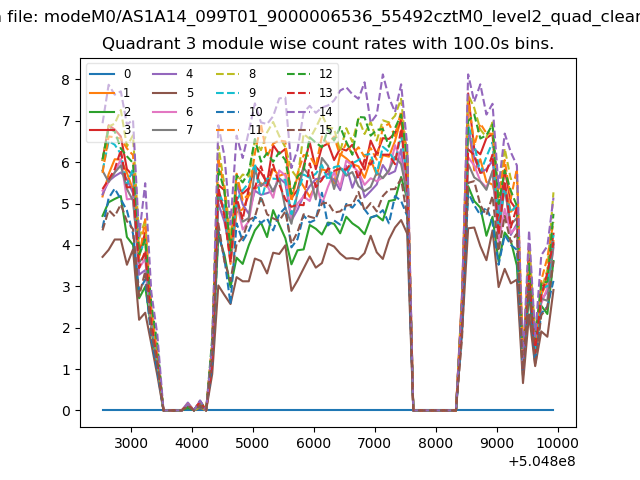
| Module-wise count rates for Quadrant C Data is divided into 100 sec bins |
 |
 |
| Module-wise count rates for Quadrant D Data is divided into 100 sec bins |
 |
 |
| Parameter | Plot |
|---|---|
| CZT HV Monitor | 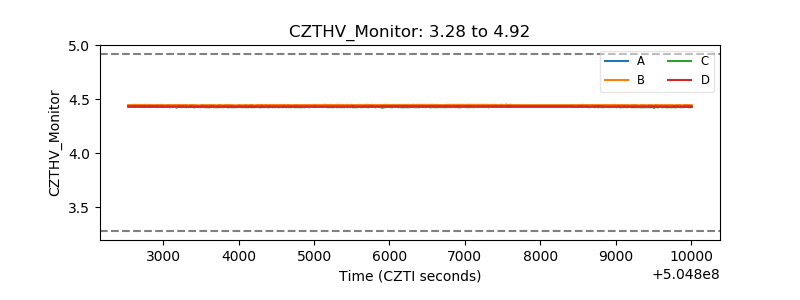 |
| D_VDD | 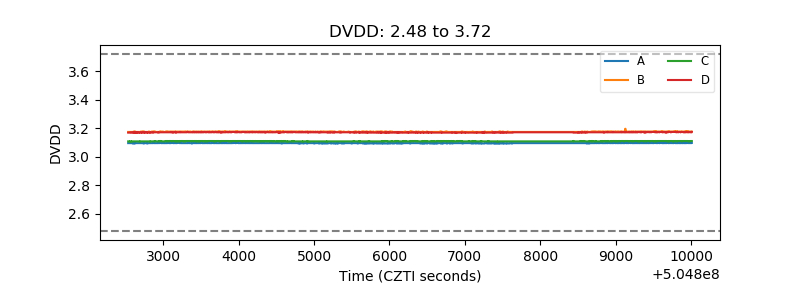 |
| Temperature 1 | 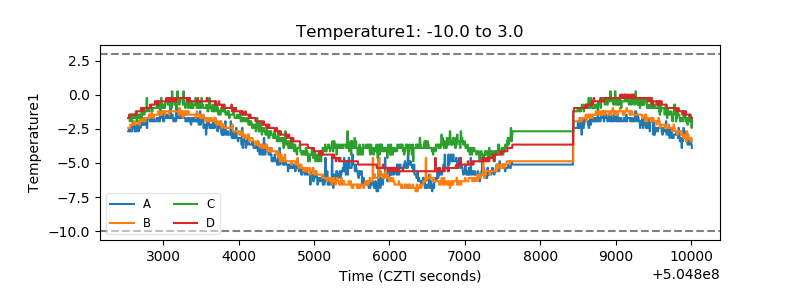 |
| Veto HV Monitor | 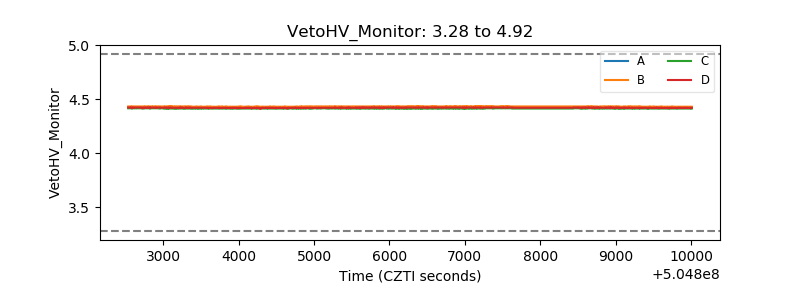 |
| Veto LLD | 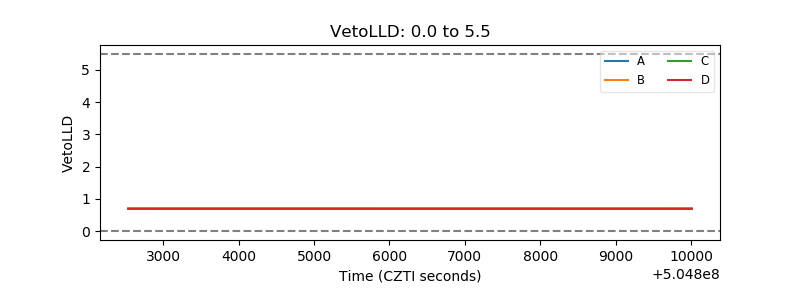 |
| Alpha Counter | 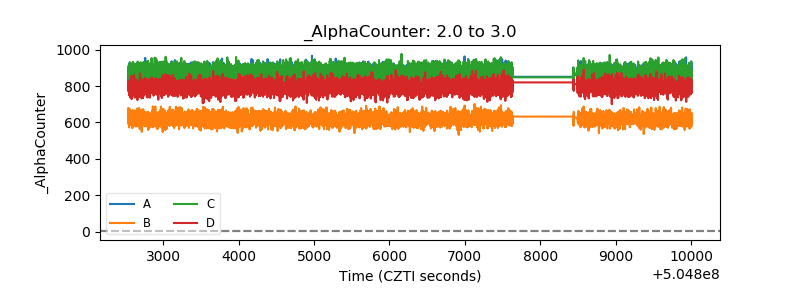 |
| _CPM_Rate | 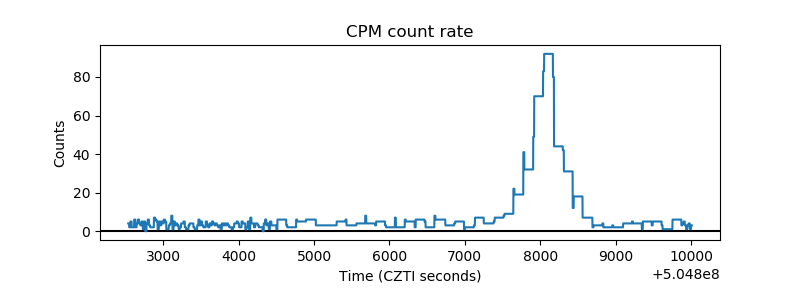 |
| CZT Counter | 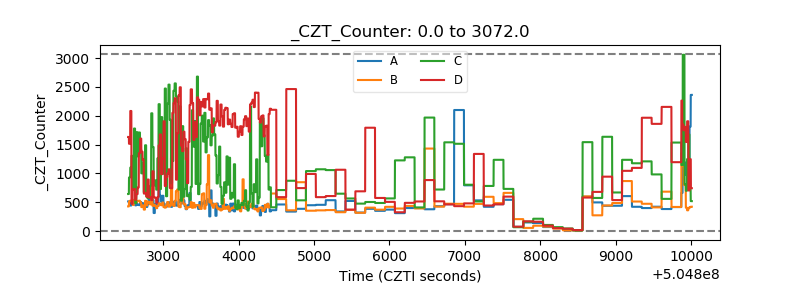 |
| +2.5 Volts monitor | 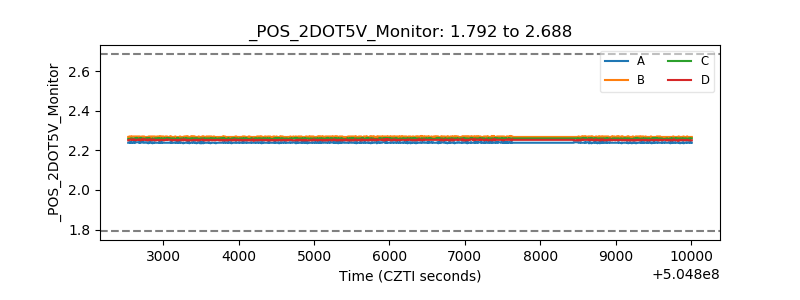 |
| +5 Volts monitor | 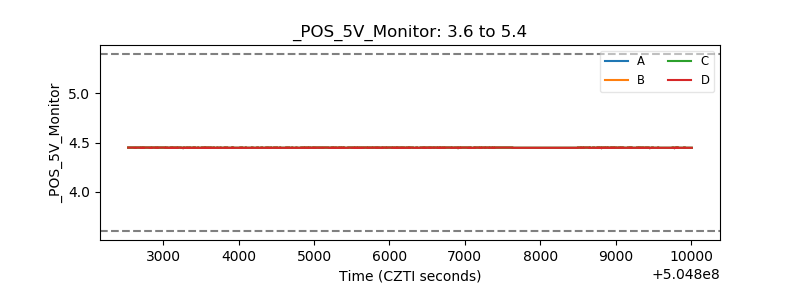 |
| _ROLL_ROT | 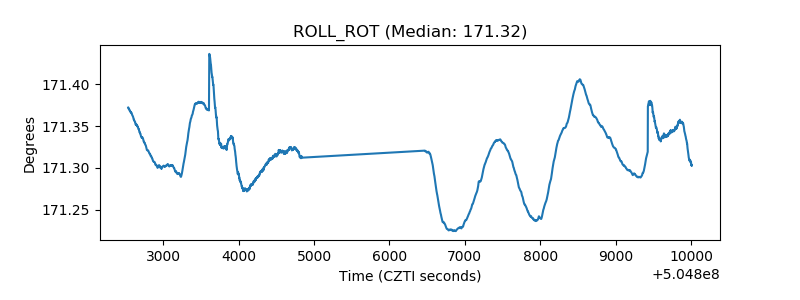 |
| _Roll_DEC | 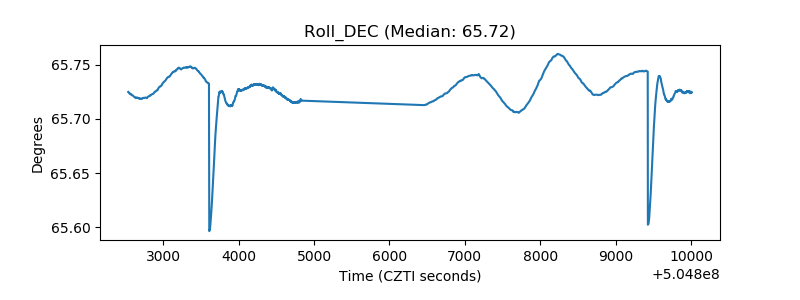 |
| _Roll_RA | 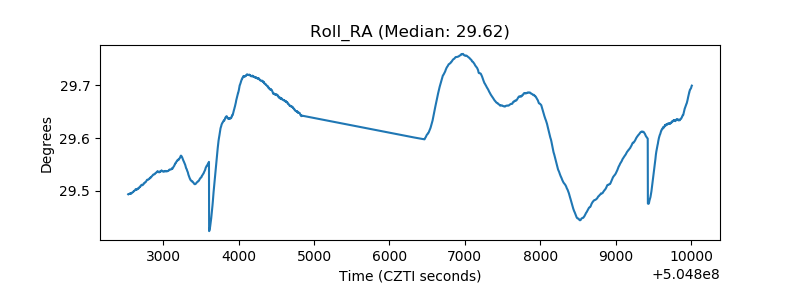 |
| Veto Counter | 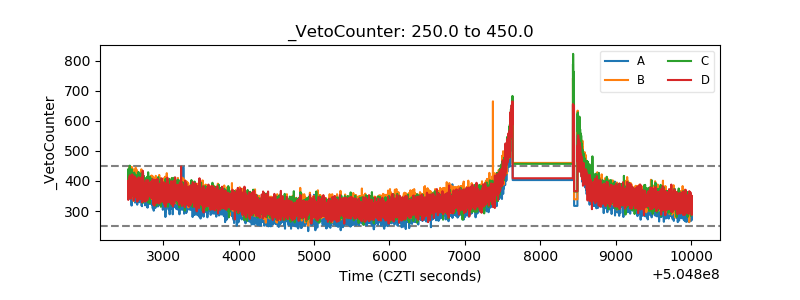 |