| Param | Original file | Final file |
|---|---|---|
| Filename | modeM0/AS1A14_099T01_9000006536_55493cztM0_level2.fits | modeM0/AS1A14_099T01_9000006536_55493cztM0_level2_quad_clean.evt |
| Size (bytes) | 760,723,200 | 96,114,240 |
| Size | 725.5 MB | 91.7 MB |
| Events in quadrant A | 4,921,471 | 682,006 |
| Events in quadrant B | 4,902,347 | 703,686 |
| Events in quadrant C | 7,164,989 | 601,647 |
| Events in quadrant D | 10,596,549 | 406,804 |
| Mode M9 | |||
|---|---|---|---|
| Quadrant | BADHDUFLAG | Total packets | Discarded packets |
| A | 0 | 3 | 0 |
| B | 0 | 3 | 0 |
| C | 0 | 3 | 0 |
| D | 0 | 4 | 0 |
| Mode SS | |||
|---|---|---|---|
| Quadrant | BADHDUFLAG | Total packets | Discarded packets |
| A | 0 | 152 | 0 |
| B | 0 | 150 | 0 |
| C | 0 | 150 | 0 |
| D | 0 | 150 | 0 |
| Mode M0 | |||
|---|---|---|---|
| Quadrant | BADHDUFLAG | Total packets | Discarded packets |
| A | 0 | 19841 | 3 |
| B | 0 | 19854 | 4 |
| C | 0 | 26561 | 3 |
| D | 0 | 36619 | 3 |
| Quadrant | Total seconds | Saturated seconds | Saturation percentage |
|---|---|---|---|
| A | 7410 | 378 | 5.101215% |
| B | 7409 | 587 | 7.922797% |
| C | 7409 | 995 | 13.429613% |
| D | 7409 | 2877 | 38.831151% |
Noise dominated data is calculated using 1-second bins in cleaned event files. If a bin has >2000 counts, and if more than 50% of those come from <1% of pixels, then it is considered to be noise-dominated and hence unusable.
| Quadrant | # 1 sec bins | Bins with >0 counts | Bins with >2000 counts | High rate bins dominated by noise | Noise dominated (total time) | Noise dominated (detector-on time) | Marked lightcurve |
|---|---|---|---|---|---|---|---|
| A | 7740 | 7413 | 301 | 301 | 3.89% | 4.06% | 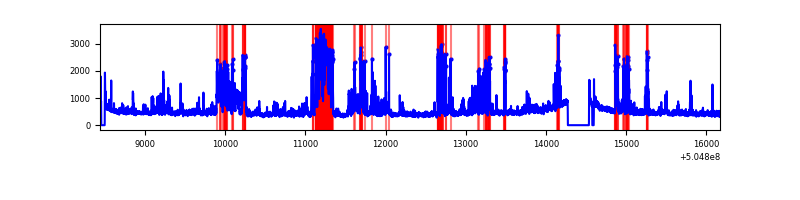 |
| B | 7739 | 7412 | 322 | 322 | 4.16% | 4.34% | 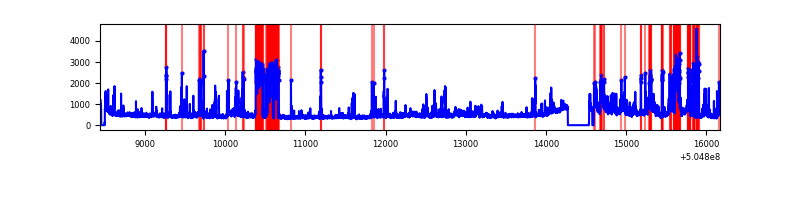 |
| C | 7739 | 7412 | 843 | 843 | 10.89% | 11.37% | 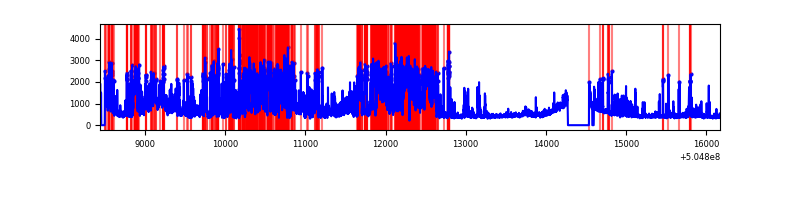 |
| D | 7739 | 7412 | 2339 | 2339 | 30.22% | 31.56% | 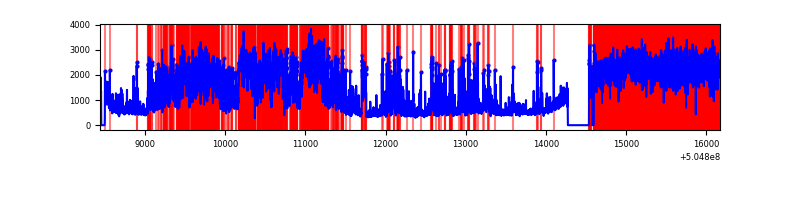 |
Top three noisy pixels from each quadrant. If the there are fewer than three noisy pixels in the level2.evt file, extra rows are filled as -1
| Pixel properties | Quadrant properties | ||||||
|---|---|---|---|---|---|---|---|
| Quadrant | DetID | PixID | Counts | Sigma | Mean | Median | Sigma |
| A | 3 | 78 | 822767 | 4172.28 | 794 | 773 | 197.0 |
| A | 0 | 8 | 336720 | 1705.2 | 794 | 773 | 197.0 |
| A | 15 | 32 | 304630 | 1542.32 | 794 | 773 | 197.0 |
| B | 5 | 172 | 1512172 | 9224.43 | 769 | 740 | 163.9 |
| B | 0 | 171 | 116423 | 706.03 | 769 | 740 | 163.9 |
| B | 10 | 247 | 97221 | 588.83 | 769 | 740 | 163.9 |
| C | 9 | 38 | 3036386 | 14732.59 | 757 | 748 | 206.0 |
| C | 6 | 9 | 541031 | 2622.11 | 757 | 748 | 206.0 |
| C | 13 | 3 | 423195 | 2050.22 | 757 | 748 | 206.0 |
| D | 7 | 70 | 3920032 | 22224.02 | 621 | 593 | 176.4 |
| D | 11 | 129 | 3357986 | 19037.1 | 621 | 593 | 176.4 |
| D | 6 | 239 | 185192 | 1046.71 | 621 | 593 | 176.4 |
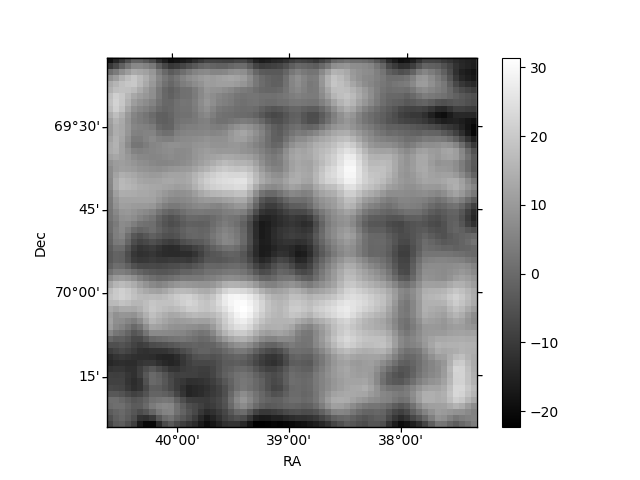
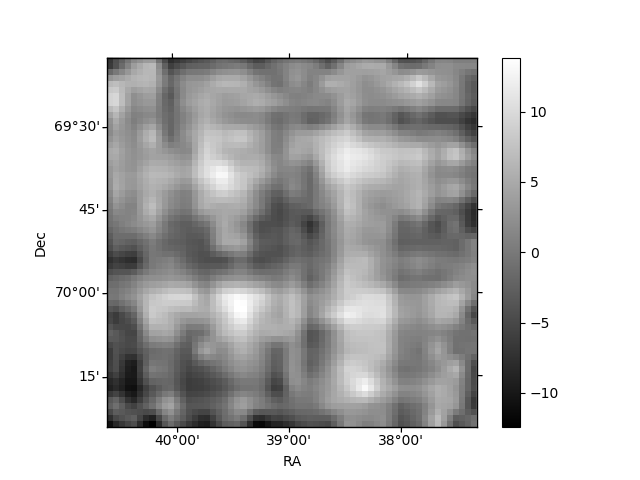
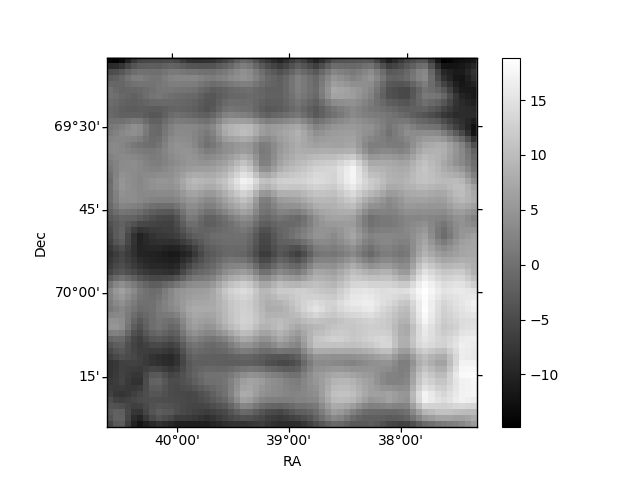
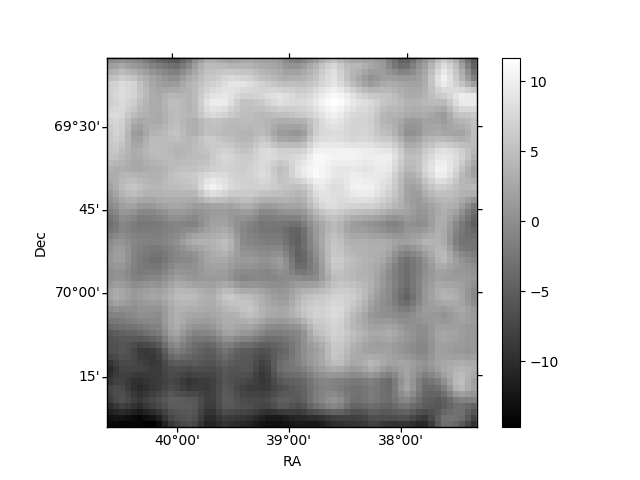
Histogram calculated using DETX and DETY for each event in the final _common_clean file
| Quadrant A | 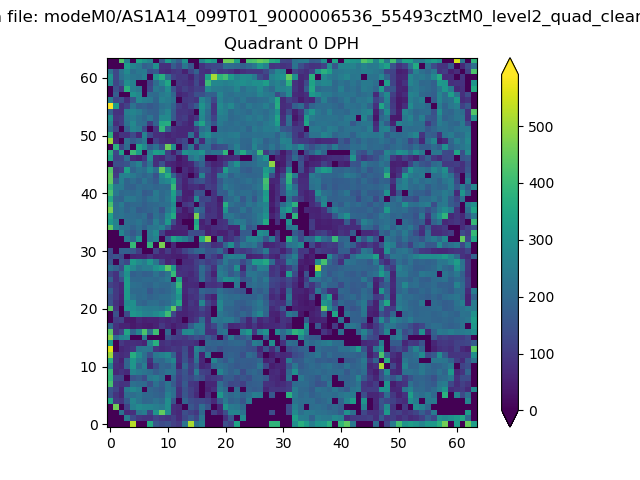 |
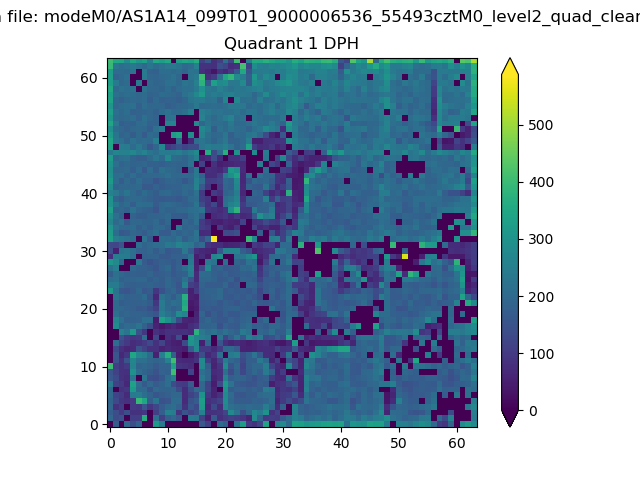 |
Quadrant B |
|---|---|---|---|
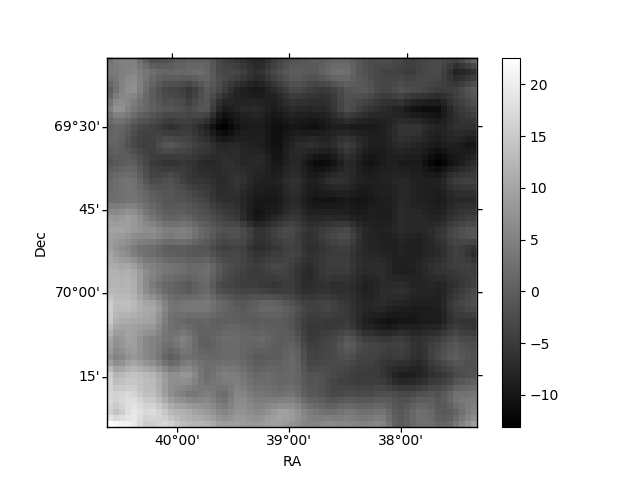
| Quadrant D | 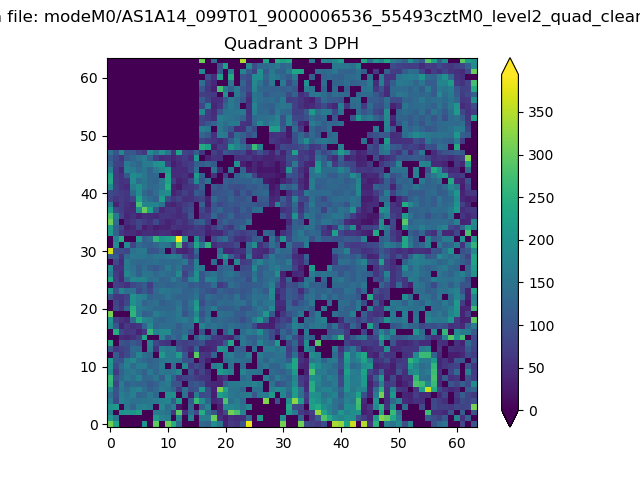 |
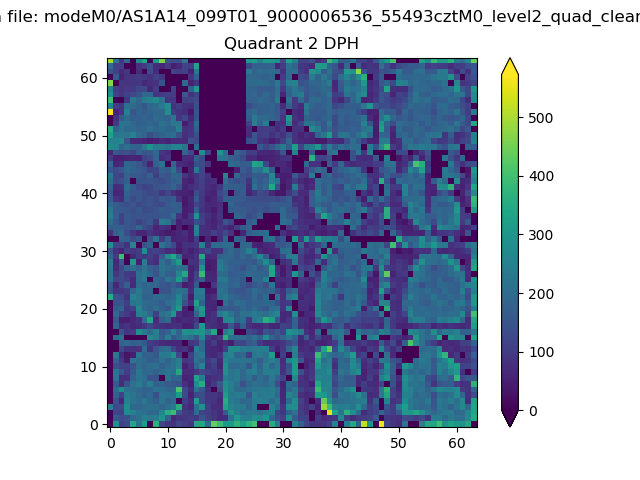 |
Quadrant C |
| Plot type | Count rate plots | Images |
|---|---|---|
| Comparison with Poisson distribution Blue bars denote a histogram of data divided into 1 sec bins. Red curve is a Poisson curve with rate = median count rate of data. |
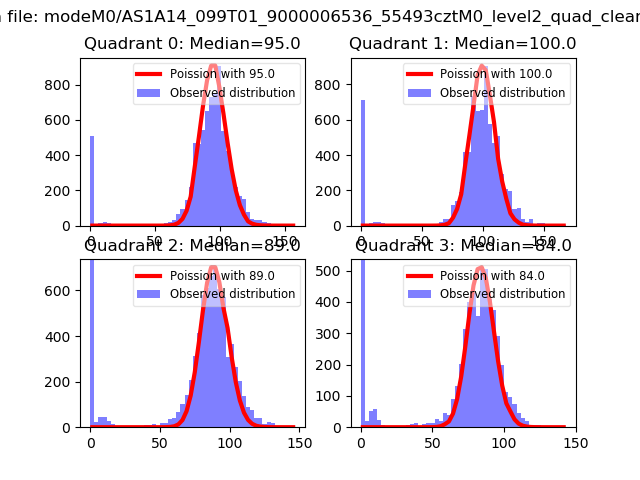 |
 |
| Quadrant-wise count rates Data is divided into 100 sec bins |
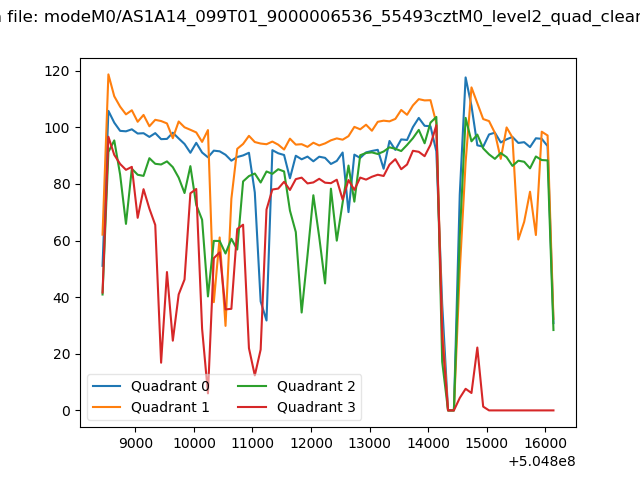 |
|
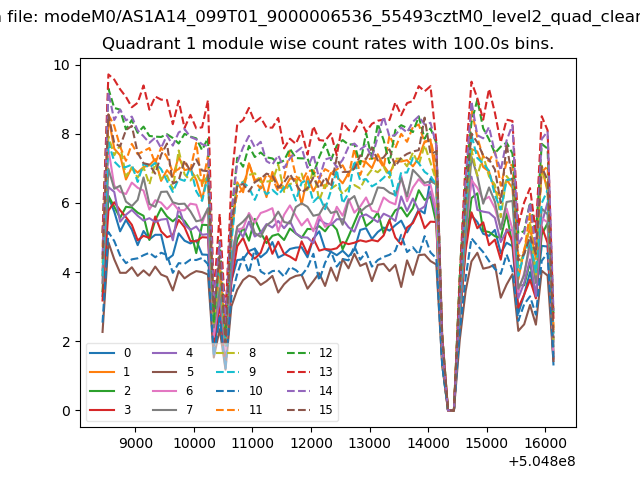
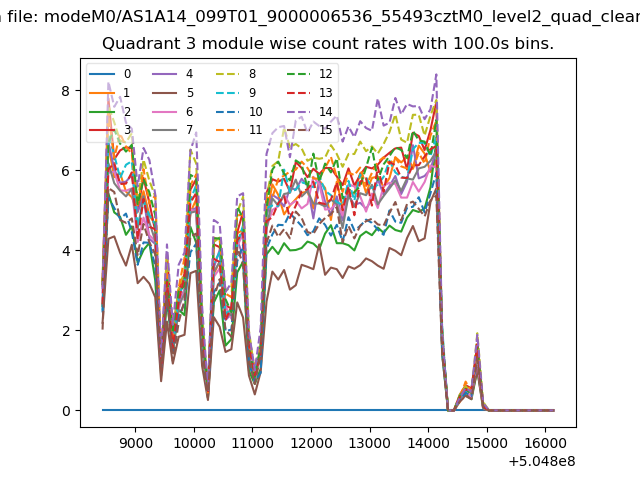
| Module-wise count rates for Quadrant A Data is divided into 100 sec bins |
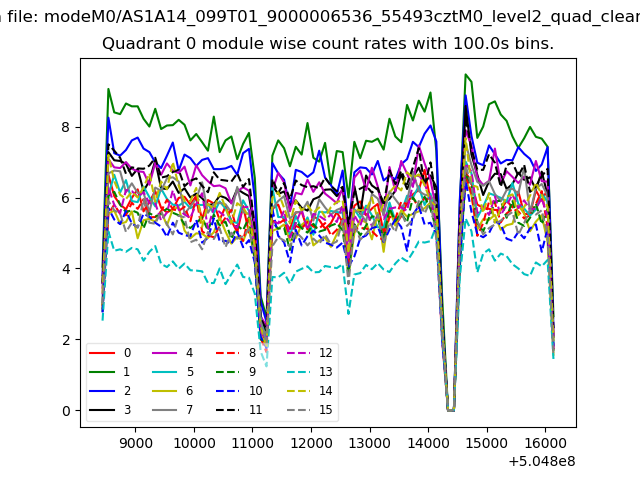 |
 |
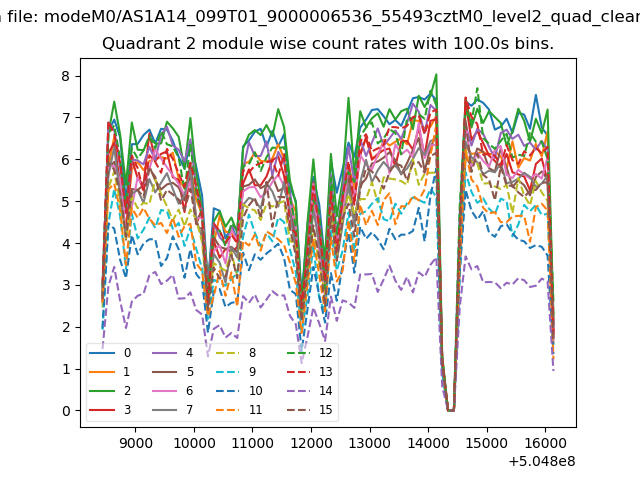
| Module-wise count rates for Quadrant B Data is divided into 100 sec bins |
 |
 |
| Module-wise count rates for Quadrant C Data is divided into 100 sec bins |
 |
 |
| Module-wise count rates for Quadrant D Data is divided into 100 sec bins |
 |
 |
| Parameter | Plot |
|---|---|
| CZT HV Monitor | 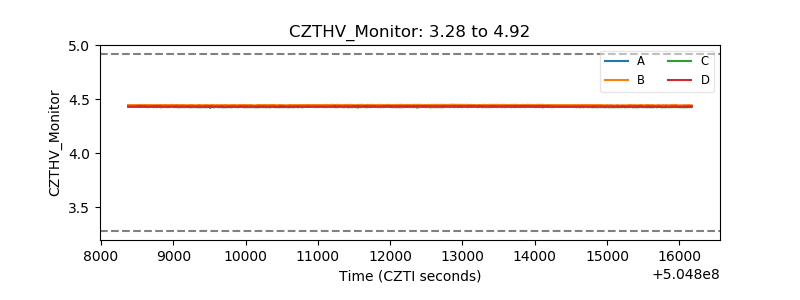 |
| D_VDD | 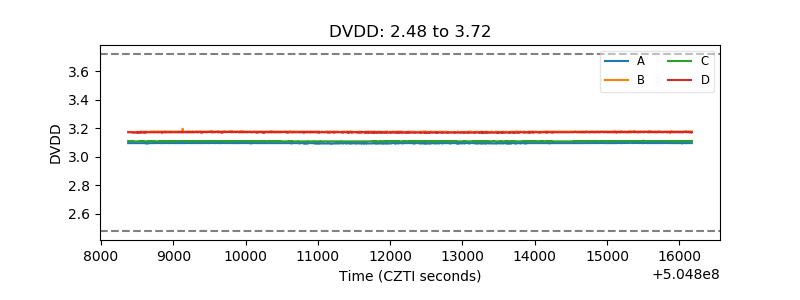 |
| Temperature 1 | 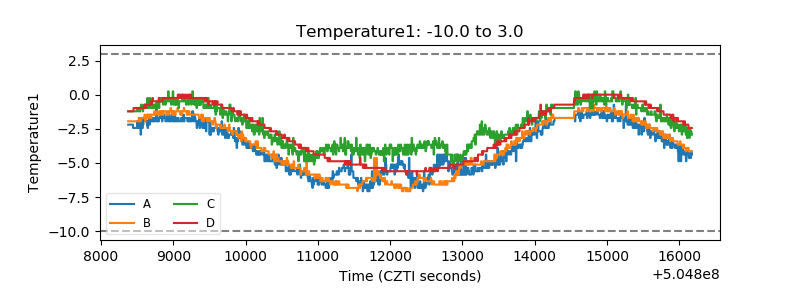 |
| Veto HV Monitor | 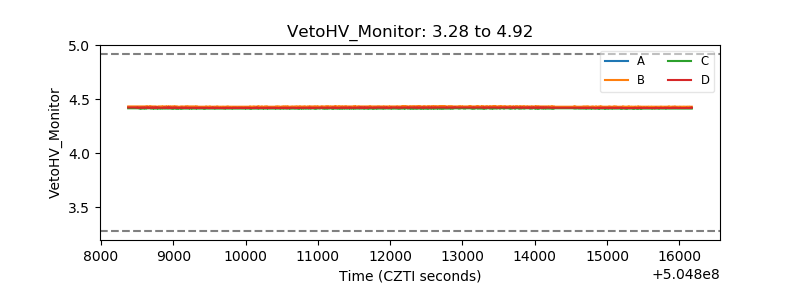 |
| Veto LLD | 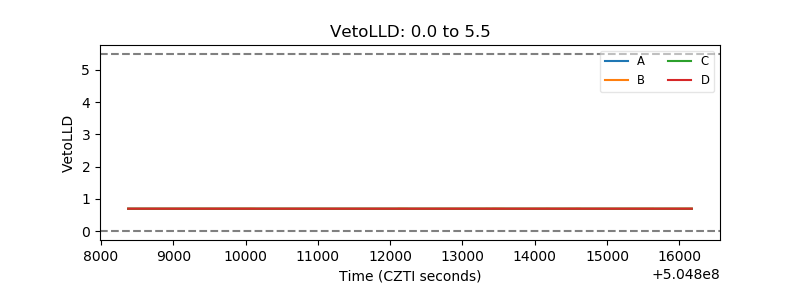 |
| Alpha Counter | 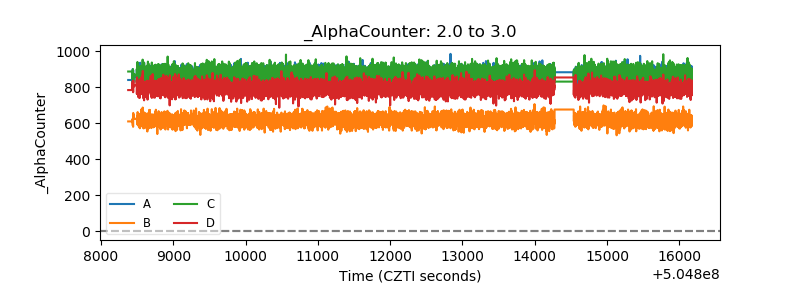 |
| _CPM_Rate | 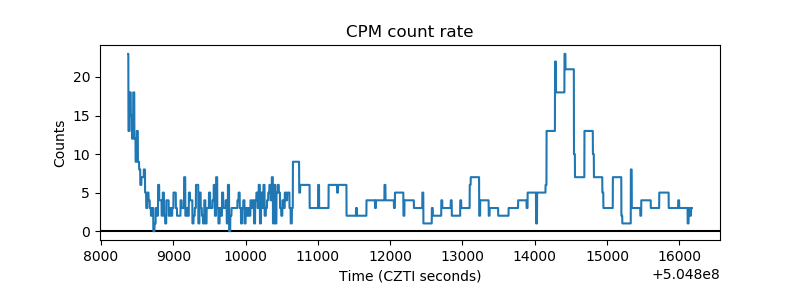 |
| CZT Counter | 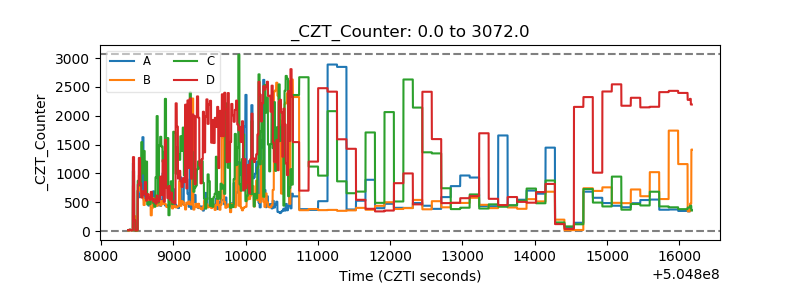 |
| +2.5 Volts monitor | 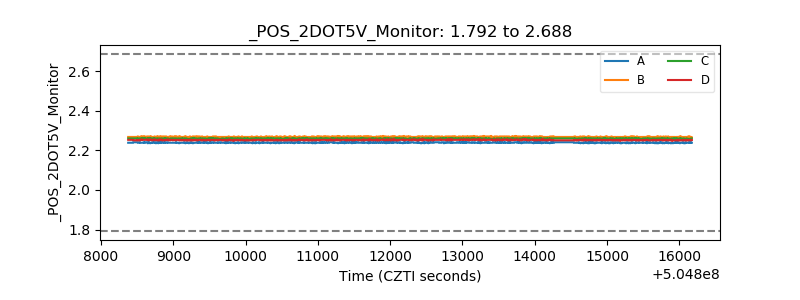 |
| +5 Volts monitor | 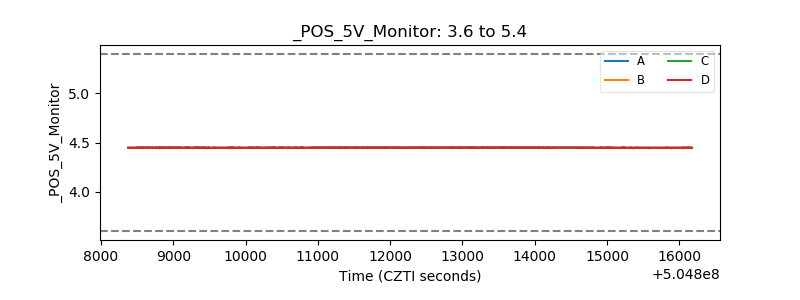 |
| _ROLL_ROT | 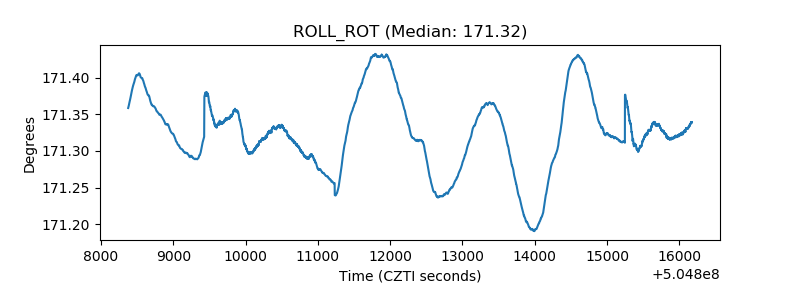 |
| _Roll_DEC | 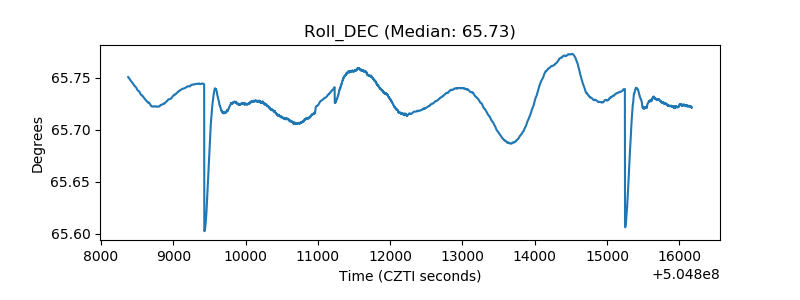 |
| _Roll_RA | 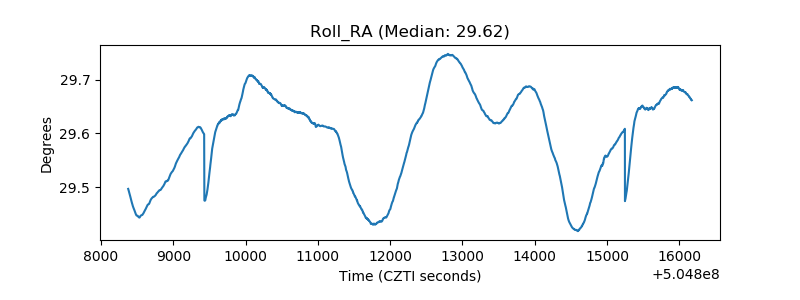 |
| Veto Counter | 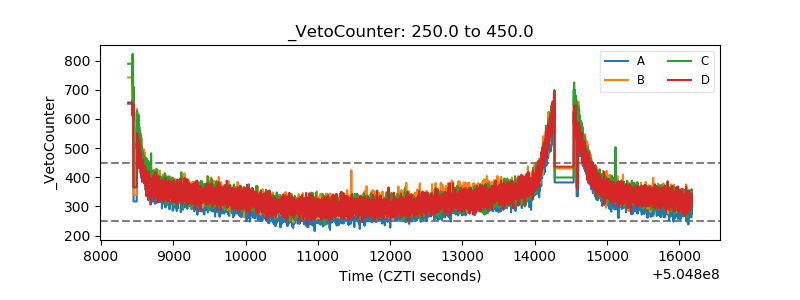 |