| Param | Original file | Final file |
|---|---|---|
| Filename | modeM0/AS1A14_099T01_9000006536_55494cztM0_level2.fits | modeM0/AS1A14_099T01_9000006536_55494cztM0_level2_quad_clean.evt |
| Size (bytes) | 893,761,920 | 91,612,800 |
| Size | 852.4 MB | 87.4 MB |
| Events in quadrant A | 6,666,162 | 692,612 |
| Events in quadrant B | 4,797,519 | 752,224 |
| Events in quadrant C | 3,979,104 | 700,539 |
| Events in quadrant D | 17,030,298 | 81,402 |
| Mode SS | |||
|---|---|---|---|
| Quadrant | BADHDUFLAG | Total packets | Discarded packets |
| A | 0 | 158 | 0 |
| B | 0 | 158 | 0 |
| C | 0 | 158 | 0 |
| D | 0 | 158 | 0 |
| Mode M0 | |||
|---|---|---|---|
| Quadrant | BADHDUFLAG | Total packets | Discarded packets |
| A | 0 | 25411 | 66 |
| B | 0 | 20075 | 90 |
| C | 0 | 17826 | 89 |
| D | 0 | 56156 | 214 |
| Quadrant | Total seconds | Saturated seconds | Saturation percentage |
|---|---|---|---|
| A | 7865 | 757 | 9.624921% |
| B | 7862 | 445 | 5.660137% |
| C | 7863 | 94 | 1.195472% |
| D | 7856 | 7105 | 90.440428% |
Noise dominated data is calculated using 1-second bins in cleaned event files. If a bin has >2000 counts, and if more than 50% of those come from <1% of pixels, then it is considered to be noise-dominated and hence unusable.
| Quadrant | # 1 sec bins | Bins with >0 counts | Bins with >2000 counts | High rate bins dominated by noise | Noise dominated (total time) | Noise dominated (detector-on time) | Marked lightcurve |
|---|---|---|---|---|---|---|---|
| A | 7885 | 7879 | 887 | 887 | 11.25% | 11.26% | 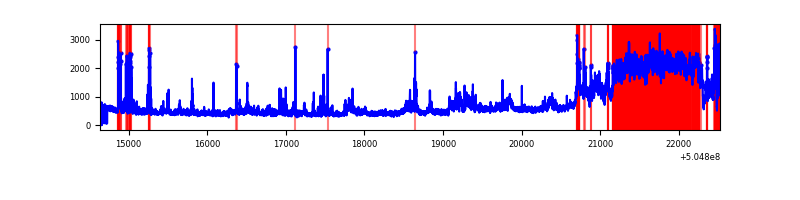 |
| B | 7885 | 7873 | 216 | 216 | 2.74% | 2.74% | 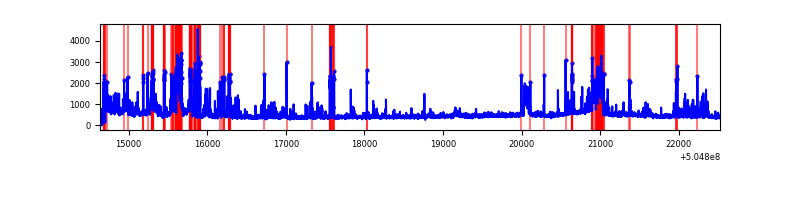 |
| C | 7887 | 7876 | 62 | 62 | 0.79% | 0.79% | 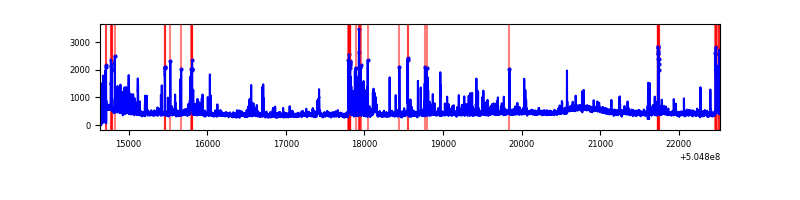 |
| D | 7875 | 7865 | 5287 | 5287 | 67.14% | 67.22% | 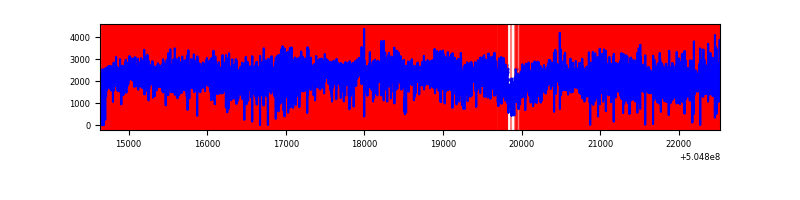 |
Top three noisy pixels from each quadrant. If the there are fewer than three noisy pixels in the level2.evt file, extra rows are filled as -1
| Pixel properties | Quadrant properties | ||||||
|---|---|---|---|---|---|---|---|
| Quadrant | DetID | PixID | Counts | Sigma | Mean | Median | Sigma |
| A | 12 | 115 | 2603210 | 12678.79 | 822 | 801 | 205.3 |
| A | 0 | 8 | 209108 | 1014.86 | 822 | 801 | 205.3 |
| A | 3 | 14 | 201345 | 977.04 | 822 | 801 | 205.3 |
| B | 5 | 172 | 1126538 | 6582.5 | 798 | 768 | 171.0 |
| B | 0 | 171 | 184492 | 1074.25 | 798 | 768 | 171.0 |
| B | 10 | 247 | 119687 | 695.33 | 798 | 768 | 171.0 |
| C | 15 | 147 | 249702 | 1110.98 | 814 | 804 | 224.0 |
| C | 9 | 38 | 215209 | 957.02 | 814 | 804 | 224.0 |
| C | 13 | 3 | 114207 | 506.19 | 814 | 804 | 224.0 |
| D | 7 | 70 | 13202752 | 132741.07 | 342 | 325 | 99.5 |
| D | 11 | 129 | 1501871 | 15096.98 | 342 | 325 | 99.5 |
| D | 8 | 160 | 443292 | 4453.72 | 342 | 325 | 99.5 |
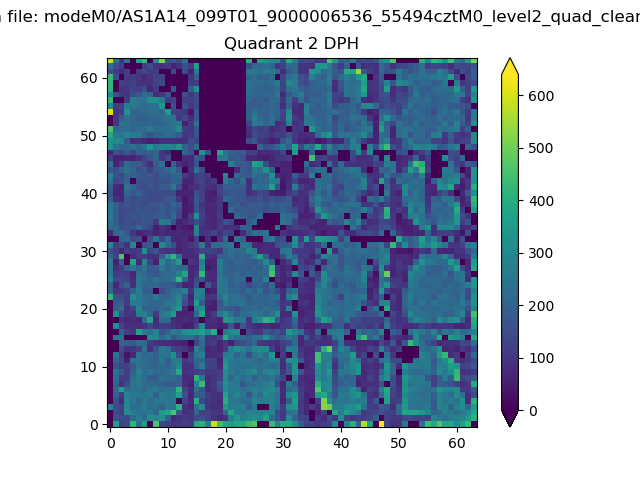
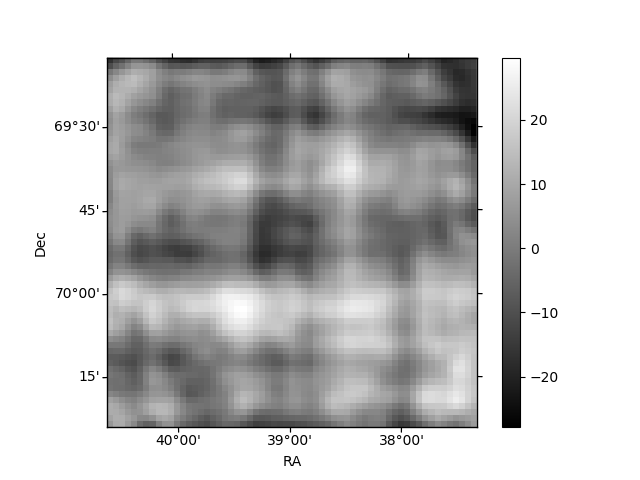
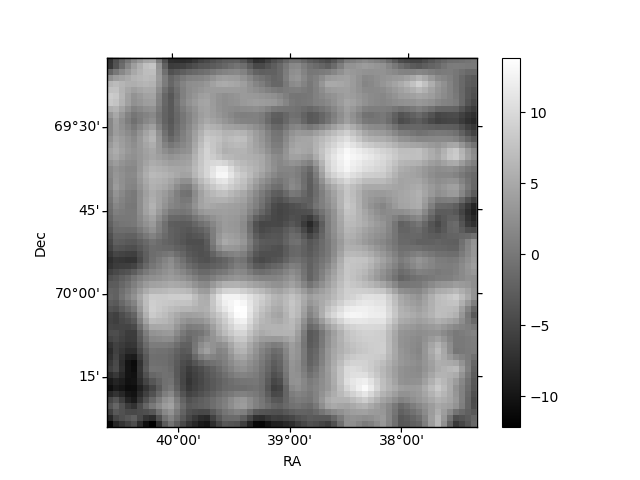
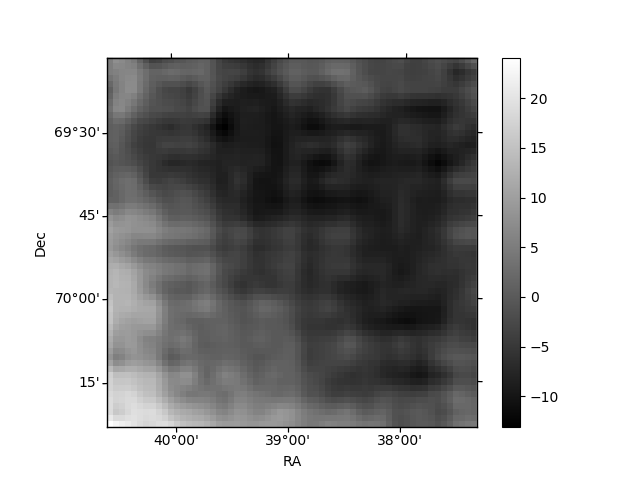
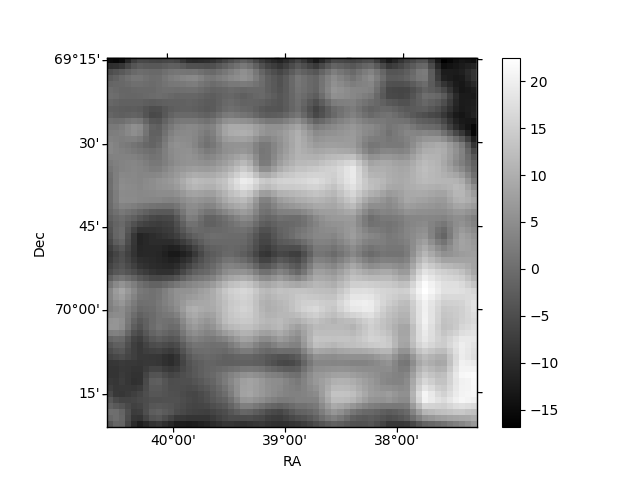
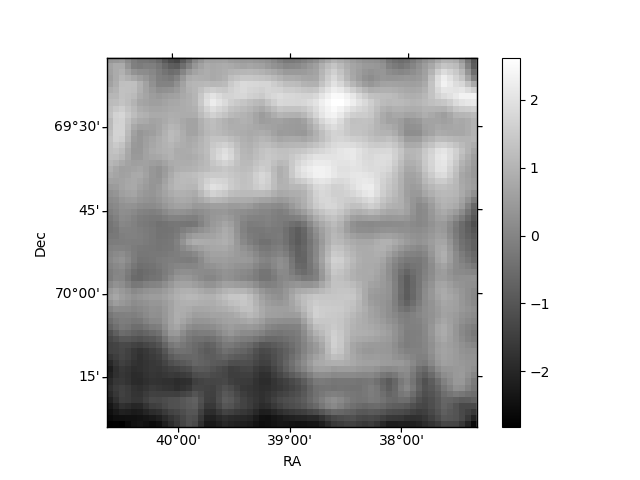
Histogram calculated using DETX and DETY for each event in the final _common_clean file
| Quadrant A | 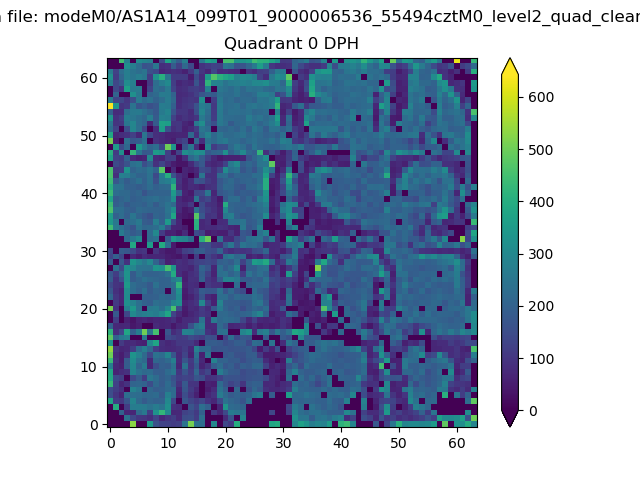 |
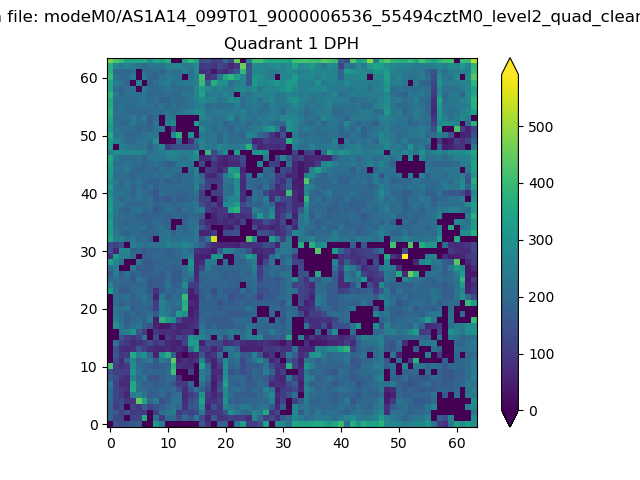 |
Quadrant B |
|---|---|---|---|
| Quadrant D | 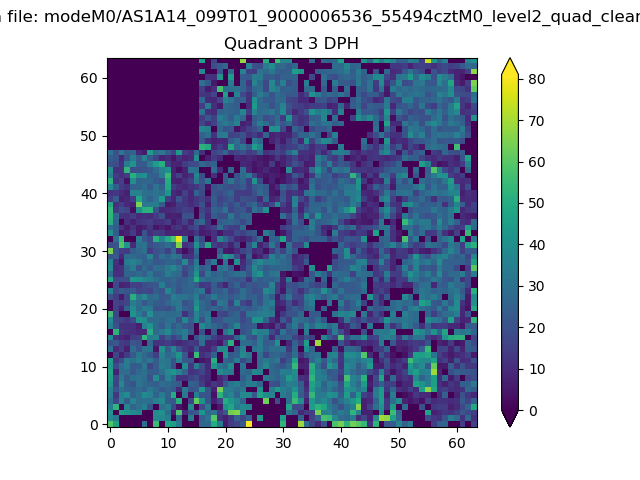 |
 |
Quadrant C |
| Plot type | Count rate plots | Images |
|---|---|---|
| Comparison with Poisson distribution Blue bars denote a histogram of data divided into 1 sec bins. Red curve is a Poisson curve with rate = median count rate of data. |
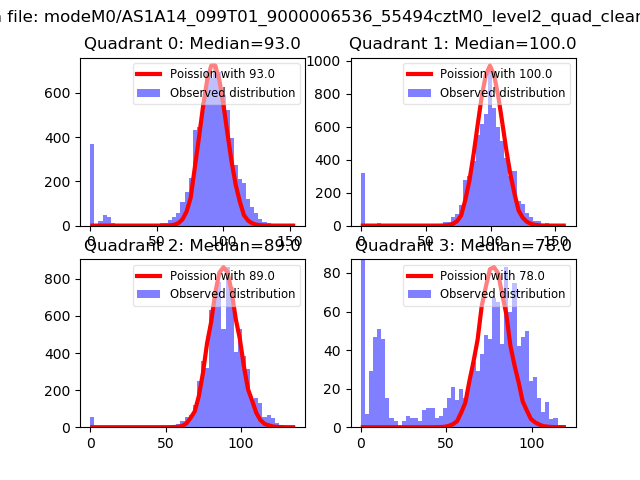 |
 |
| Quadrant-wise count rates Data is divided into 100 sec bins |
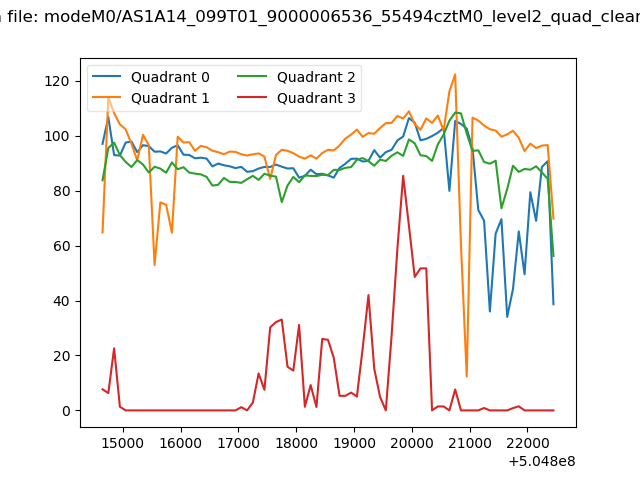 |
|
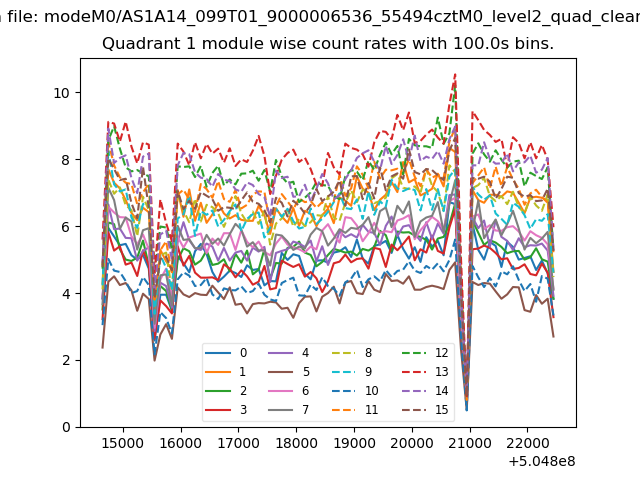
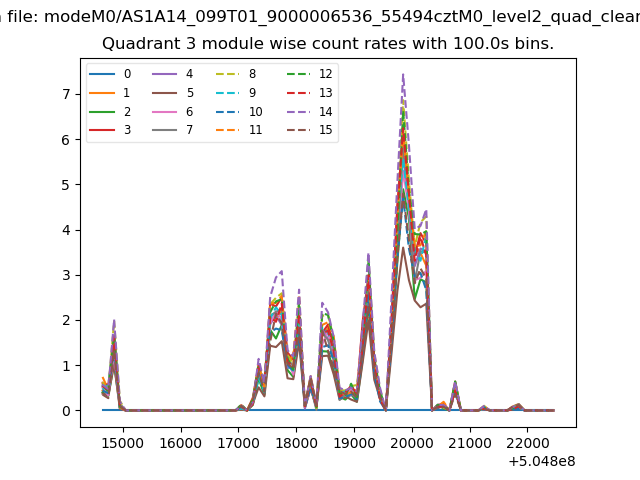
| Module-wise count rates for Quadrant A Data is divided into 100 sec bins |
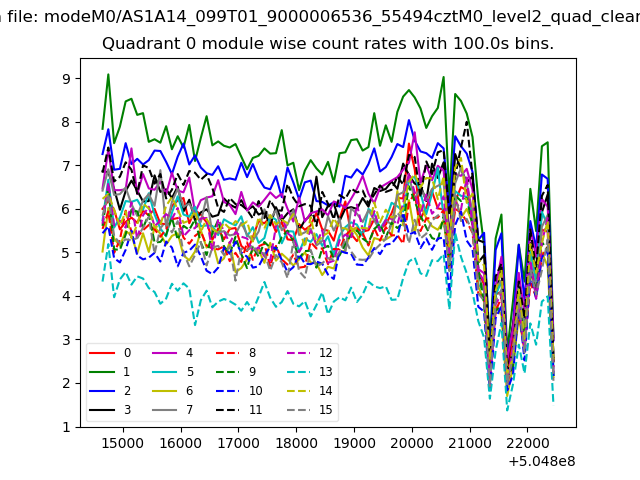 |
 |
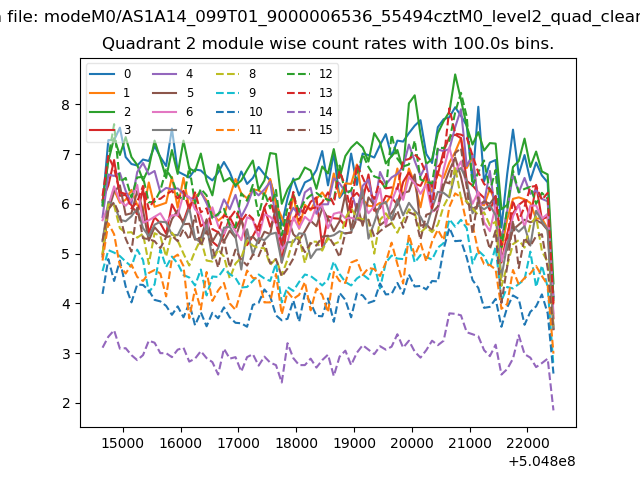
| Module-wise count rates for Quadrant B Data is divided into 100 sec bins |
 |
 |
| Module-wise count rates for Quadrant C Data is divided into 100 sec bins |
 |
 |
| Module-wise count rates for Quadrant D Data is divided into 100 sec bins |
 |
 |
| Parameter | Plot |
|---|---|
| CZT HV Monitor |  |
| D_VDD | 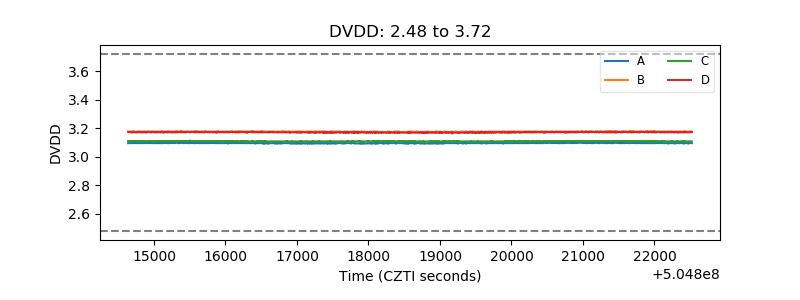 |
| Temperature 1 | 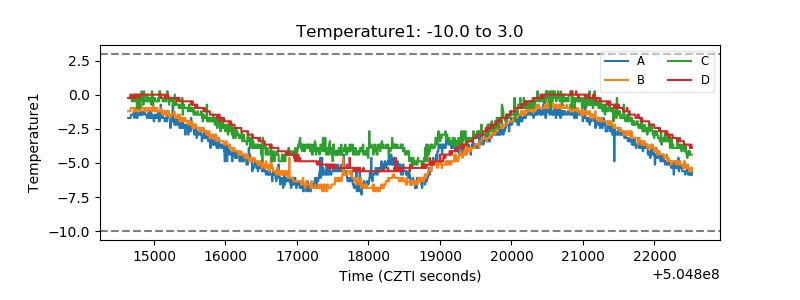 |
| Veto HV Monitor | 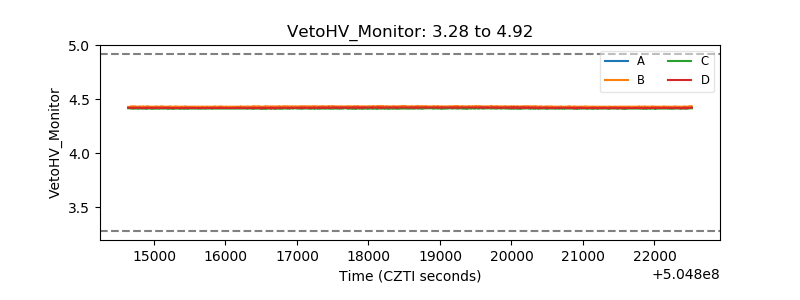 |
| Veto LLD | 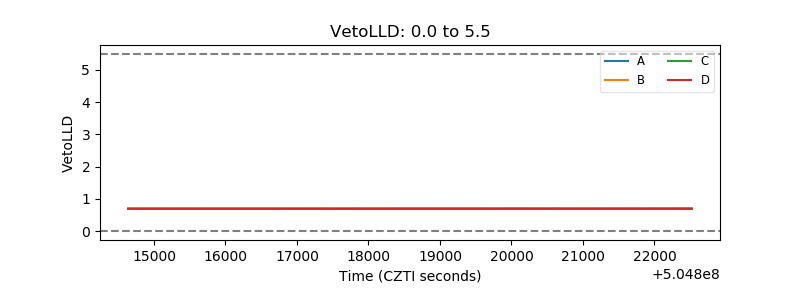 |
| Alpha Counter | 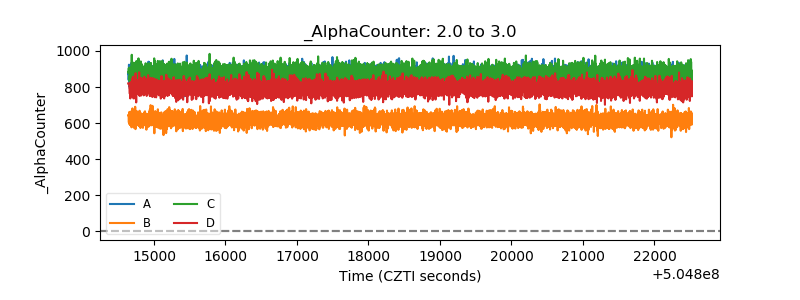 |
| _CPM_Rate | 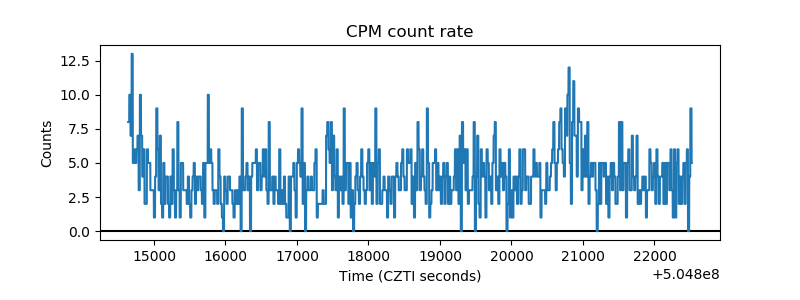 |
| CZT Counter | 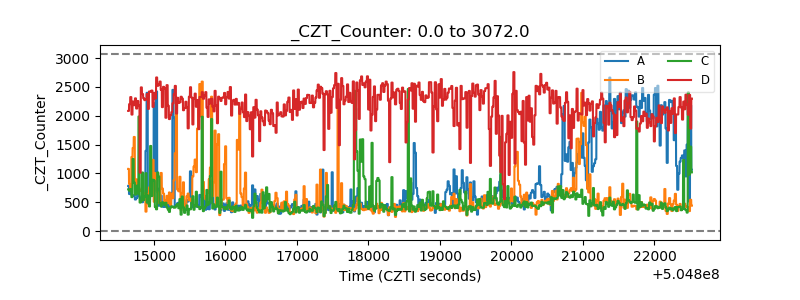 |
| +2.5 Volts monitor |  |
| +5 Volts monitor |  |
| _ROLL_ROT | 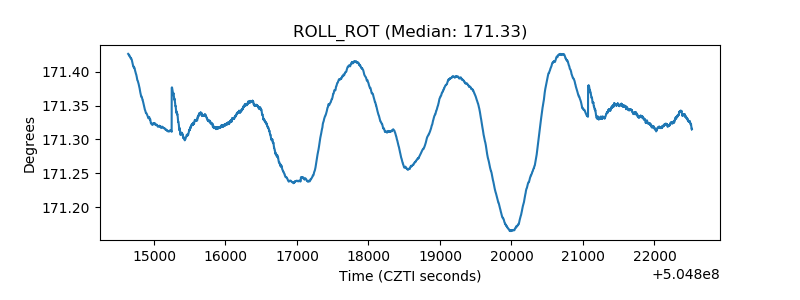 |
| _Roll_DEC | 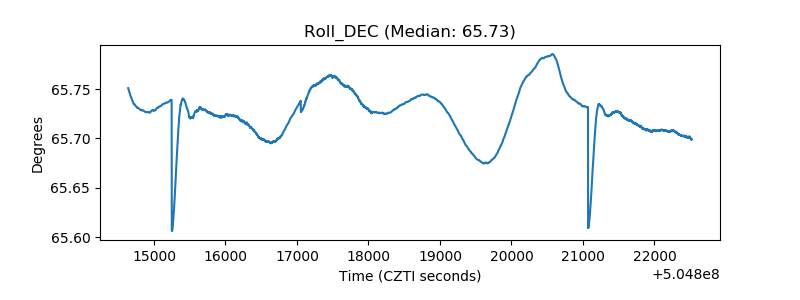 |
| _Roll_RA | 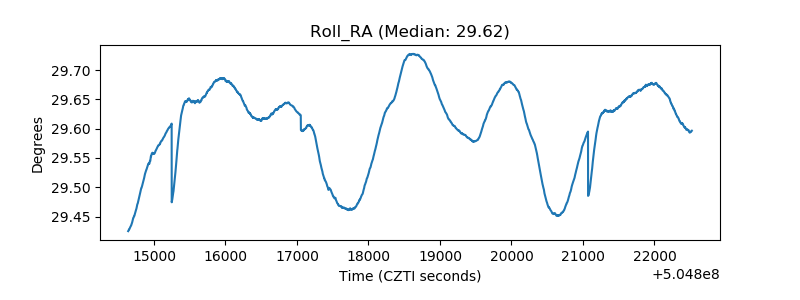 |
| Veto Counter | 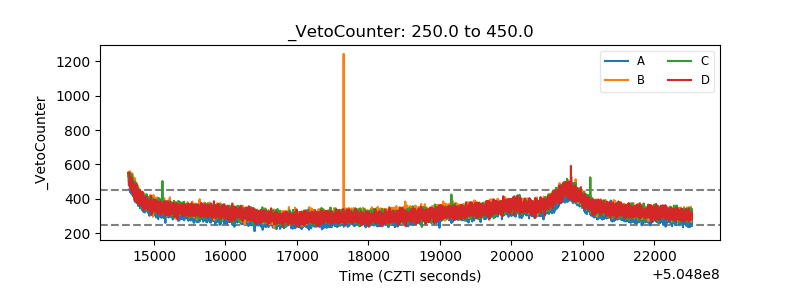 |