| Param | Original file | Final file |
|---|---|---|
| Filename | modeM0/AS1A14_099T01_9000006536_55495cztM0_level2.fits | modeM0/AS1A14_099T01_9000006536_55495cztM0_level2_quad_clean.evt |
| Size (bytes) | 908,504,640 | 90,878,400 |
| Size | 866.4 MB | 86.7 MB |
| Events in quadrant A | 7,601,666 | 658,977 |
| Events in quadrant B | 3,822,734 | 775,555 |
| Events in quadrant C | 4,839,645 | 671,573 |
| Events in quadrant D | 16,759,709 | 101,932 |
| Mode SS | |||
|---|---|---|---|
| Quadrant | BADHDUFLAG | Total packets | Discarded packets |
| A | 0 | 160 | 2 |
| B | 0 | 160 | 2 |
| C | 0 | 160 | 2 |
| D | 0 | 160 | 2 |
| Mode M0 | |||
|---|---|---|---|
| Quadrant | BADHDUFLAG | Total packets | Discarded packets |
| A | 0 | 28928 | 957 |
| B | 0 | 18059 | 1033 |
| C | 0 | 20459 | 397 |
| D | 0 | 56651 | 1595 |
| Quadrant | Total seconds | Saturated seconds | Saturation percentage |
|---|---|---|---|
| A | 7807 | 951 | 12.181376% |
| B | 7802 | 63 | 0.807485% |
| C | 7840 | 343 | 4.375000% |
| D | 7778 | 6784 | 87.220365% |
Noise dominated data is calculated using 1-second bins in cleaned event files. If a bin has >2000 counts, and if more than 50% of those come from <1% of pixels, then it is considered to be noise-dominated and hence unusable.
| Quadrant | # 1 sec bins | Bins with >0 counts | Bins with >2000 counts | High rate bins dominated by noise | Noise dominated (total time) | Noise dominated (detector-on time) | Marked lightcurve |
|---|---|---|---|---|---|---|---|
| A | 7872 | 7848 | 1127 | 1127 | 14.32% | 14.36% | 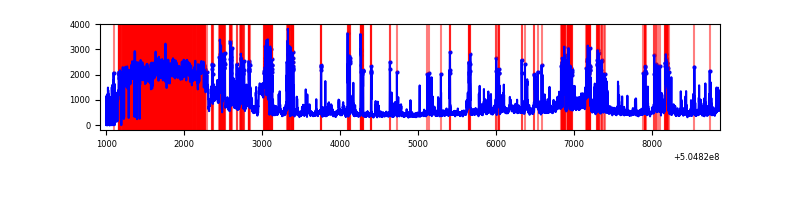 |
| B | 7844 | 7824 | 36 | 36 | 0.46% | 0.46% | 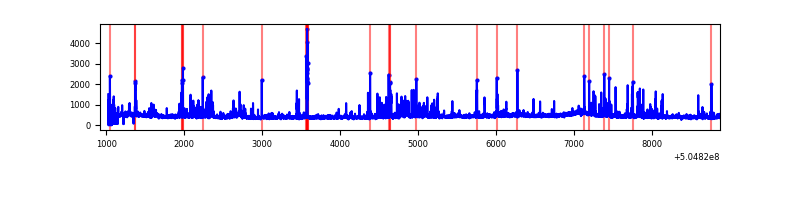 |
| C | 7949 | 7879 | 256 | 256 | 3.22% | 3.25% | 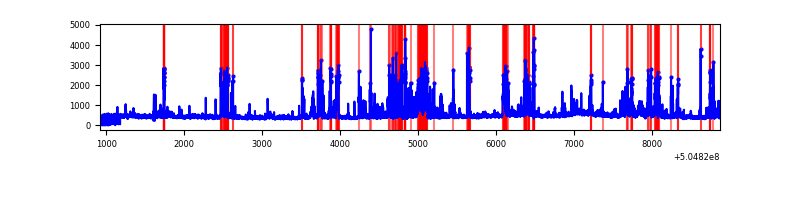 |
| D | 7862 | 7813 | 5108 | 5108 | 64.97% | 65.38% | 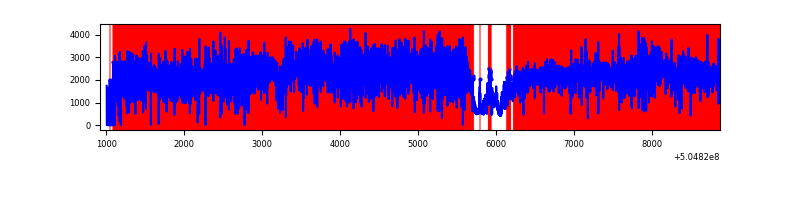 |
Top three noisy pixels from each quadrant. If the there are fewer than three noisy pixels in the level2.evt file, extra rows are filled as -1
| Pixel properties | Quadrant properties | ||||||
|---|---|---|---|---|---|---|---|
| Quadrant | DetID | PixID | Counts | Sigma | Mean | Median | Sigma |
| A | 12 | 115 | 2333840 | 11784.29 | 790 | 769 | 198.0 |
| A | 3 | 78 | 486481 | 2453.32 | 790 | 769 | 198.0 |
| A | 4 | 159 | 467937 | 2359.65 | 790 | 769 | 198.0 |
| B | 0 | 171 | 258479 | 1519.91 | 801 | 771 | 169.6 |
| B | 10 | 247 | 95485 | 558.61 | 801 | 771 | 169.6 |
| B | 5 | 172 | 89979 | 526.13 | 801 | 771 | 169.6 |
| C | 13 | 3 | 878036 | 4092.87 | 787 | 777 | 214.3 |
| C | 15 | 147 | 437841 | 2039.13 | 787 | 777 | 214.3 |
| C | 9 | 38 | 110200 | 510.52 | 787 | 777 | 214.3 |
| D | 7 | 70 | 12759461 | 111982.16 | 389 | 373 | 113.9 |
| D | 11 | 129 | 1785652 | 15668.78 | 389 | 373 | 113.9 |
| D | 6 | 239 | 161409 | 1413.36 | 389 | 373 | 113.9 |
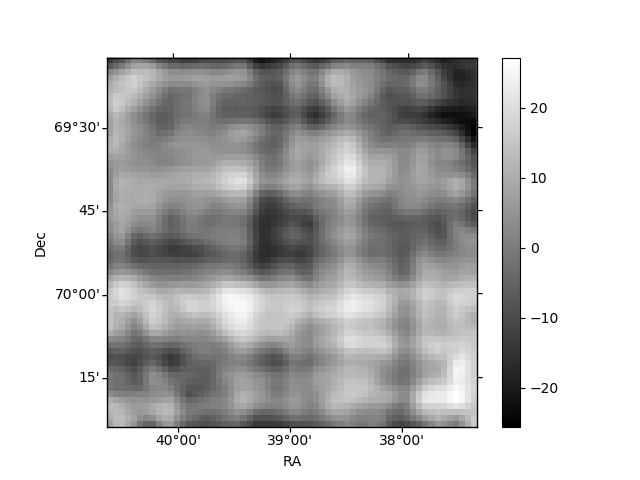
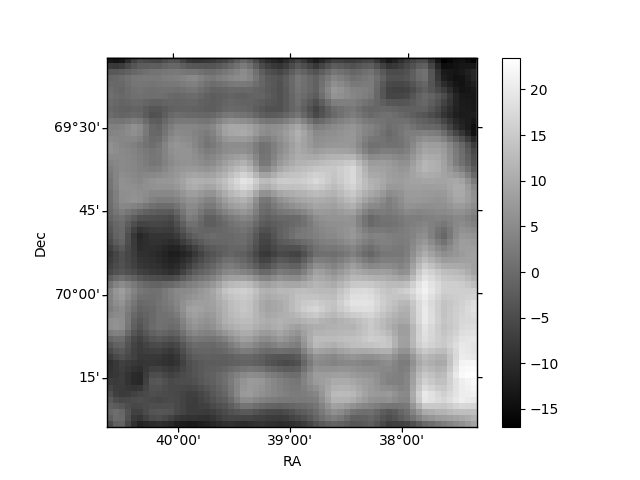
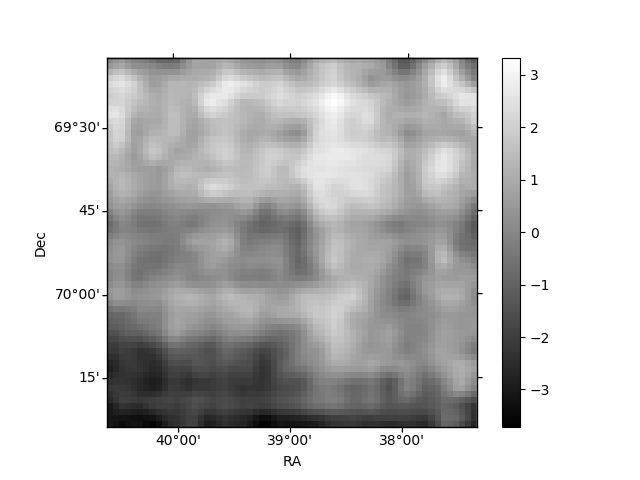
Histogram calculated using DETX and DETY for each event in the final _common_clean file
| Quadrant A | 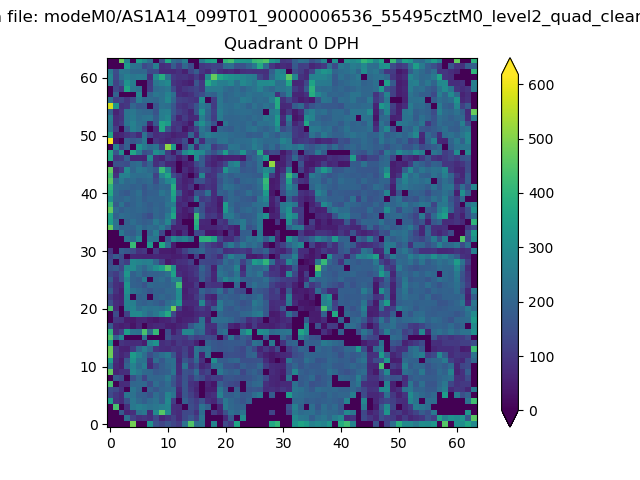 |
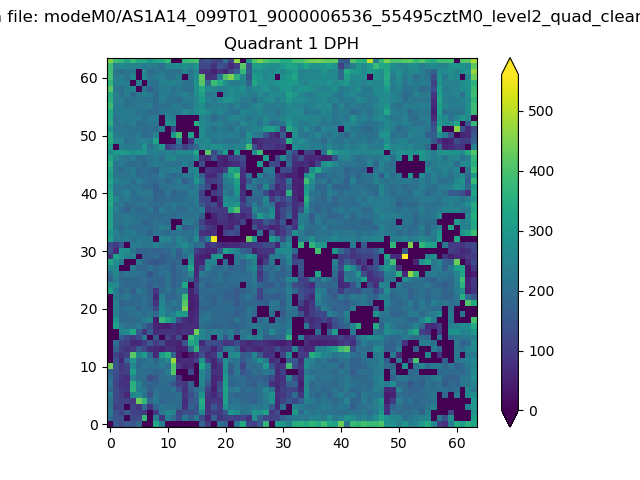 |
Quadrant B |
|---|---|---|---|
| Quadrant D | 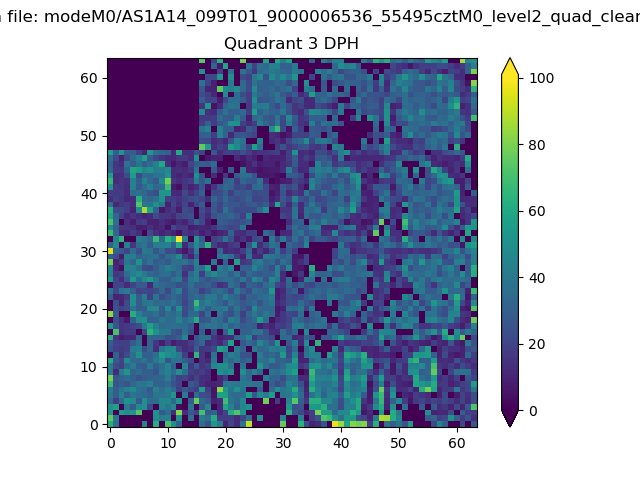 |
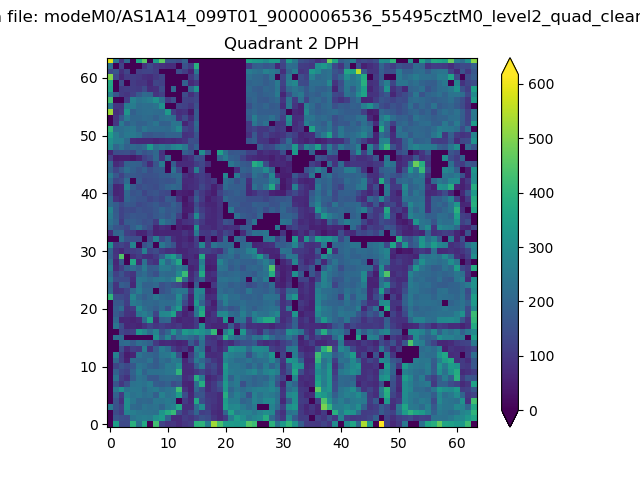 |
Quadrant C |
| Plot type | Count rate plots | Images |
|---|---|---|
| Comparison with Poisson distribution Blue bars denote a histogram of data divided into 1 sec bins. Red curve is a Poisson curve with rate = median count rate of data. |
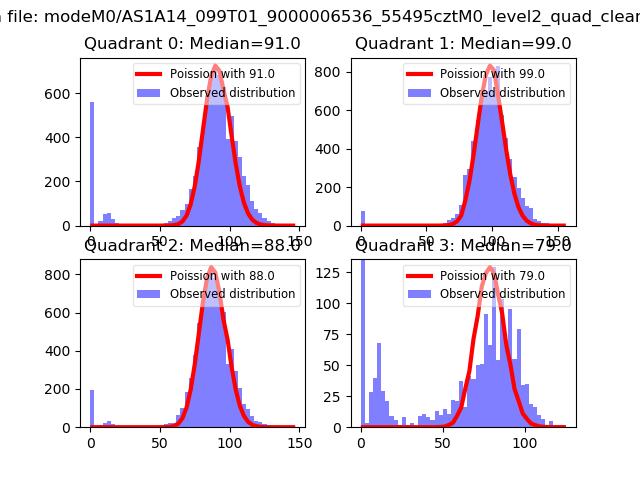 |
 |
| Quadrant-wise count rates Data is divided into 100 sec bins |
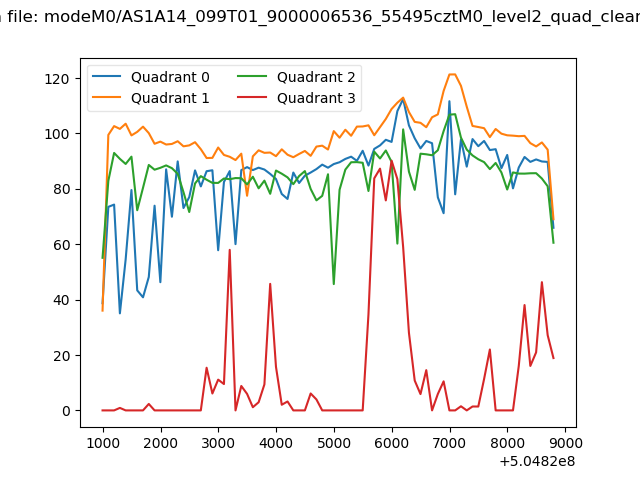 |
|
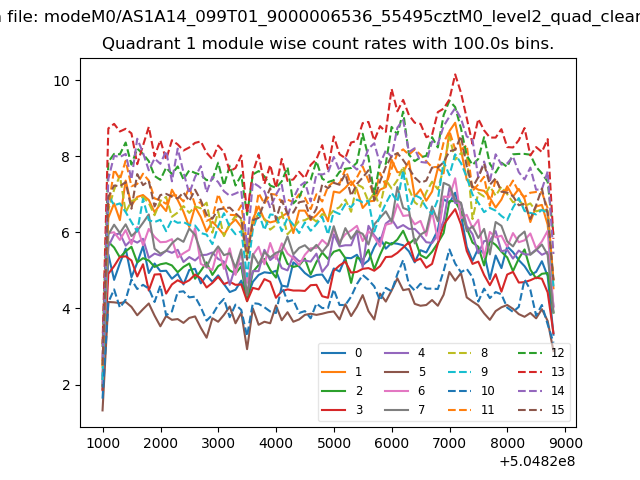
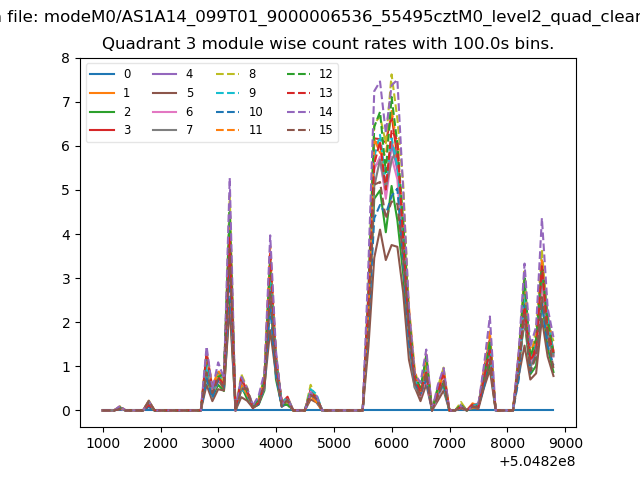
| Module-wise count rates for Quadrant A Data is divided into 100 sec bins |
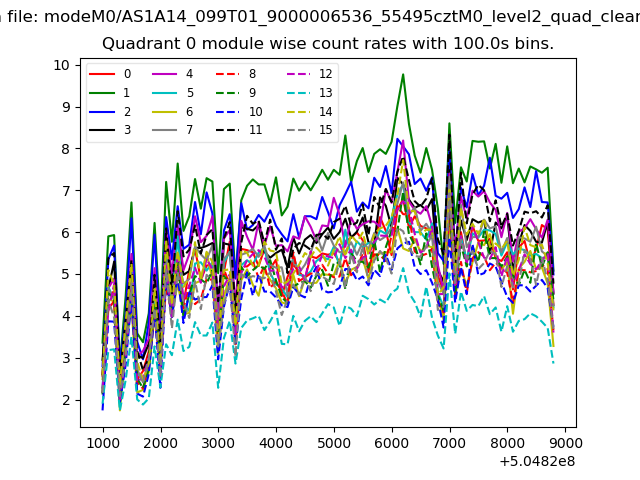 |
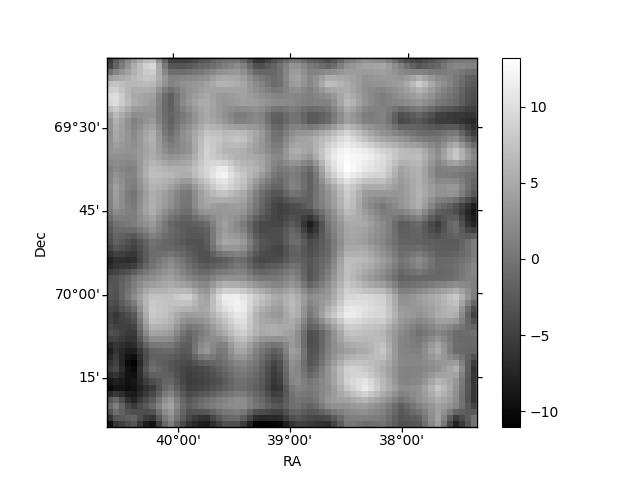 |
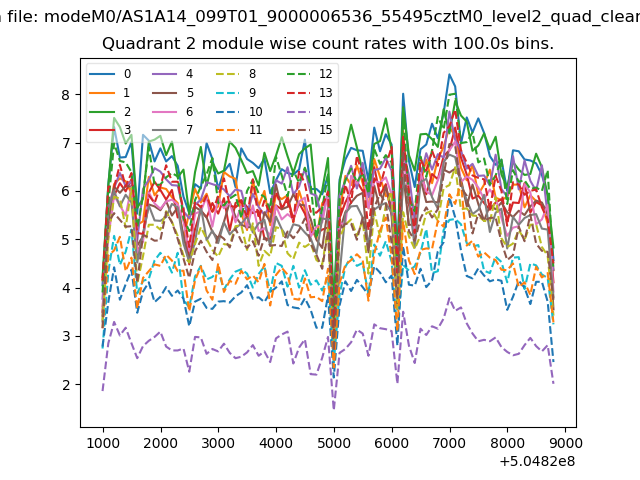
| Module-wise count rates for Quadrant B Data is divided into 100 sec bins |
 |
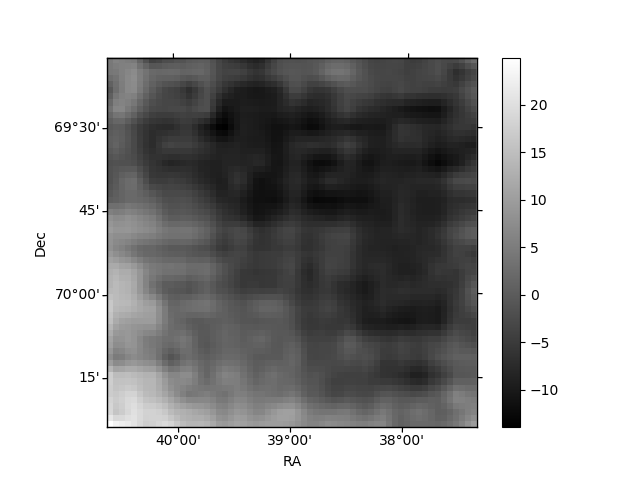 |
| Module-wise count rates for Quadrant C Data is divided into 100 sec bins |
 |
 |
| Module-wise count rates for Quadrant D Data is divided into 100 sec bins |
 |
 |
| Parameter | Plot |
|---|---|
| CZT HV Monitor |  |
| D_VDD | 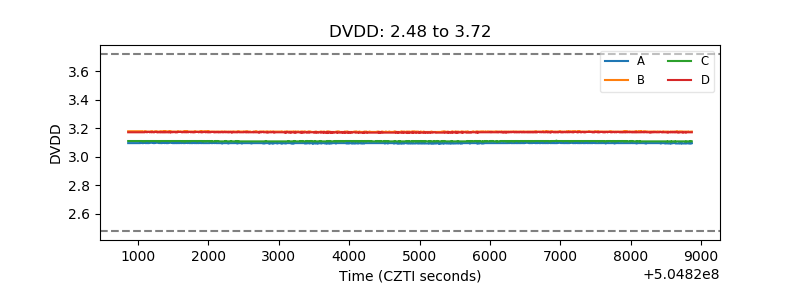 |
| Temperature 1 | 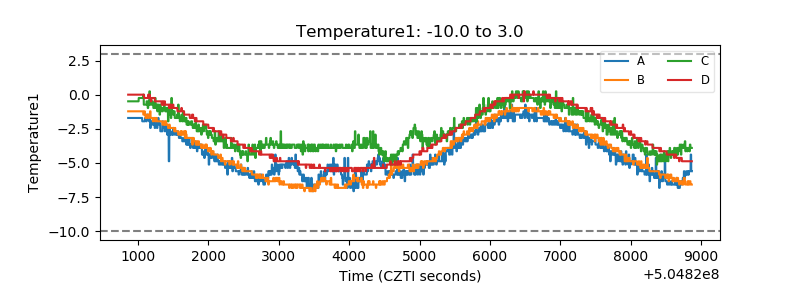 |
| Veto HV Monitor | 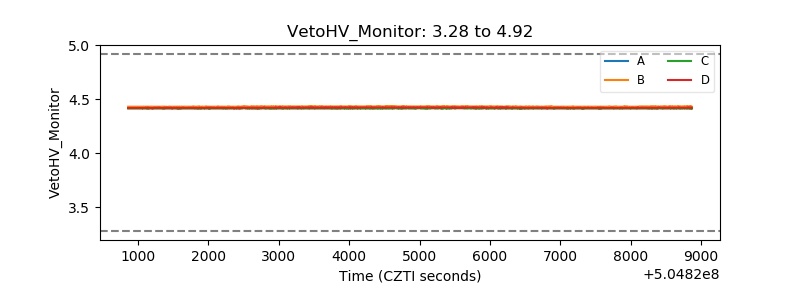 |
| Veto LLD | 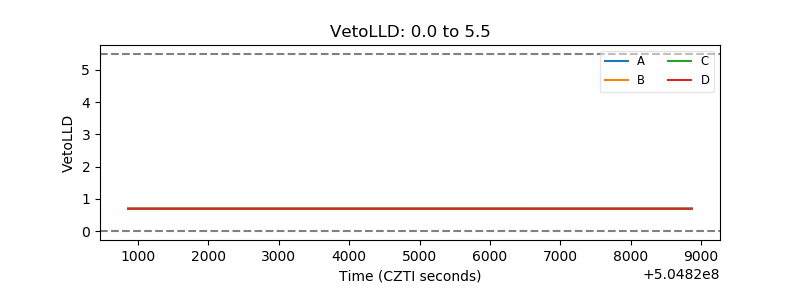 |
| Alpha Counter | 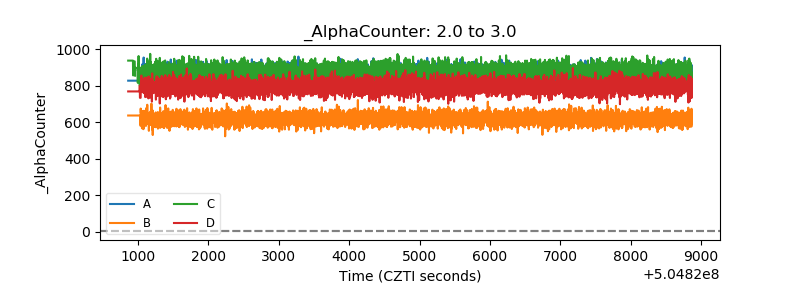 |
| _CPM_Rate | 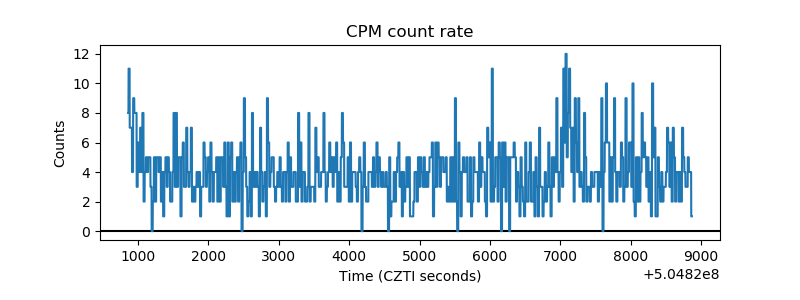 |
| CZT Counter | 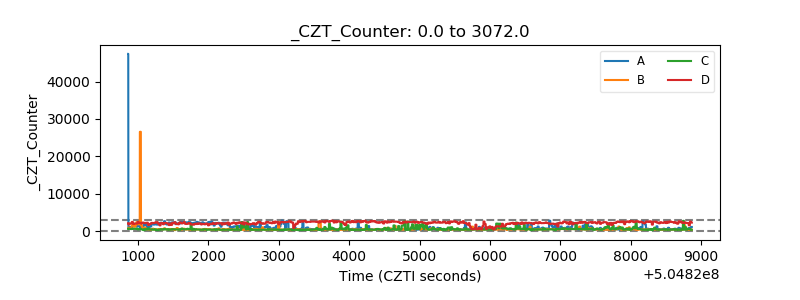 |
| +2.5 Volts monitor |  |
| +5 Volts monitor | 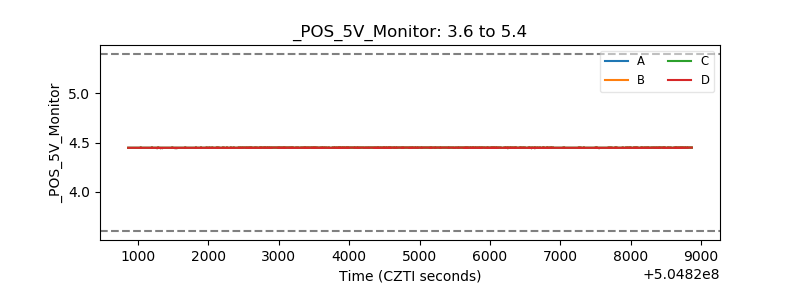 |
| _ROLL_ROT | 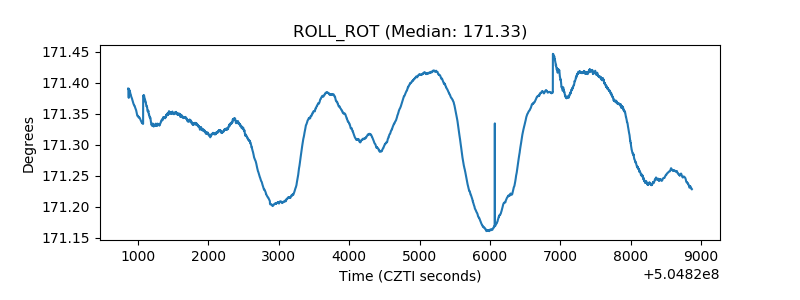 |
| _Roll_DEC | 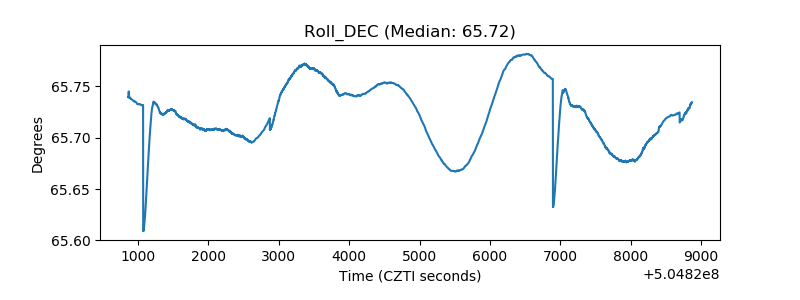 |
| _Roll_RA | 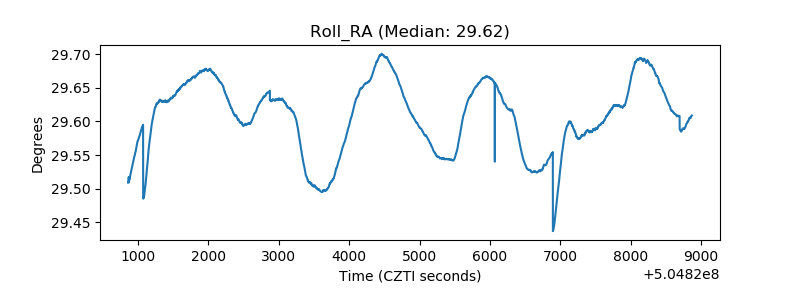 |
| Veto Counter | 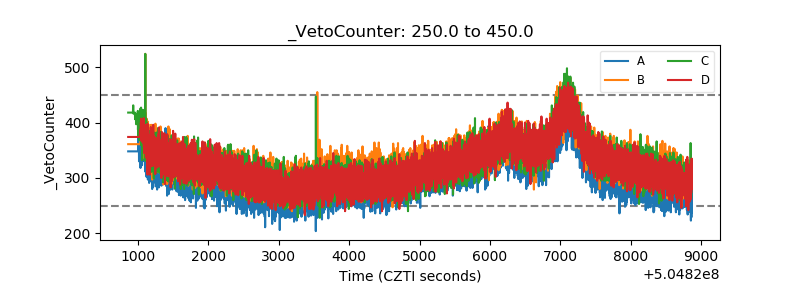 |