| Param | Original file | Final file |
|---|---|---|
| Filename | modeM0/AS1A14_099T01_9000006536_55498cztM0_level2.fits | modeM0/AS1A14_099T01_9000006536_55498cztM0_level2_quad_clean.evt |
| Size (bytes) | 2,078,303,040 | 234,463,680 |
| Size | 1.9 GB | 223.6 MB |
| Events in quadrant A | 14,230,520 | 1,641,394 |
| Events in quadrant B | 10,025,133 | 1,862,668 |
| Events in quadrant C | 13,635,051 | 1,593,078 |
| Events in quadrant D | 37,559,433 | 678,318 |
| Mode M9 | |||
|---|---|---|---|
| Quadrant | BADHDUFLAG | Total packets | Discarded packets |
| A | 0 | 10 | 0 |
| B | 0 | 10 | 0 |
| C | 0 | 10 | 0 |
| D | 0 | 10 | 0 |
| Mode SS | |||
|---|---|---|---|
| Quadrant | BADHDUFLAG | Total packets | Discarded packets |
| A | 0 | 388 | 0 |
| B | 0 | 388 | 0 |
| C | 0 | 388 | 0 |
| D | 0 | 388 | 0 |
| Mode M0 | |||
|---|---|---|---|
| Quadrant | BADHDUFLAG | Total packets | Discarded packets |
| A | 0 | 56005 | 3 |
| B | 0 | 44170 | 3 |
| C | 0 | 54538 | 3 |
| D | 0 | 124717 | 14 |
| Quadrant | Total seconds | Saturated seconds | Saturation percentage |
|---|---|---|---|
| A | 19189 | 1311 | 6.832039% |
| B | 19189 | 349 | 1.818750% |
| C | 19190 | 1245 | 6.487754% |
| D | 19188 | 11740 | 61.184073% |
Noise dominated data is calculated using 1-second bins in cleaned event files. If a bin has >2000 counts, and if more than 50% of those come from <1% of pixels, then it is considered to be noise-dominated and hence unusable.
| Quadrant | # 1 sec bins | Bins with >0 counts | Bins with >2000 counts | High rate bins dominated by noise | Noise dominated (total time) | Noise dominated (detector-on time) | Marked lightcurve |
|---|---|---|---|---|---|---|---|
| A | 20174 | 19192 | 1018 | 1018 | 5.05% | 5.30% | 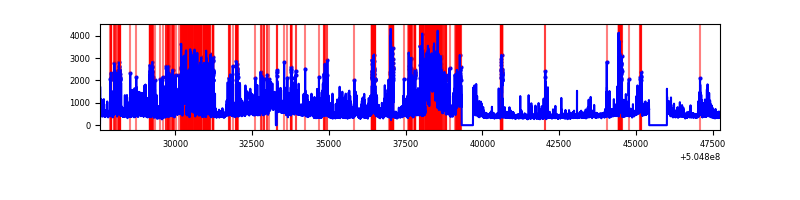 |
| B | 20174 | 19192 | 150 | 150 | 0.74% | 0.78% | 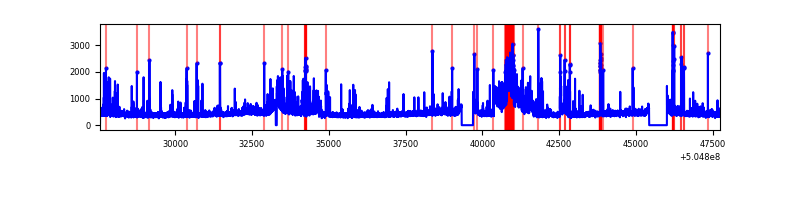 |
| C | 20175 | 19193 | 1114 | 1114 | 5.52% | 5.80% | 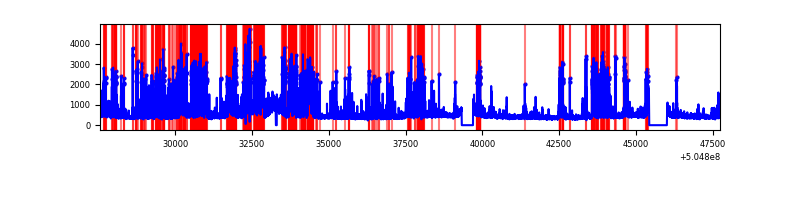 |
| D | 20174 | 19191 | 10409 | 10409 | 51.60% | 54.24% | 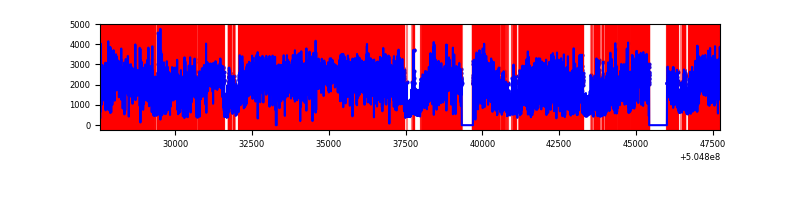 |
Top three noisy pixels from each quadrant. If the there are fewer than three noisy pixels in the level2.evt file, extra rows are filled as -1
| Pixel properties | Quadrant properties | ||||||
|---|---|---|---|---|---|---|---|
| Quadrant | DetID | PixID | Counts | Sigma | Mean | Median | Sigma |
| A | 4 | 159 | 3203029 | 6663.62 | 1946 | 1894 | 480.4 |
| A | 3 | 78 | 1281447 | 2663.57 | 1946 | 1894 | 480.4 |
| A | 0 | 8 | 779656 | 1619.02 | 1946 | 1894 | 480.4 |
| B | 5 | 172 | 1594265 | 3808.22 | 1983 | 1907 | 418.1 |
| B | 10 | 247 | 165466 | 391.16 | 1983 | 1907 | 418.1 |
| B | 7 | 252 | 136760 | 322.51 | 1983 | 1907 | 418.1 |
| C | 13 | 3 | 4546309 | 8627.71 | 1920 | 1901 | 526.7 |
| C | 15 | 147 | 437179 | 826.39 | 1920 | 1901 | 526.7 |
| C | 9 | 237 | 338089 | 638.26 | 1920 | 1901 | 526.7 |
| D | 7 | 70 | 25760098 | 68974.74 | 1308 | 1247 | 373.5 |
| D | 11 | 129 | 3517134 | 9414.53 | 1308 | 1247 | 373.5 |
| D | 2 | 153 | 1332456 | 3564.59 | 1308 | 1247 | 373.5 |
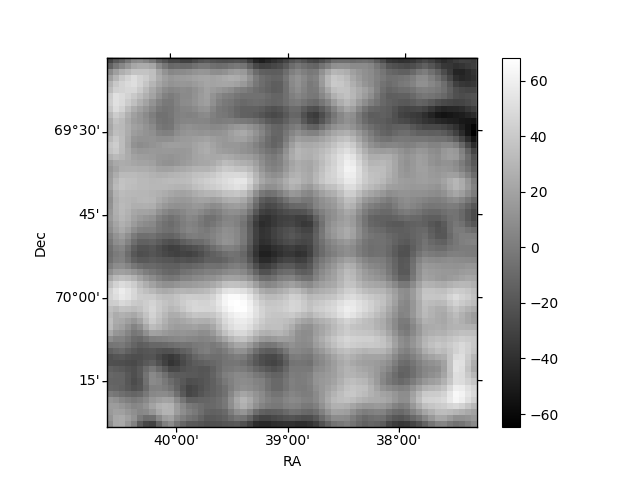
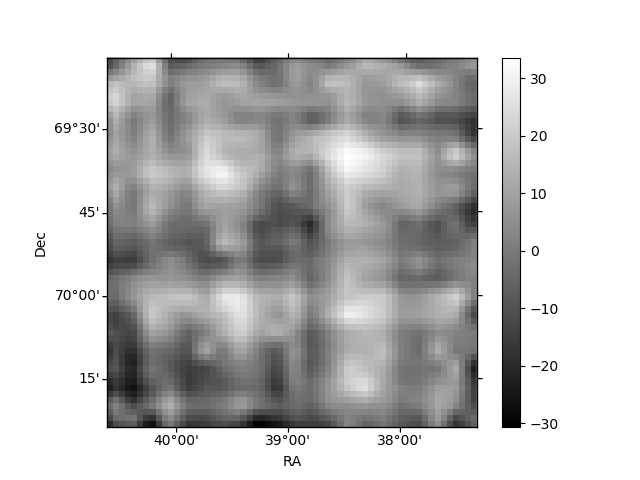
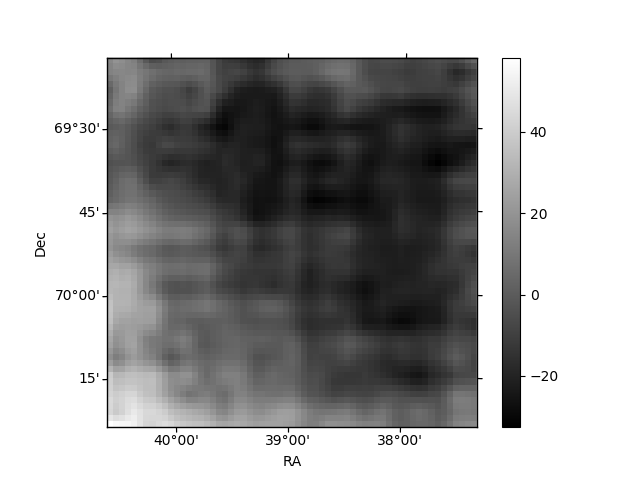
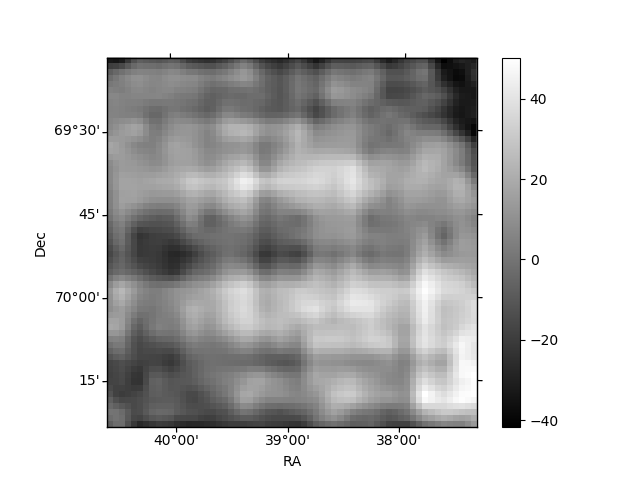
Histogram calculated using DETX and DETY for each event in the final _common_clean file
| Quadrant A | 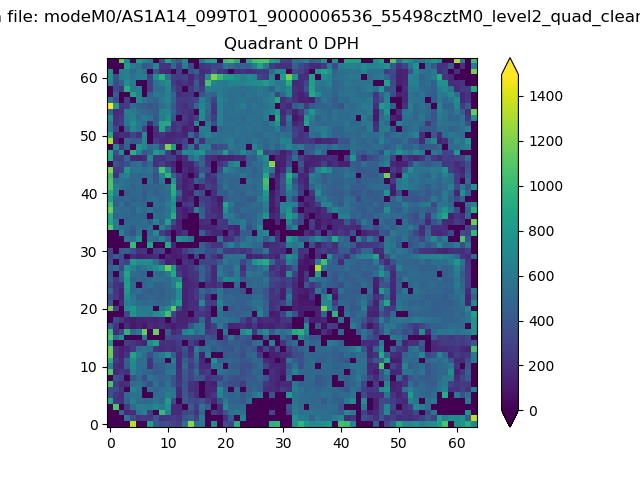 |
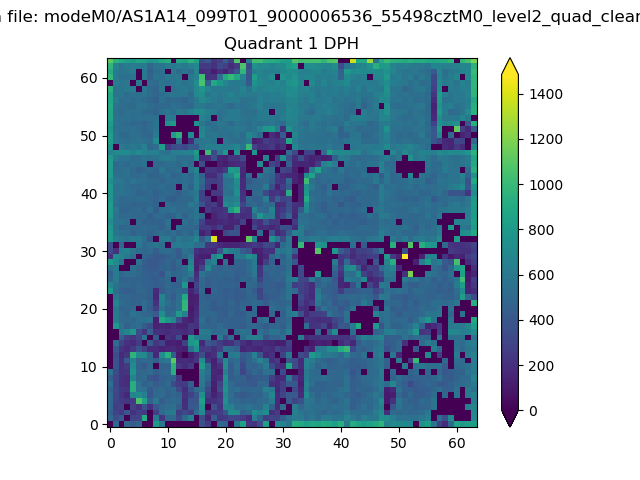 |
Quadrant B |
|---|---|---|---|
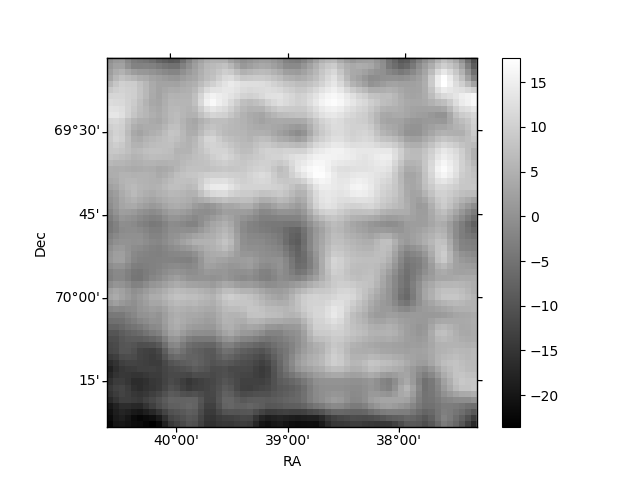
| Quadrant D | 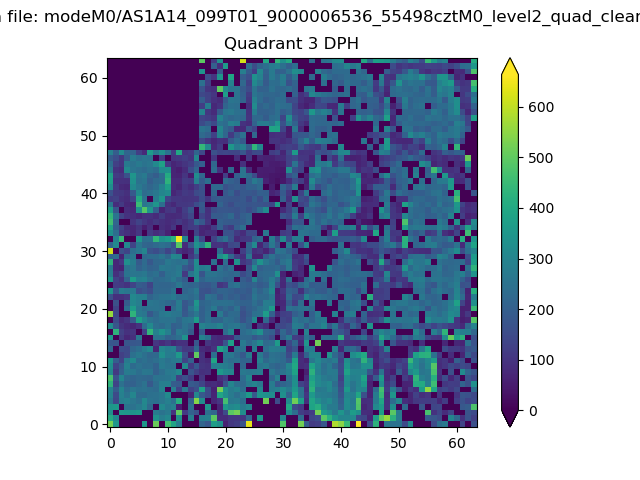 |
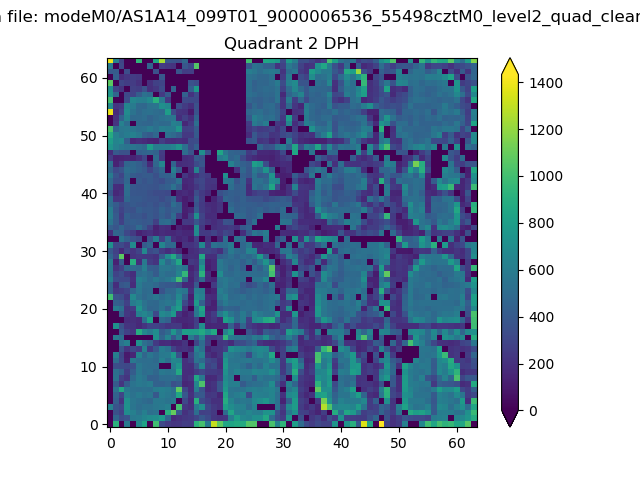 |
Quadrant C |
| Plot type | Count rate plots | Images |
|---|---|---|
| Comparison with Poisson distribution Blue bars denote a histogram of data divided into 1 sec bins. Red curve is a Poisson curve with rate = median count rate of data. |
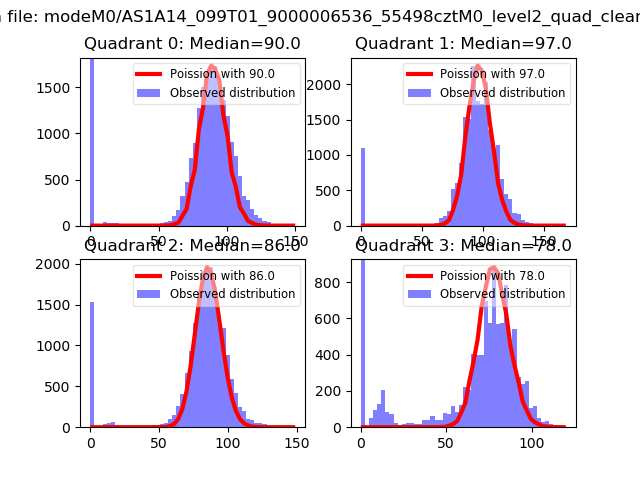 |
 |
| Quadrant-wise count rates Data is divided into 100 sec bins |
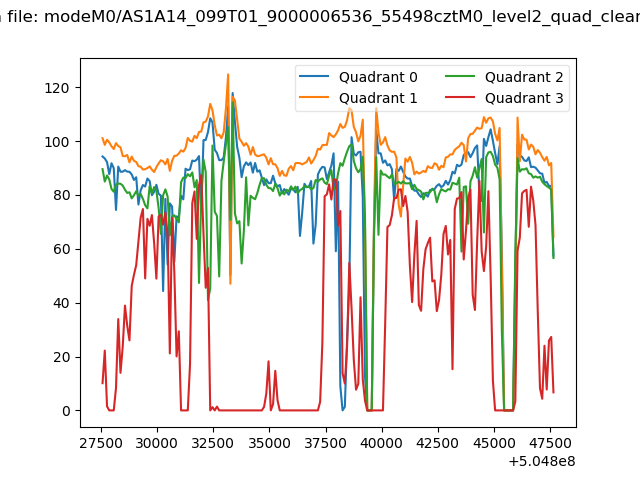 |
|
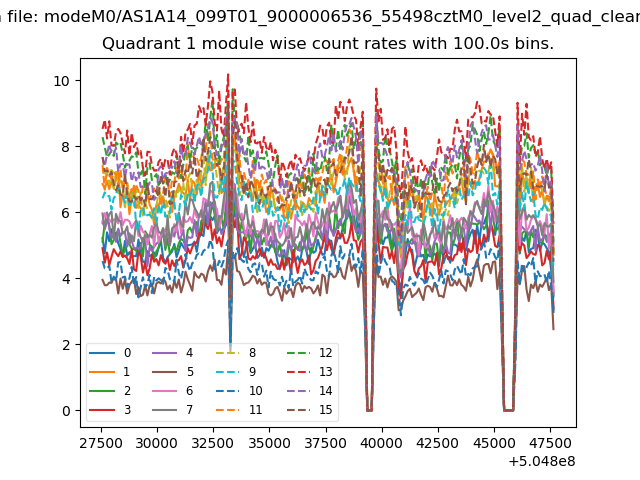
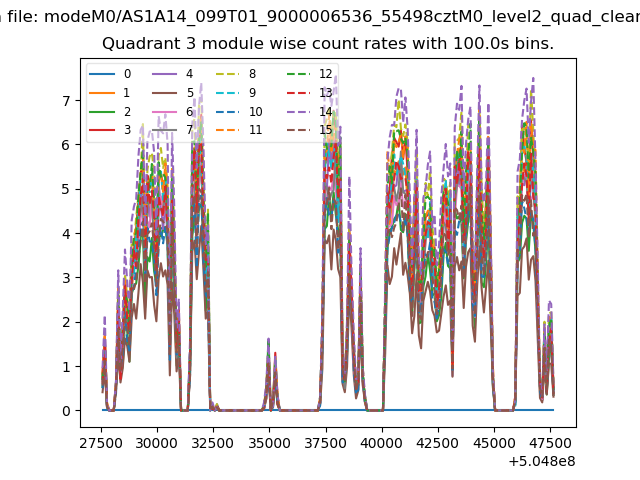
| Module-wise count rates for Quadrant A Data is divided into 100 sec bins |
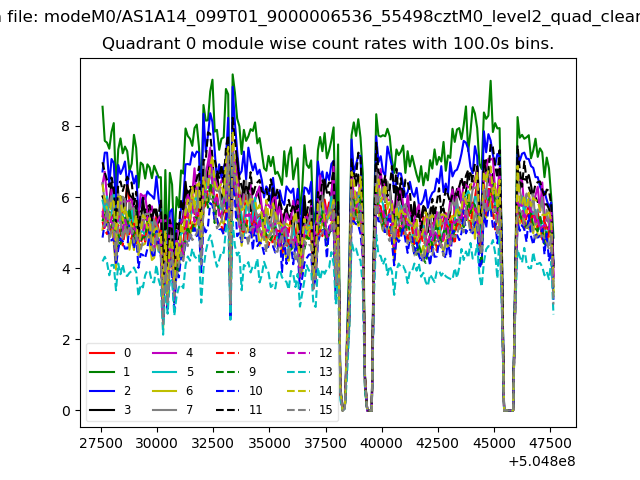 |
 |
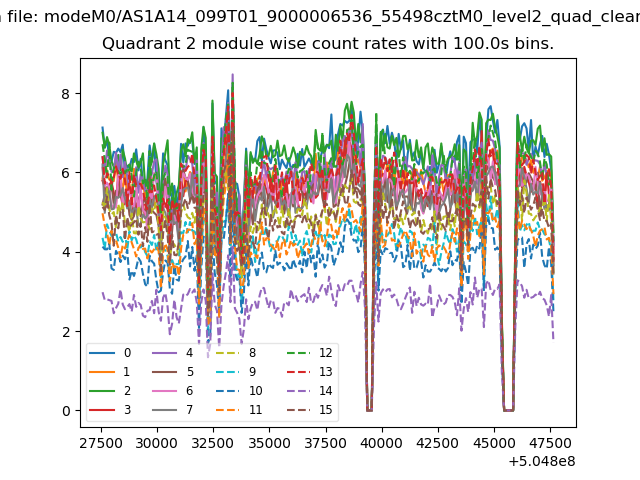
| Module-wise count rates for Quadrant B Data is divided into 100 sec bins |
 |
 |
| Module-wise count rates for Quadrant C Data is divided into 100 sec bins |
 |
 |
| Module-wise count rates for Quadrant D Data is divided into 100 sec bins |
 |
 |
| Parameter | Plot |
|---|---|
| CZT HV Monitor | 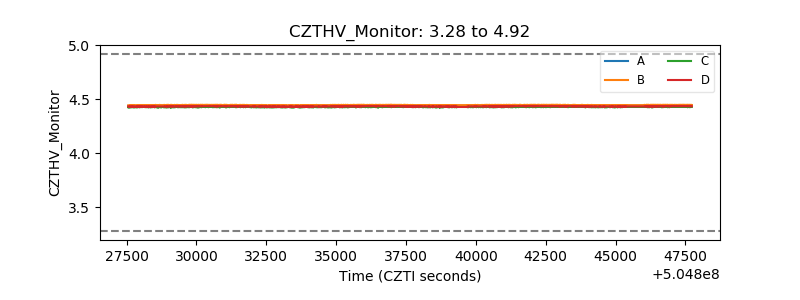 |
| D_VDD | 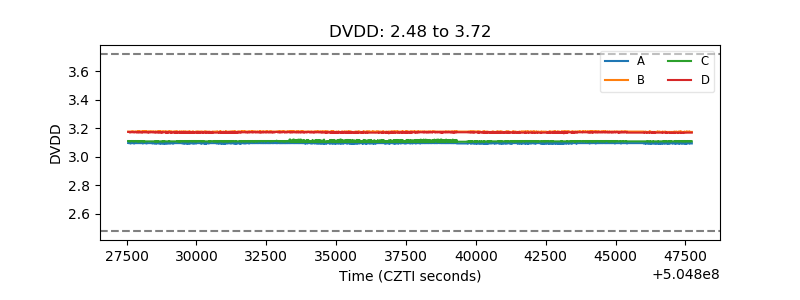 |
| Temperature 1 | 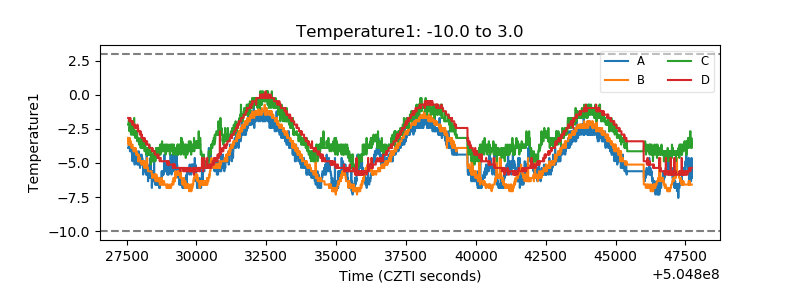 |
| Veto HV Monitor | 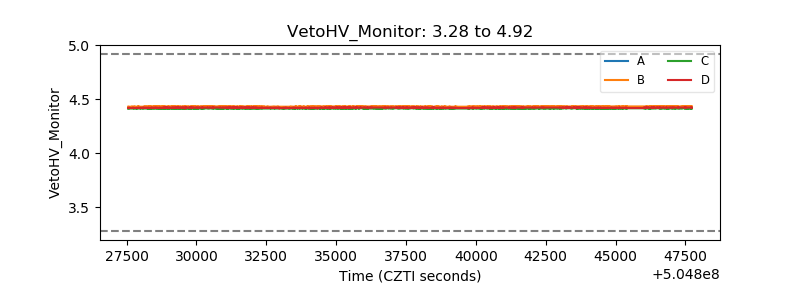 |
| Veto LLD | 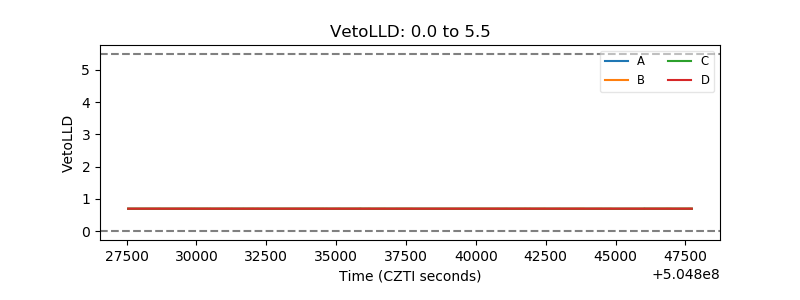 |
| Alpha Counter | 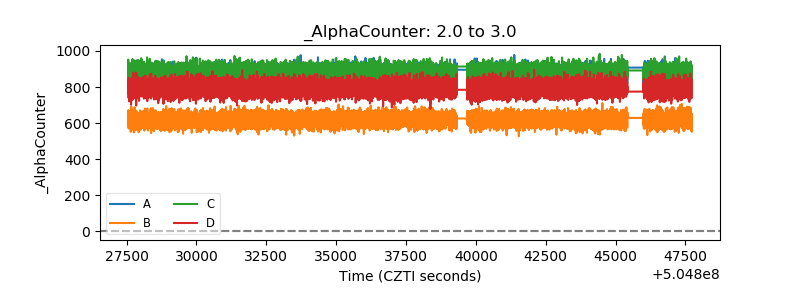 |
| _CPM_Rate | 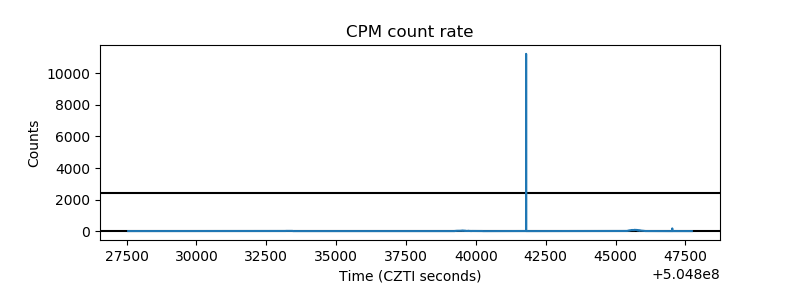 |
| CZT Counter | 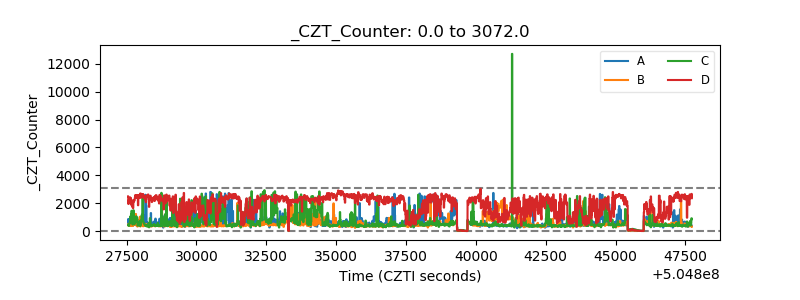 |
| +2.5 Volts monitor | 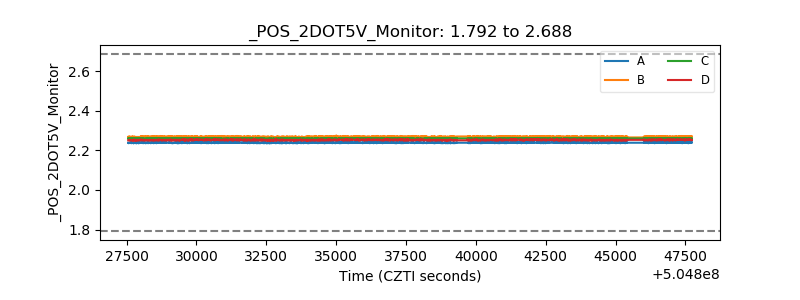 |
| +5 Volts monitor |  |
| _ROLL_ROT | 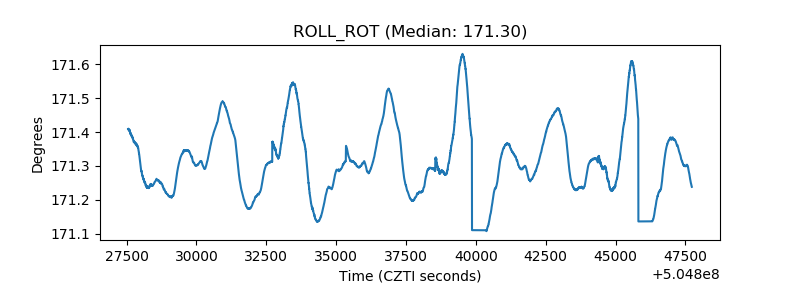 |
| _Roll_DEC | 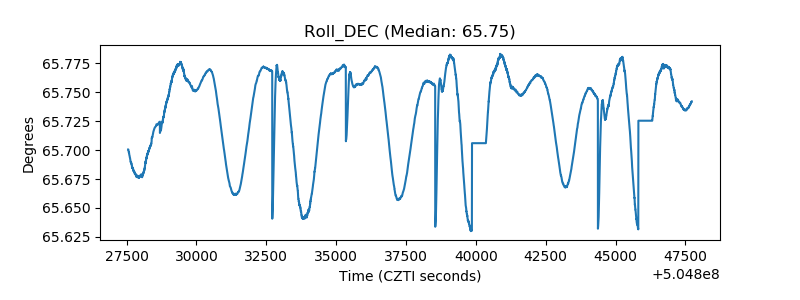 |
| _Roll_RA | 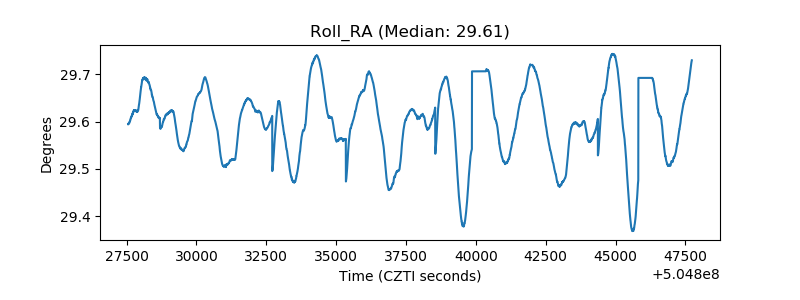 |
| Veto Counter | 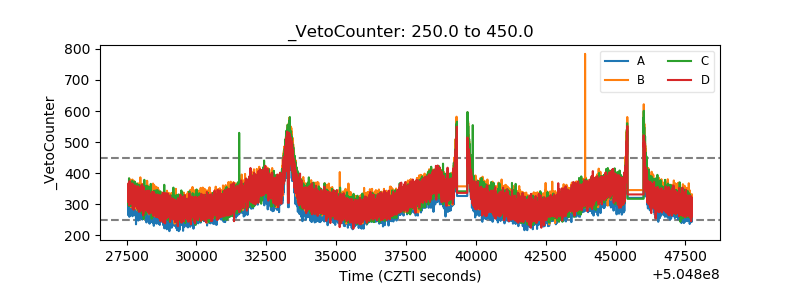 |