| Param | Original file | Final file |
|---|---|---|
| Filename | modeM0/AS1A14_099T01_9000006536_55499cztM0_level2.fits | modeM0/AS1A14_099T01_9000006536_55499cztM0_level2_quad_clean.evt |
| Size (bytes) | 651,983,040 | 84,533,760 |
| Size | 621.8 MB | 80.6 MB |
| Events in quadrant A | 3,502,203 | 605,570 |
| Events in quadrant B | 3,752,485 | 643,034 |
| Events in quadrant C | 4,561,742 | 564,134 |
| Events in quadrant D | 11,801,458 | 282,671 |
| Mode M9 | |||
|---|---|---|---|
| Quadrant | BADHDUFLAG | Total packets | Discarded packets |
| A | 0 | 8 | 0 |
| B | 0 | 8 | 0 |
| C | 0 | 8 | 0 |
| D | 0 | 8 | 0 |
| Mode SS | |||
|---|---|---|---|
| Quadrant | BADHDUFLAG | Total packets | Discarded packets |
| A | 0 | 136 | 0 |
| B | 0 | 136 | 0 |
| C | 0 | 136 | 0 |
| D | 0 | 136 | 0 |
| Mode M0 | |||
|---|---|---|---|
| Quadrant | BADHDUFLAG | Total packets | Discarded packets |
| A | 0 | 15392 | 133 |
| B | 0 | 16249 | 133 |
| C | 0 | 18669 | 189 |
| D | 0 | 40000 | 436 |
| Quadrant | Total seconds | Saturated seconds | Saturation percentage |
|---|---|---|---|
| A | 6658 | 80 | 1.201562% |
| B | 6653 | 156 | 2.344807% |
| C | 6658 | 255 | 3.829979% |
| D | 6635 | 3510 | 52.901281% |
Noise dominated data is calculated using 1-second bins in cleaned event files. If a bin has >2000 counts, and if more than 50% of those come from <1% of pixels, then it is considered to be noise-dominated and hence unusable.
| Quadrant | # 1 sec bins | Bins with >0 counts | Bins with >2000 counts | High rate bins dominated by noise | Noise dominated (total time) | Noise dominated (detector-on time) | Marked lightcurve |
|---|---|---|---|---|---|---|---|
| A | 7526 | 6683 | 50 | 50 | 0.66% | 0.75% | 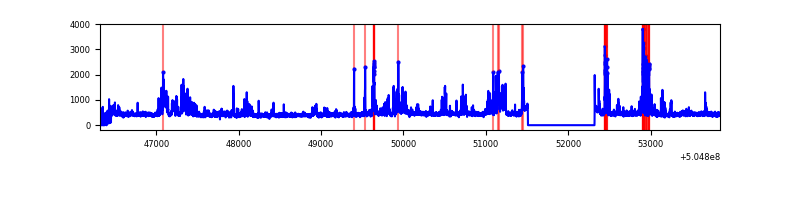 |
| B | 7515 | 6681 | 61 | 61 | 0.81% | 0.91% | 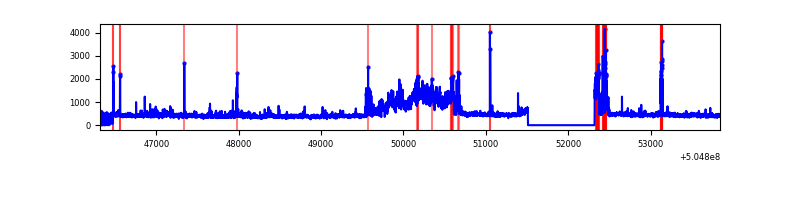 |
| C | 7503 | 6681 | 187 | 187 | 2.49% | 2.80% | 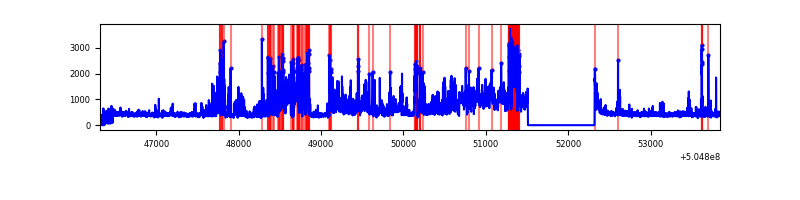 |
| D | 7493 | 6655 | 3160 | 3160 | 42.17% | 47.48% | 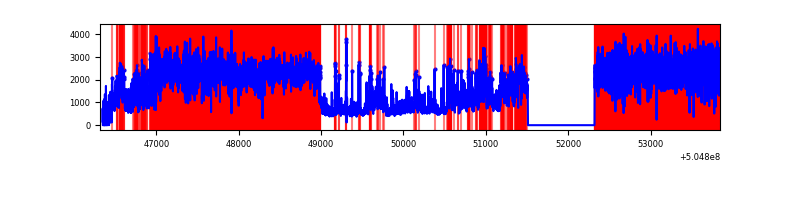 |
Top three noisy pixels from each quadrant. If the there are fewer than three noisy pixels in the level2.evt file, extra rows are filled as -1
| Pixel properties | Quadrant properties | ||||||
|---|---|---|---|---|---|---|---|
| Quadrant | DetID | PixID | Counts | Sigma | Mean | Median | Sigma |
| A | 4 | 159 | 427937 | 2501.69 | 688 | 672 | 170.8 |
| A | 0 | 8 | 175000 | 1020.71 | 688 | 672 | 170.8 |
| A | 3 | 78 | 80367 | 466.62 | 688 | 672 | 170.8 |
| B | 5 | 172 | 939804 | 6326.96 | 680 | 654 | 148.4 |
| B | 4 | 67 | 49323 | 327.88 | 680 | 654 | 148.4 |
| B | 7 | 252 | 26033 | 170.98 | 680 | 654 | 148.4 |
| C | 9 | 38 | 1539347 | 8519.18 | 659 | 652 | 180.6 |
| C | 15 | 147 | 244705 | 1351.23 | 659 | 652 | 180.6 |
| C | 13 | 3 | 53755 | 294.01 | 659 | 652 | 180.6 |
| D | 7 | 70 | 8665383 | 59845.53 | 502 | 480 | 144.8 |
| D | 11 | 129 | 640637 | 4421.35 | 502 | 480 | 144.8 |
| D | 6 | 239 | 176794 | 1217.74 | 502 | 480 | 144.8 |
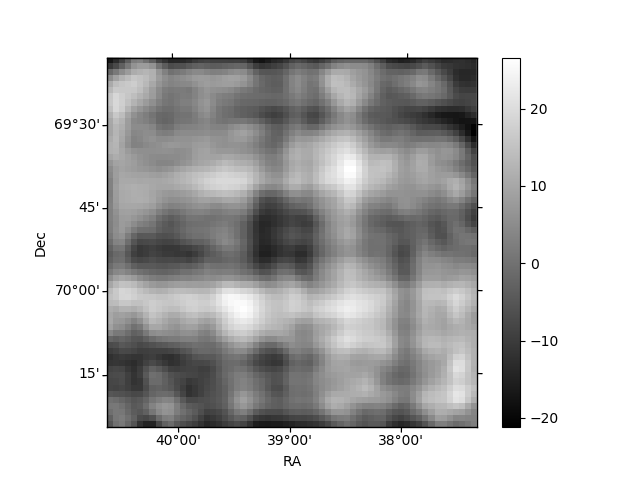
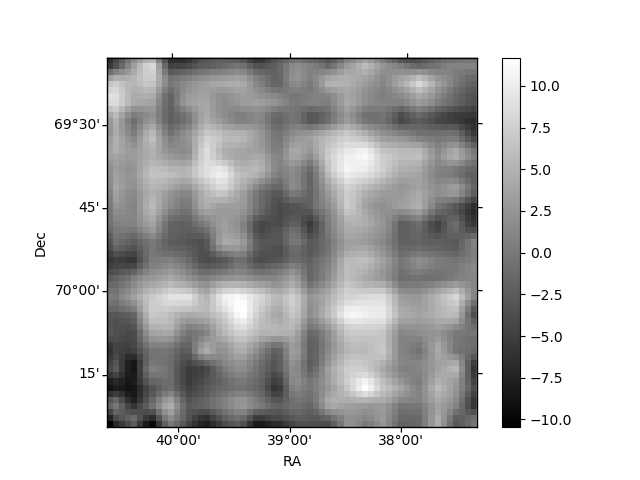
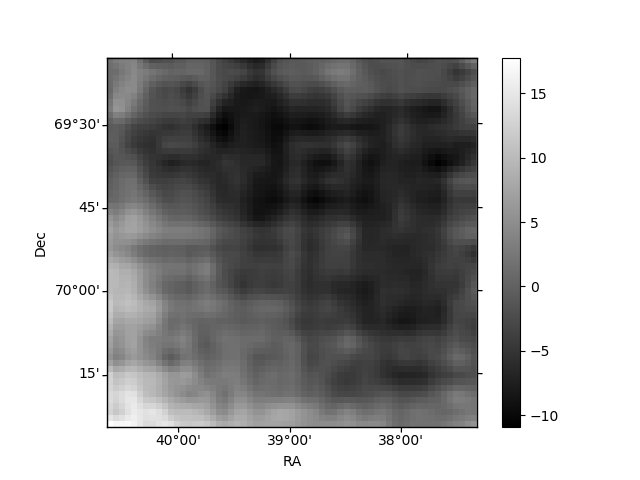
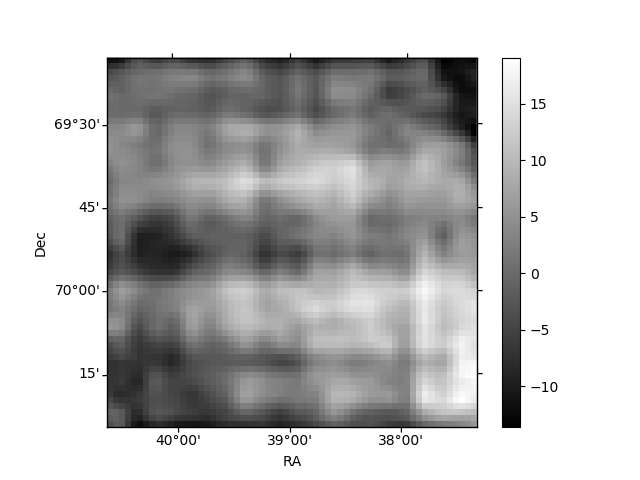
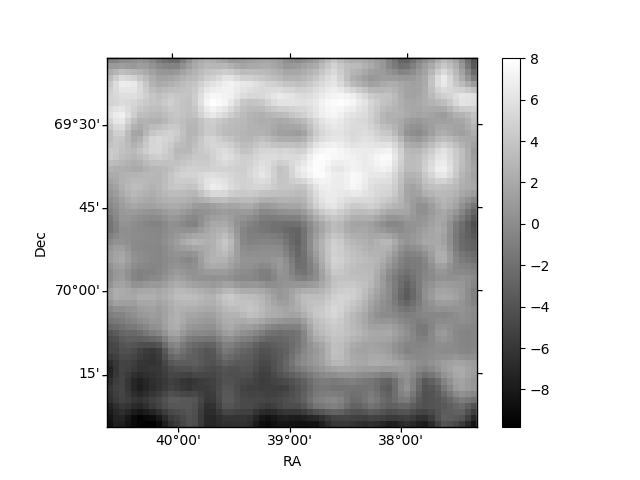
Histogram calculated using DETX and DETY for each event in the final _common_clean file
| Quadrant A | 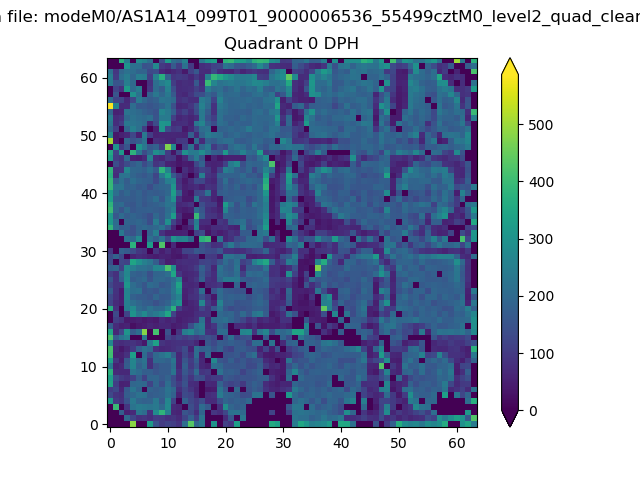 |
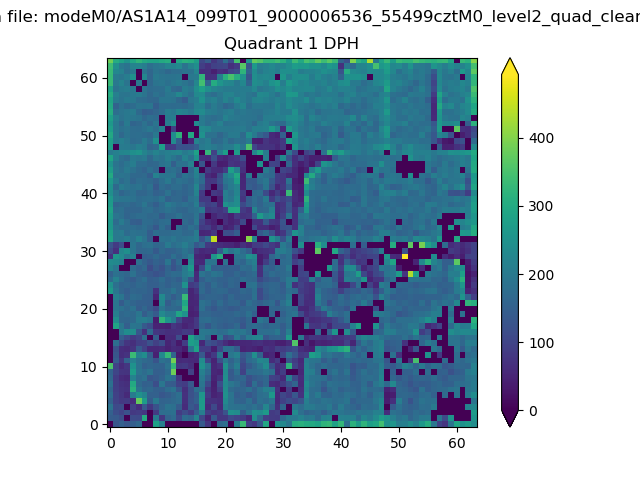 |
Quadrant B |
|---|---|---|---|
| Quadrant D | 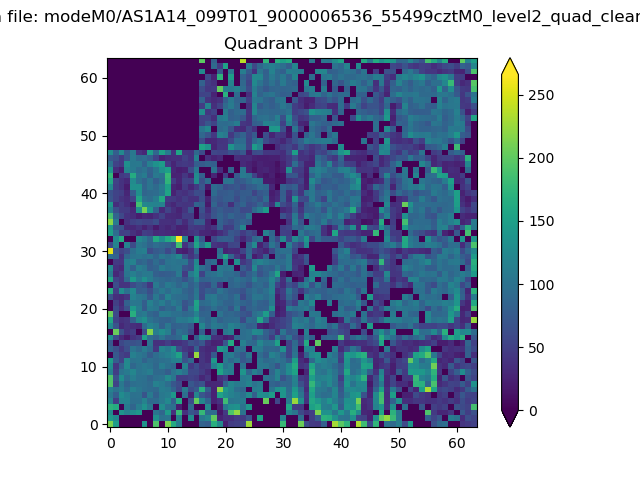 |
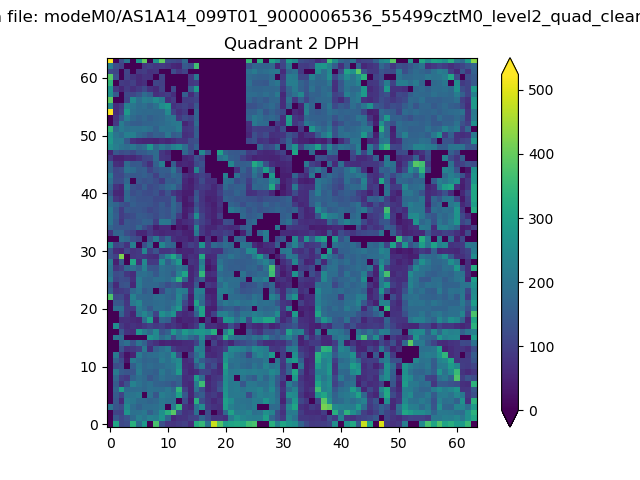 |
Quadrant C |
| Plot type | Count rate plots | Images |
|---|---|---|
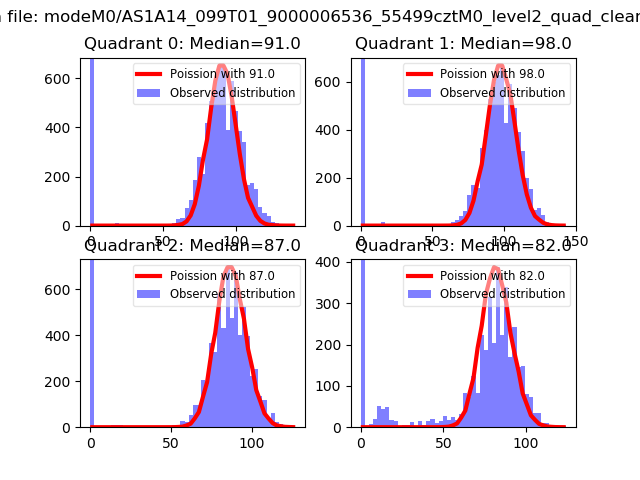
| Comparison with Poisson distribution Blue bars denote a histogram of data divided into 1 sec bins. Red curve is a Poisson curve with rate = median count rate of data. |
 |
 |
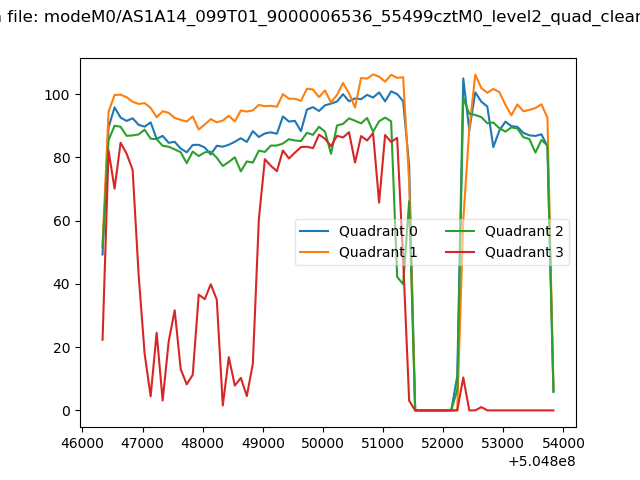
| Quadrant-wise count rates Data is divided into 100 sec bins |
 |
|
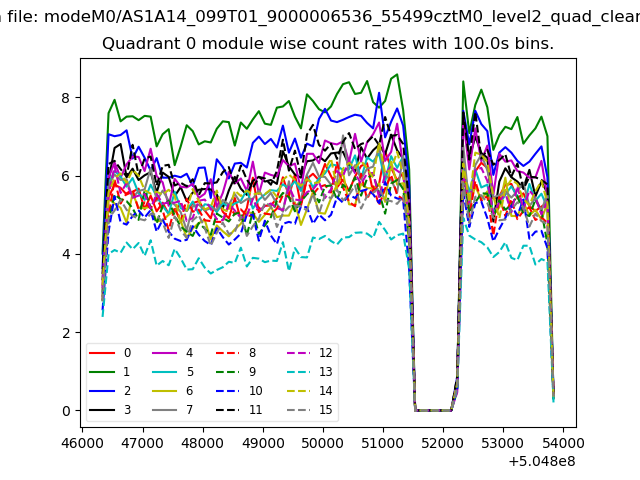
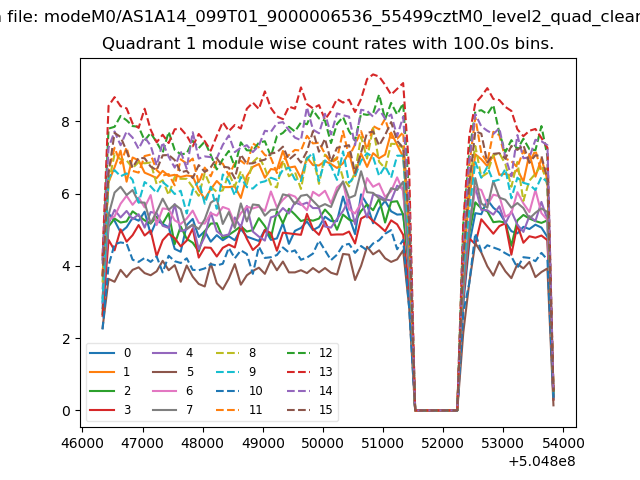
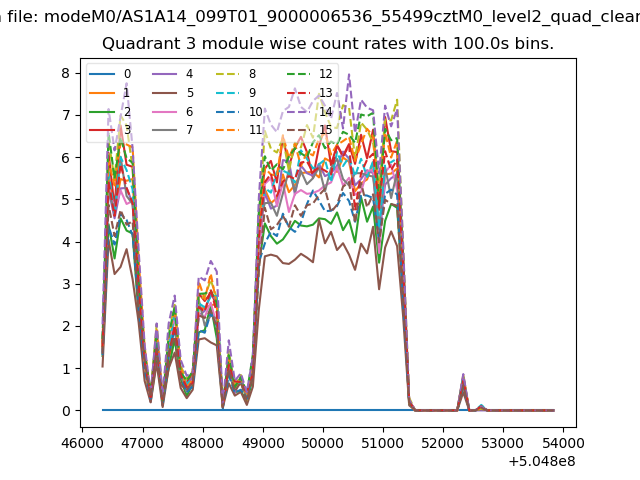
| Module-wise count rates for Quadrant A Data is divided into 100 sec bins |
 |
 |
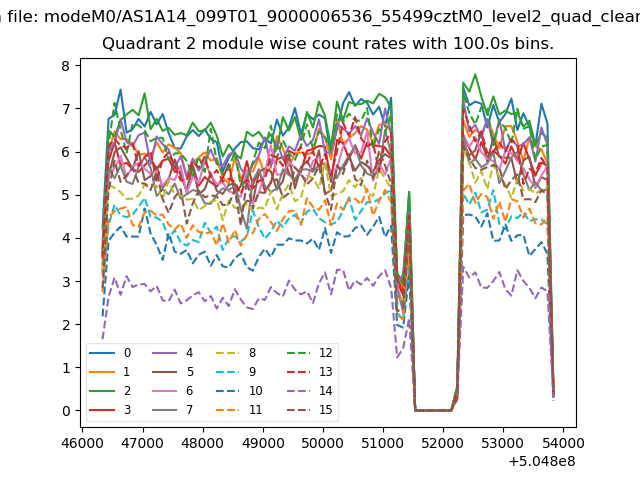
| Module-wise count rates for Quadrant B Data is divided into 100 sec bins |
 |
 |
| Module-wise count rates for Quadrant C Data is divided into 100 sec bins |
 |
 |
| Module-wise count rates for Quadrant D Data is divided into 100 sec bins |
 |
 |
| Parameter | Plot |
|---|---|
| CZT HV Monitor | 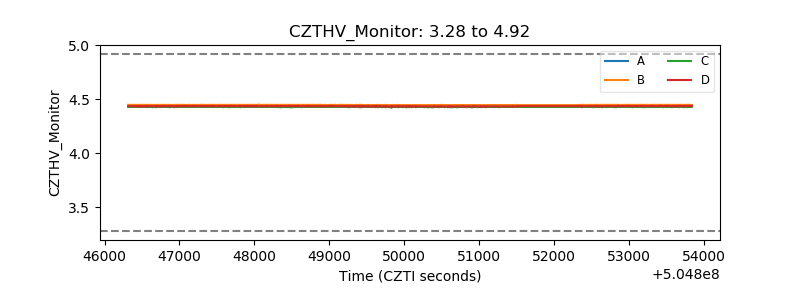 |
| D_VDD | 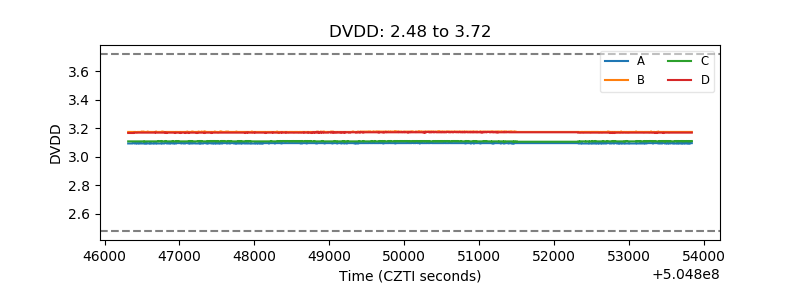 |
| Temperature 1 | 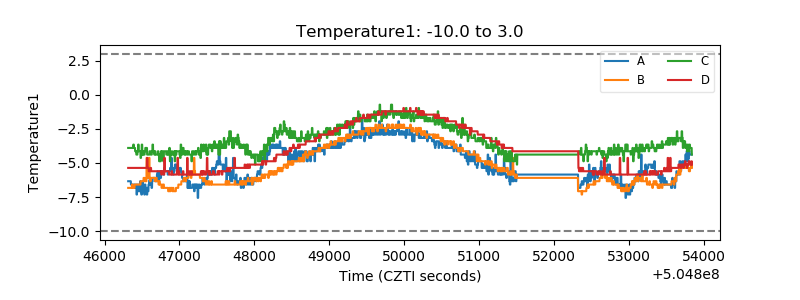 |
| Veto HV Monitor | 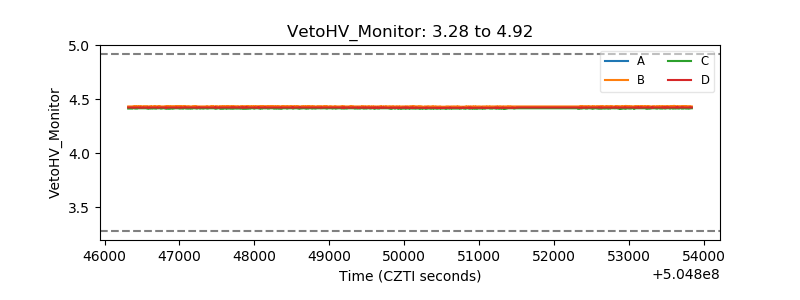 |
| Veto LLD | 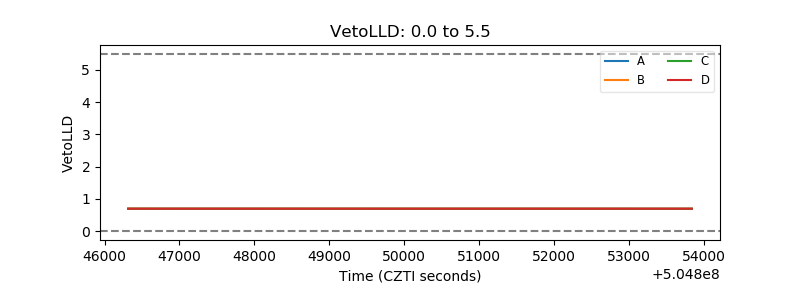 |
| Alpha Counter | 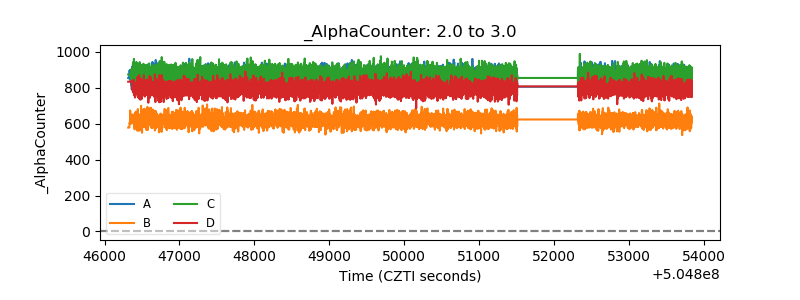 |
| _CPM_Rate | 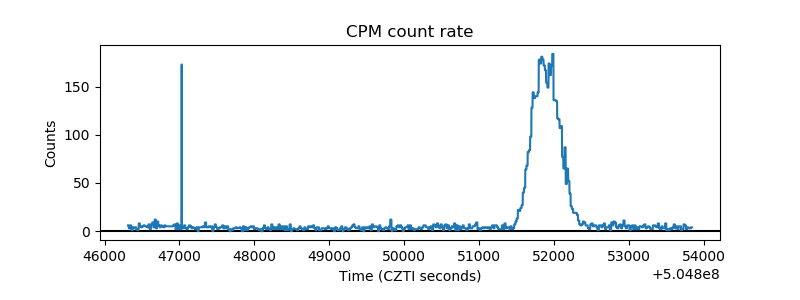 |
| CZT Counter | 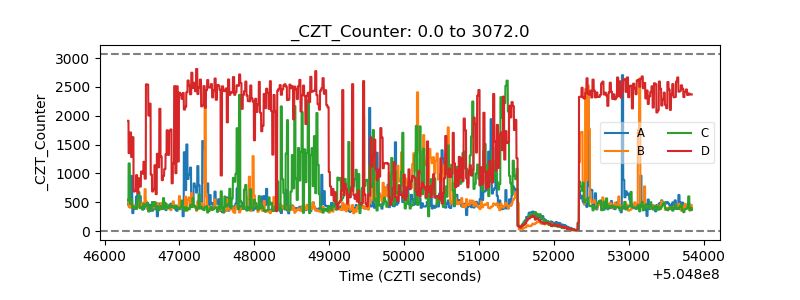 |
| +2.5 Volts monitor | 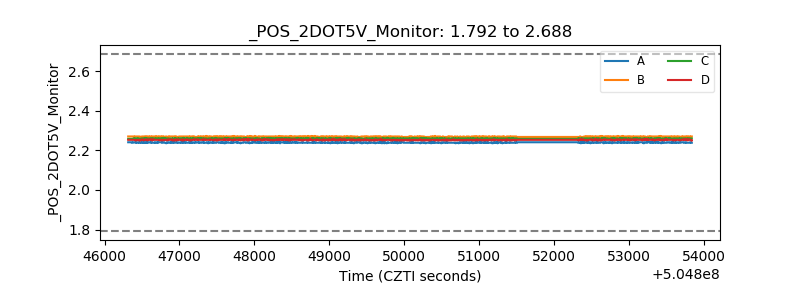 |
| +5 Volts monitor | 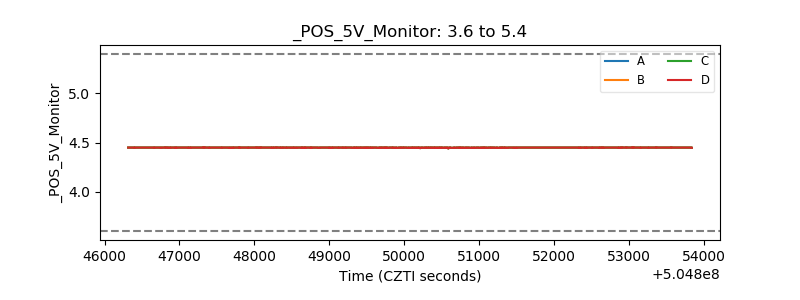 |
| _ROLL_ROT | 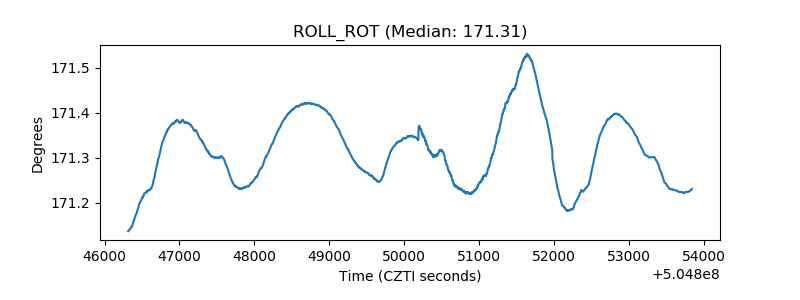 |
| _Roll_DEC | 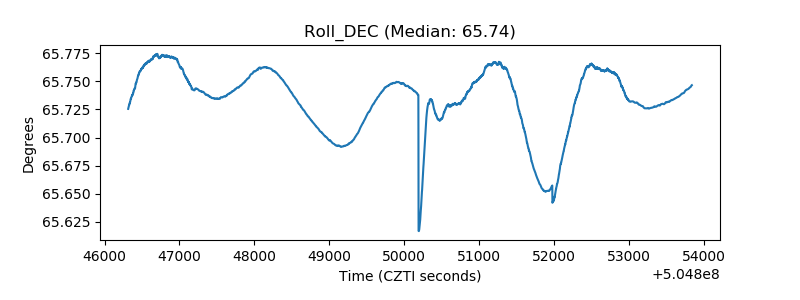 |
| _Roll_RA | 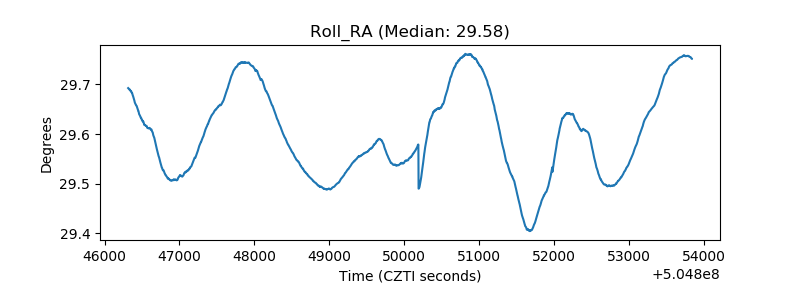 |
| Veto Counter | 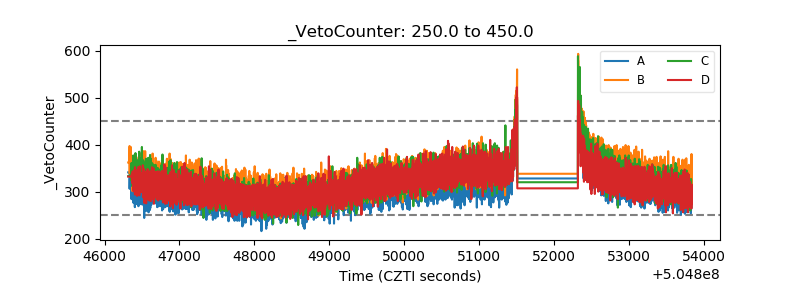 |