| Param | Original file | Final file |
|---|---|---|
| Filename | modeM0/AS1A14_099T01_9000006536_55500cztM0_level2.fits | modeM0/AS1A14_099T01_9000006536_55500cztM0_level2_quad_clean.evt |
| Size (bytes) | 683,513,280 | 84,404,160 |
| Size | 651.8 MB | 80.5 MB |
| Events in quadrant A | 3,614,053 | 629,951 |
| Events in quadrant B | 5,420,746 | 557,400 |
| Events in quadrant C | 3,792,359 | 602,079 |
| Events in quadrant D | 11,944,358 | 290,713 |
| Mode M9 | |||
|---|---|---|---|
| Quadrant | BADHDUFLAG | Total packets | Discarded packets |
| A | 0 | 17 | 0 |
| B | 0 | 17 | 0 |
| C | 0 | 17 | 0 |
| D | 0 | 17 | 0 |
| Mode SS | |||
|---|---|---|---|
| Quadrant | BADHDUFLAG | Total packets | Discarded packets |
| A | 0 | 142 | 0 |
| B | 0 | 142 | 0 |
| C | 0 | 142 | 0 |
| D | 0 | 142 | 0 |
| Mode M0 | |||
|---|---|---|---|
| Quadrant | BADHDUFLAG | Total packets | Discarded packets |
| A | 0 | 15526 | 48 |
| B | 0 | 21270 | 49 |
| C | 0 | 16362 | 186 |
| D | 0 | 40402 | 270 |
| Quadrant | Total seconds | Saturated seconds | Saturation percentage |
|---|---|---|---|
| A | 6822 | 132 | 1.934916% |
| B | 6821 | 1280 | 18.765577% |
| C | 6814 | 139 | 2.039918% |
| D | 6804 | 3647 | 53.600823% |
Noise dominated data is calculated using 1-second bins in cleaned event files. If a bin has >2000 counts, and if more than 50% of those come from <1% of pixels, then it is considered to be noise-dominated and hence unusable.
| Quadrant | # 1 sec bins | Bins with >0 counts | Bins with >2000 counts | High rate bins dominated by noise | Noise dominated (total time) | Noise dominated (detector-on time) | Marked lightcurve |
|---|---|---|---|---|---|---|---|
| A | 8603 | 6835 | 72 | 72 | 0.84% | 1.05% | 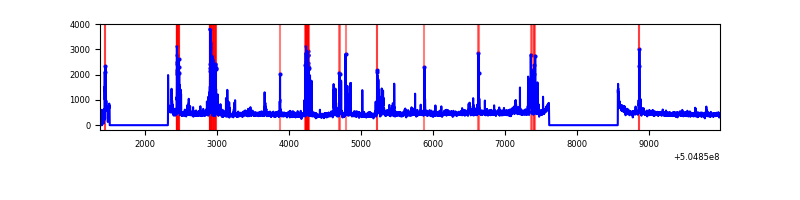 |
| B | 8607 | 6838 | 900 | 900 | 10.46% | 13.16% | 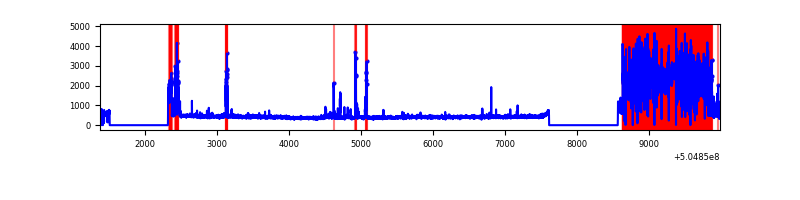 |
| C | 8604 | 6825 | 107 | 107 | 1.24% | 1.57% | 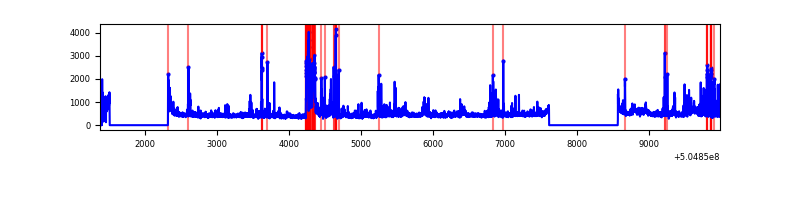 |
| D | 8602 | 6828 | 3016 | 3016 | 35.06% | 44.17% | 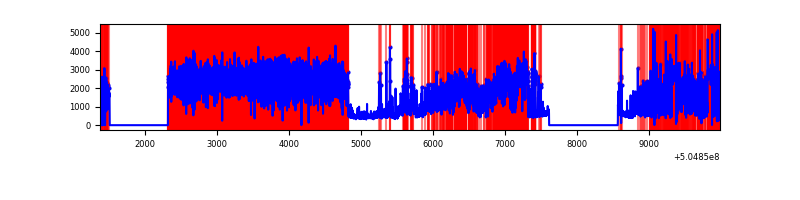 |
Top three noisy pixels from each quadrant. If the there are fewer than three noisy pixels in the level2.evt file, extra rows are filled as -1
| Pixel properties | Quadrant properties | ||||||
|---|---|---|---|---|---|---|---|
| Quadrant | DetID | PixID | Counts | Sigma | Mean | Median | Sigma |
| A | 0 | 8 | 413125 | 2319.25 | 723 | 704 | 177.8 |
| A | 3 | 14 | 174074 | 974.95 | 723 | 704 | 177.8 |
| A | 7 | 14 | 66436 | 369.64 | 723 | 704 | 177.8 |
| B | 5 | 172 | 2884395 | 21698.38 | 622 | 598 | 132.9 |
| B | 4 | 67 | 47194 | 350.6 | 622 | 598 | 132.9 |
| B | 12 | 111 | 16321 | 118.3 | 622 | 598 | 132.9 |
| C | 9 | 38 | 522040 | 2725.45 | 697 | 688 | 191.3 |
| C | 13 | 3 | 259798 | 1354.54 | 697 | 688 | 191.3 |
| C | 15 | 147 | 69378 | 359.09 | 697 | 688 | 191.3 |
| D | 7 | 70 | 9447173 | 68270.59 | 482 | 459 | 138.4 |
| D | 11 | 129 | 415726 | 3001.1 | 482 | 459 | 138.4 |
| D | 6 | 239 | 68901 | 494.62 | 482 | 459 | 138.4 |
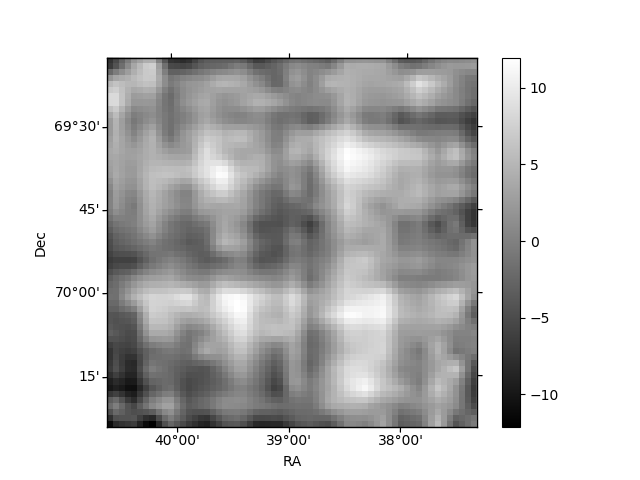
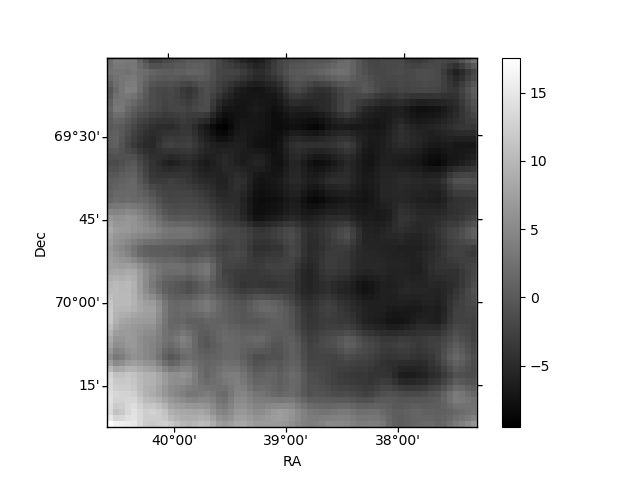
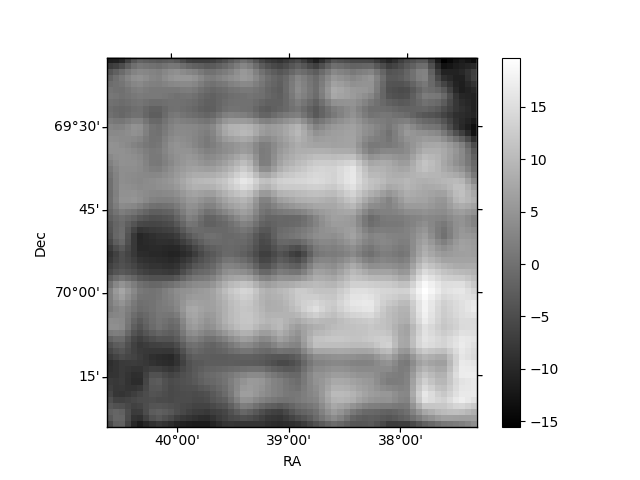
Histogram calculated using DETX and DETY for each event in the final _common_clean file
| Quadrant A | 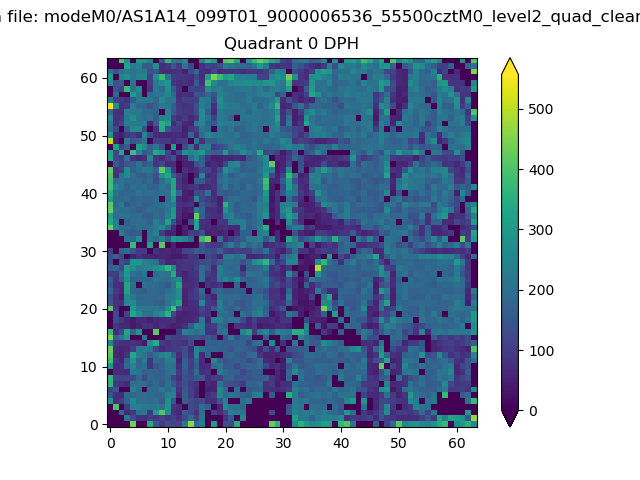 |
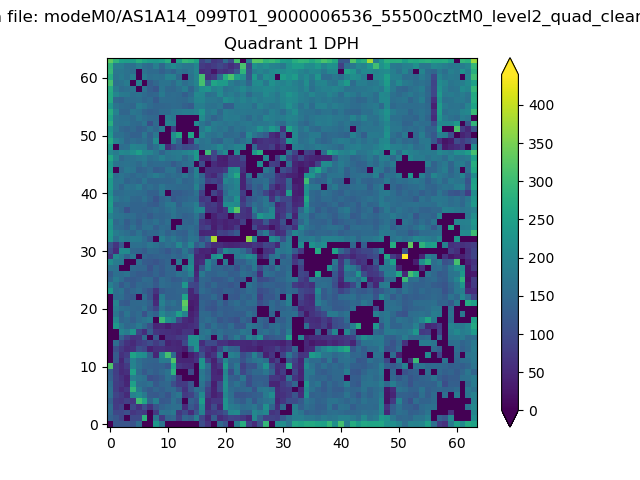 |
Quadrant B |
|---|---|---|---|
| Quadrant D | 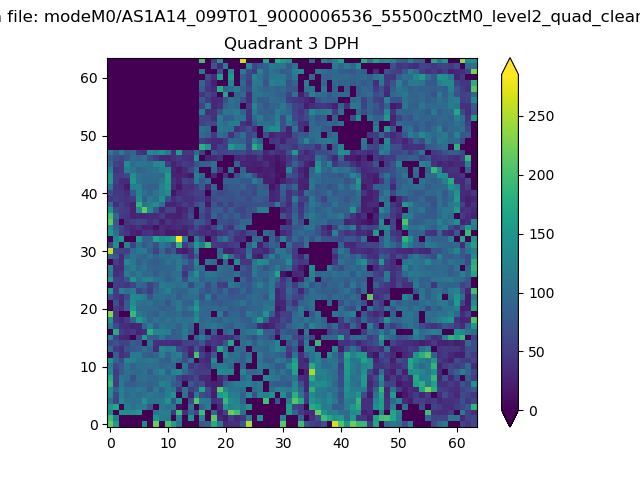 |
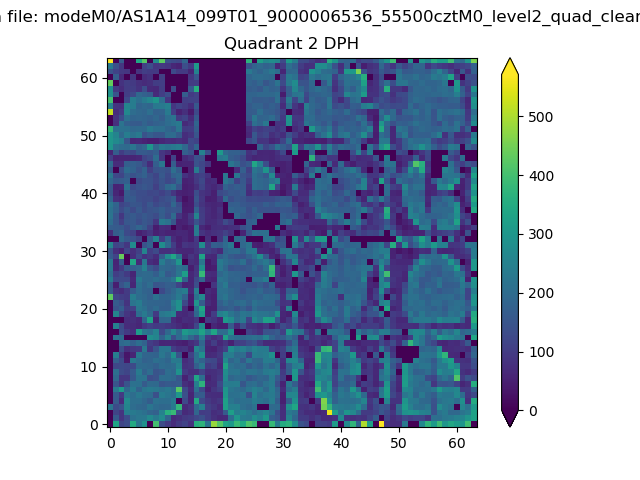 |
Quadrant C |
| Plot type | Count rate plots | Images |
|---|---|---|
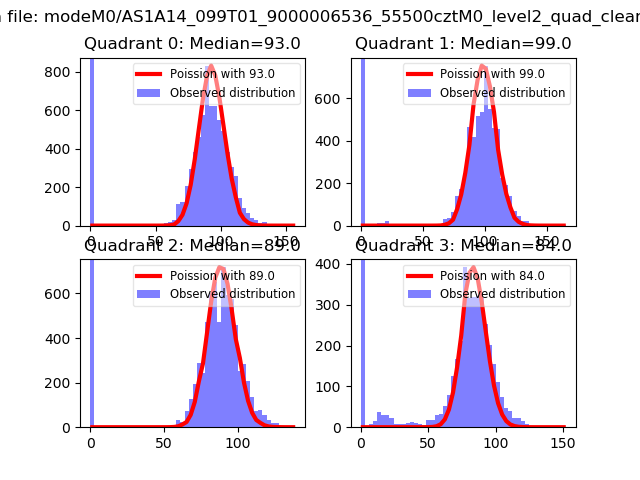
| Comparison with Poisson distribution Blue bars denote a histogram of data divided into 1 sec bins. Red curve is a Poisson curve with rate = median count rate of data. |
 |
 |
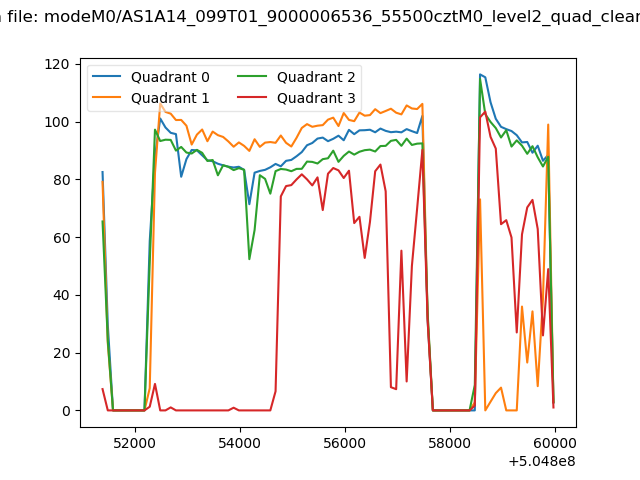
| Quadrant-wise count rates Data is divided into 100 sec bins |
 |
|
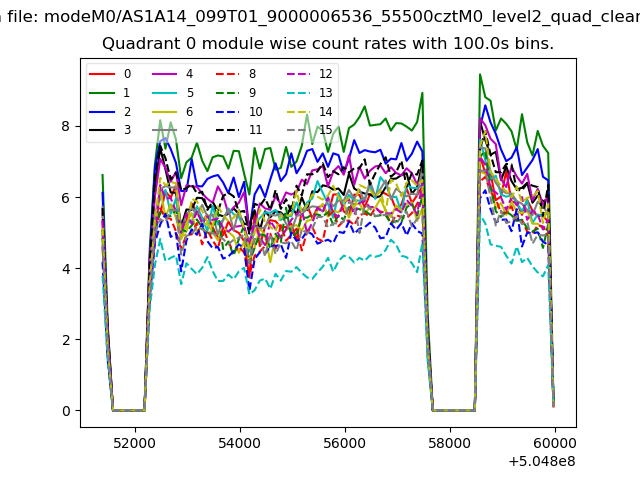
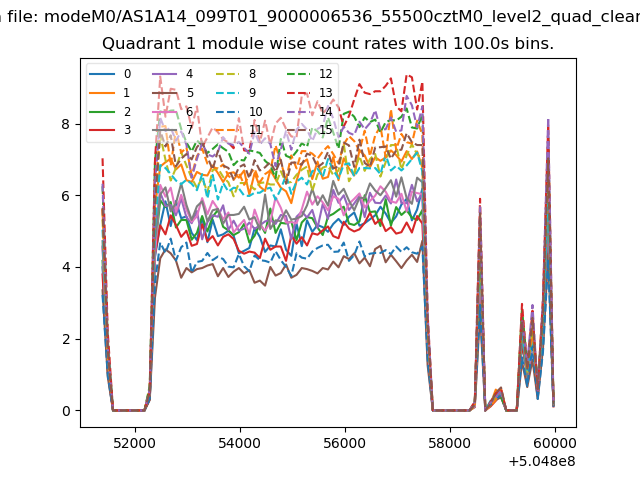
| Module-wise count rates for Quadrant A Data is divided into 100 sec bins |
 |
 |
| Module-wise count rates for Quadrant B Data is divided into 100 sec bins |
 |
 |
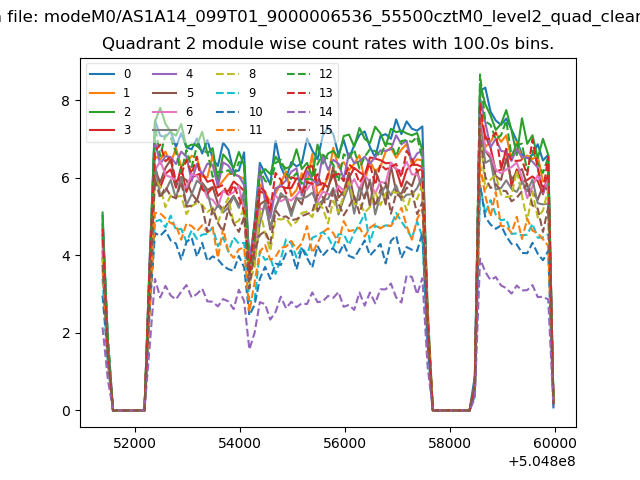
| Module-wise count rates for Quadrant C Data is divided into 100 sec bins |
 |
 |
| Module-wise count rates for Quadrant D Data is divided into 100 sec bins |
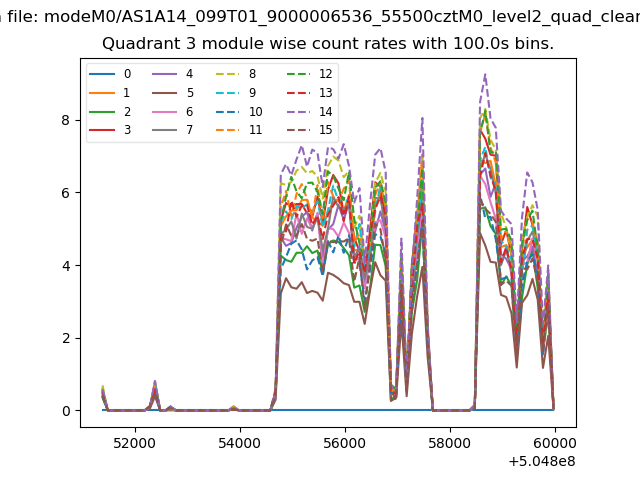 |
 |
| Parameter | Plot |
|---|---|
| CZT HV Monitor | 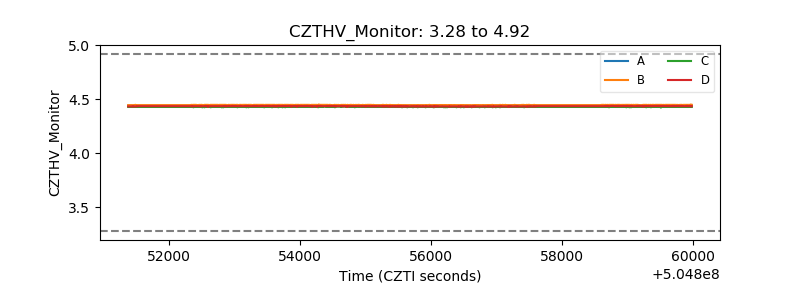 |
| D_VDD |  |
| Temperature 1 | 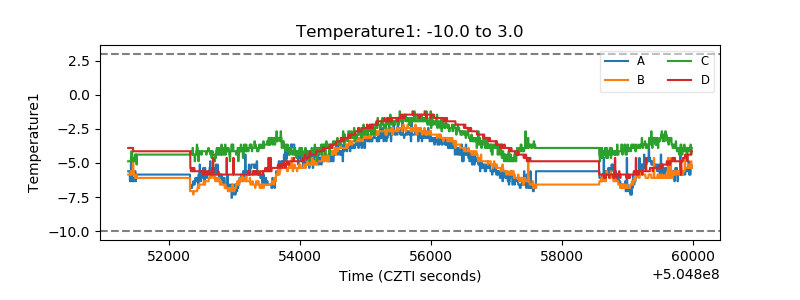 |
| Veto HV Monitor | 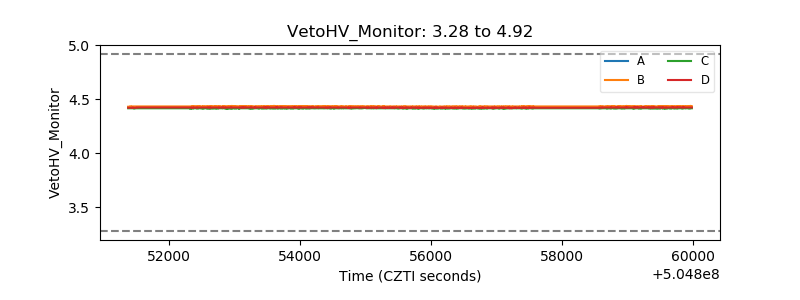 |
| Veto LLD | 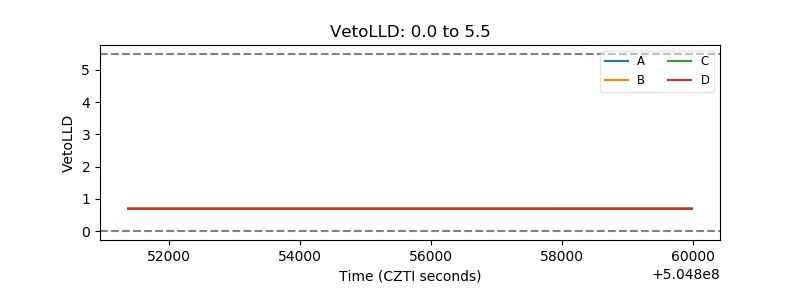 |
| Alpha Counter | 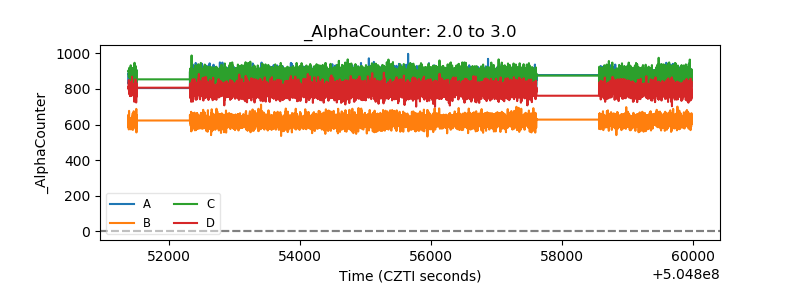 |
| _CPM_Rate | 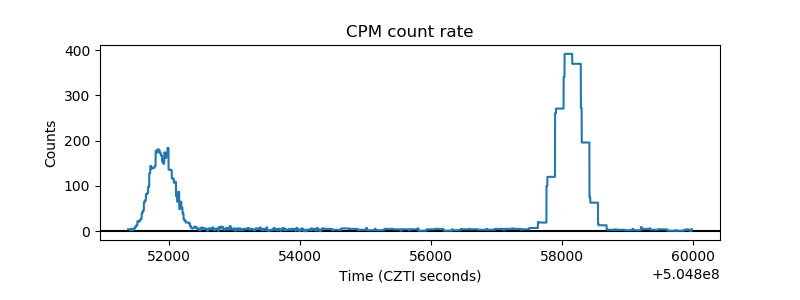 |
| CZT Counter | 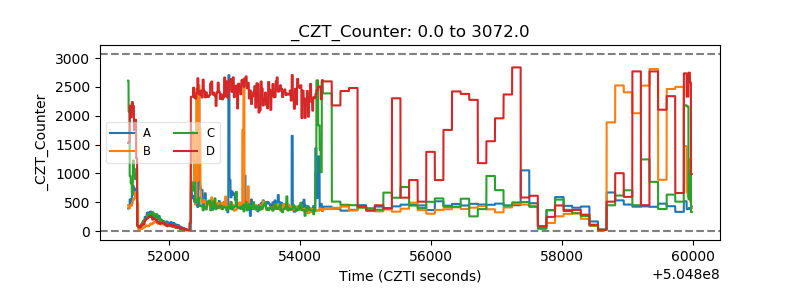 |
| +2.5 Volts monitor | 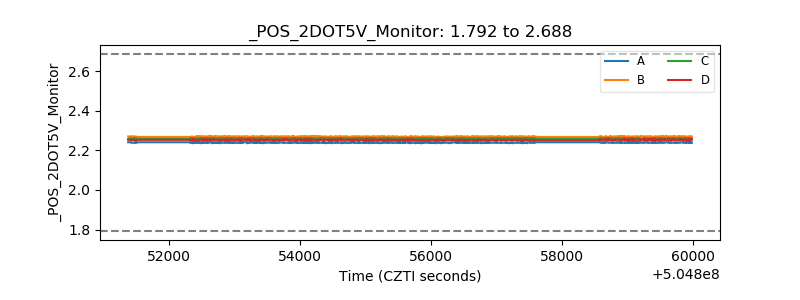 |
| +5 Volts monitor | 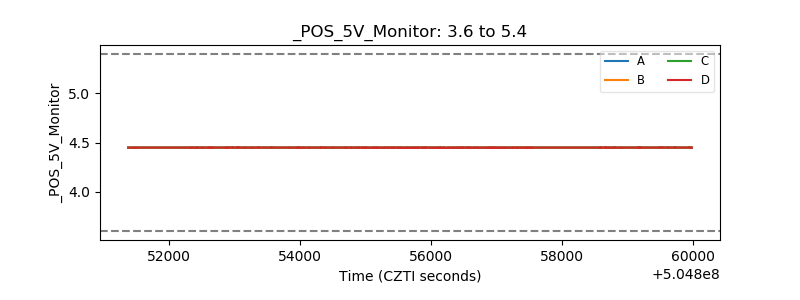 |
| _ROLL_ROT | 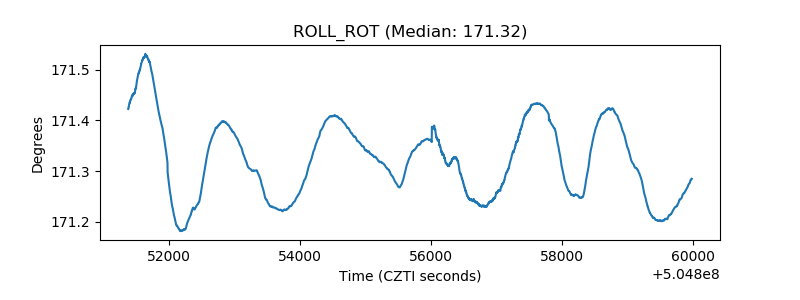 |
| _Roll_DEC | 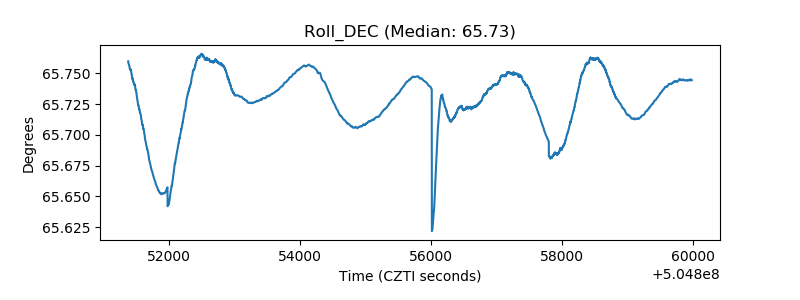 |
| _Roll_RA | 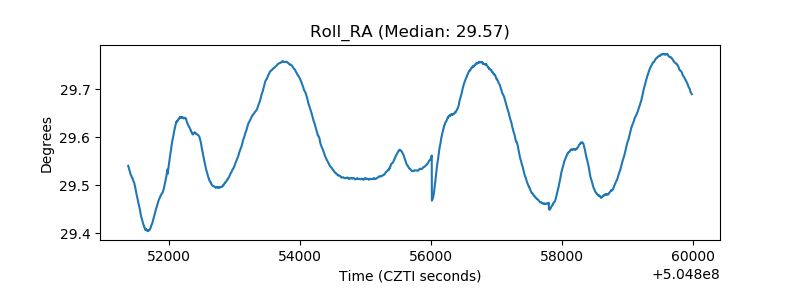 |
| Veto Counter | 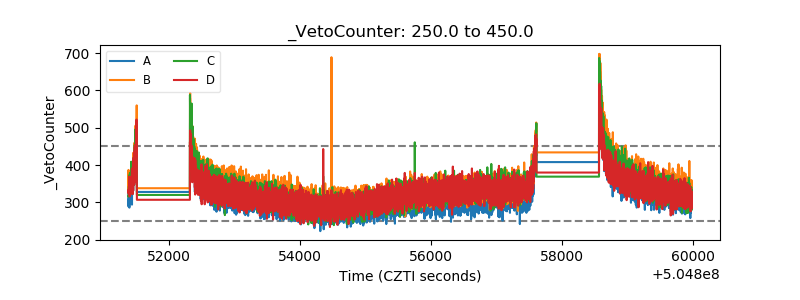 |