| Param | Original file | Final file |
|---|---|---|
| Filename | modeM0/AS1A14_099T01_9000006536_55502cztM0_level2.fits | modeM0/AS1A14_099T01_9000006536_55502cztM0_level2_quad_clean.evt |
| Size (bytes) | 631,820,160 | 81,552,960 |
| Size | 602.6 MB | 77.8 MB |
| Events in quadrant A | 3,416,707 | 599,289 |
| Events in quadrant B | 7,995,213 | 432,822 |
| Events in quadrant C | 4,246,233 | 561,126 |
| Events in quadrant D | 7,237,789 | 434,105 |
| Mode M9 | |||
|---|---|---|---|
| Quadrant | BADHDUFLAG | Total packets | Discarded packets |
| A | 0 | 11 | 0 |
| B | 0 | 11 | 0 |
| C | 0 | 11 | 0 |
| D | 0 | 11 | 0 |
| Mode SS | |||
|---|---|---|---|
| Quadrant | BADHDUFLAG | Total packets | Discarded packets |
| A | 0 | 129 | 1 |
| B | 0 | 130 | 2 |
| C | 0 | 130 | 0 |
| D | 0 | 130 | 2 |
| Mode M0 | |||
|---|---|---|---|
| Quadrant | BADHDUFLAG | Total packets | Discarded packets |
| A | 0 | 14606 | 53 |
| B | 0 | 28376 | 281 |
| C | 0 | 17186 | 83 |
| D | 0 | 26004 | 79 |
| Quadrant | Total seconds | Saturated seconds | Saturation percentage |
|---|---|---|---|
| A | 6336 | 156 | 2.462121% |
| B | 6325 | 2348 | 37.122530% |
| C | 6334 | 251 | 3.962741% |
| D | 6336 | 1435 | 22.648359% |
Noise dominated data is calculated using 1-second bins in cleaned event files. If a bin has >2000 counts, and if more than 50% of those come from <1% of pixels, then it is considered to be noise-dominated and hence unusable.
| Quadrant | # 1 sec bins | Bins with >0 counts | Bins with >2000 counts | High rate bins dominated by noise | Noise dominated (total time) | Noise dominated (detector-on time) | Marked lightcurve |
|---|---|---|---|---|---|---|---|
| A | 7425 | 6345 | 79 | 79 | 1.06% | 1.25% | 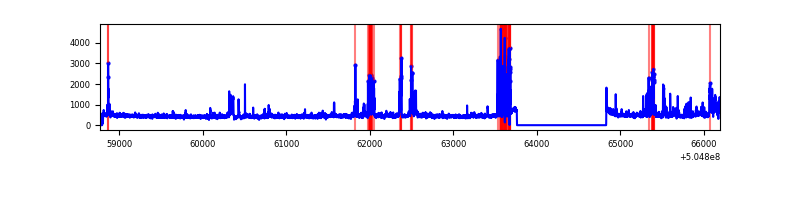 |
| B | 7410 | 6326 | 1693 | 1693 | 22.85% | 26.76% | 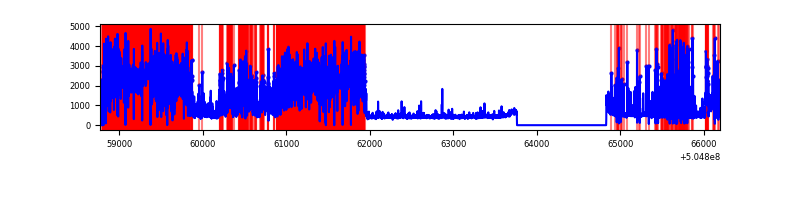 |
| C | 7421 | 6343 | 182 | 182 | 2.45% | 2.87% | 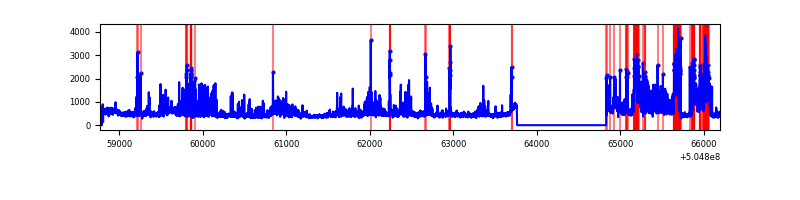 |
| D | 7421 | 6346 | 1375 | 1375 | 18.53% | 21.67% | 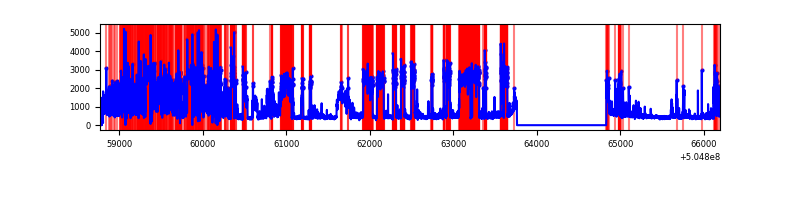 |
Top three noisy pixels from each quadrant. If the there are fewer than three noisy pixels in the level2.evt file, extra rows are filled as -1
| Pixel properties | Quadrant properties | ||||||
|---|---|---|---|---|---|---|---|
| Quadrant | DetID | PixID | Counts | Sigma | Mean | Median | Sigma |
| A | 0 | 8 | 334755 | 2004.28 | 673 | 656 | 166.7 |
| A | 3 | 78 | 127618 | 761.65 | 673 | 656 | 166.7 |
| A | 3 | 14 | 114968 | 685.77 | 673 | 656 | 166.7 |
| B | 5 | 172 | 5826732 | 52422.18 | 517 | 498 | 111.1 |
| B | 4 | 67 | 99422 | 890.08 | 517 | 498 | 111.1 |
| B | 12 | 111 | 13430 | 116.36 | 517 | 498 | 111.1 |
| C | 9 | 38 | 1475761 | 8388.96 | 643 | 639 | 175.8 |
| C | 15 | 147 | 111943 | 632.98 | 643 | 639 | 175.8 |
| C | 12 | 252 | 32251 | 179.78 | 643 | 639 | 175.8 |
| D | 7 | 70 | 4339463 | 26122.26 | 582 | 555 | 166.1 |
| D | 11 | 129 | 196877 | 1181.95 | 582 | 555 | 166.1 |
| D | 2 | 153 | 110292 | 660.67 | 582 | 555 | 166.1 |
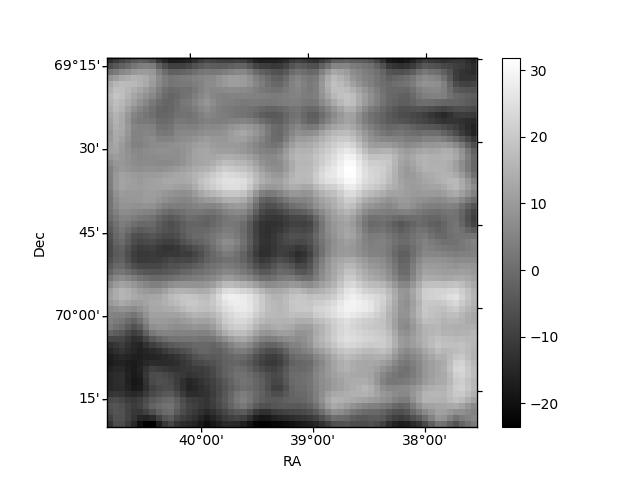
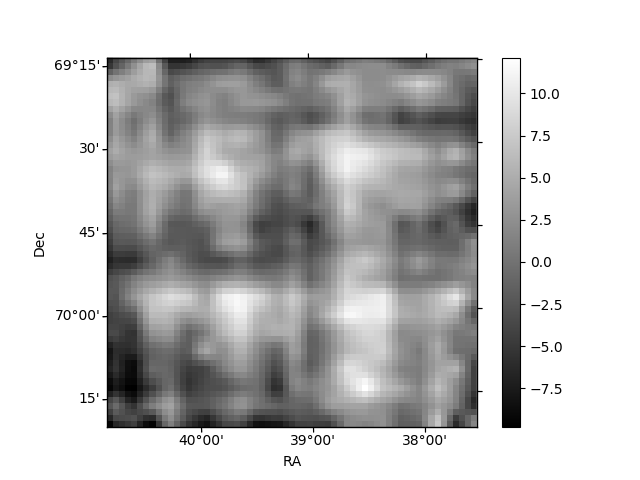
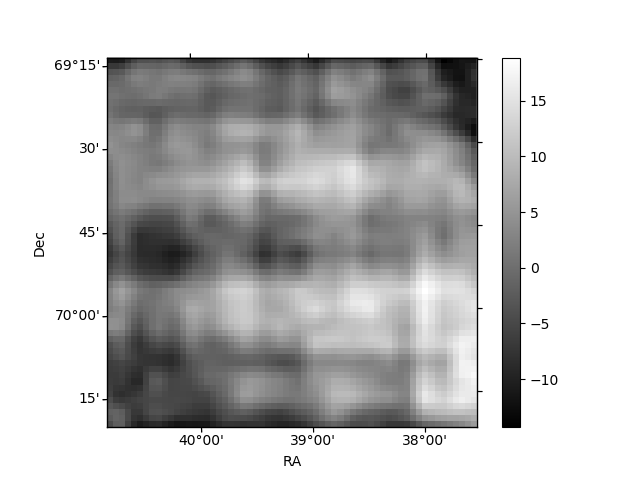
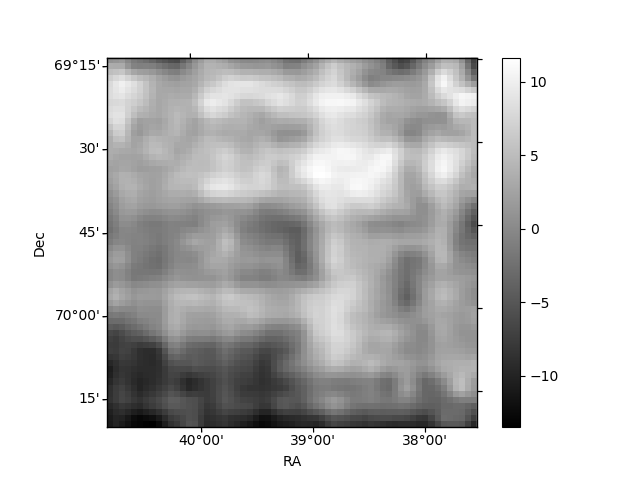
Histogram calculated using DETX and DETY for each event in the final _common_clean file
| Quadrant A | 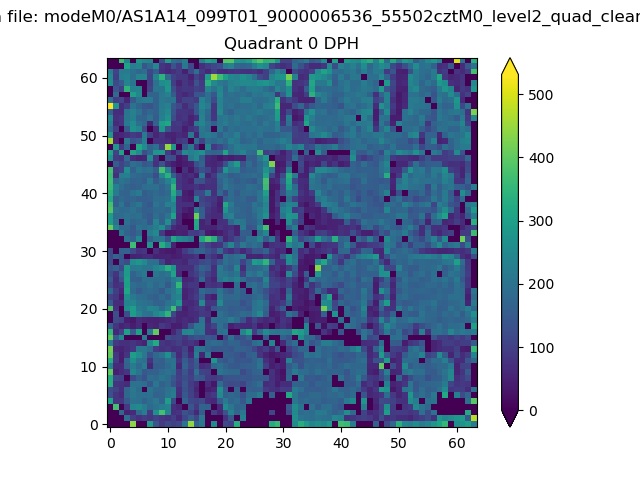 |
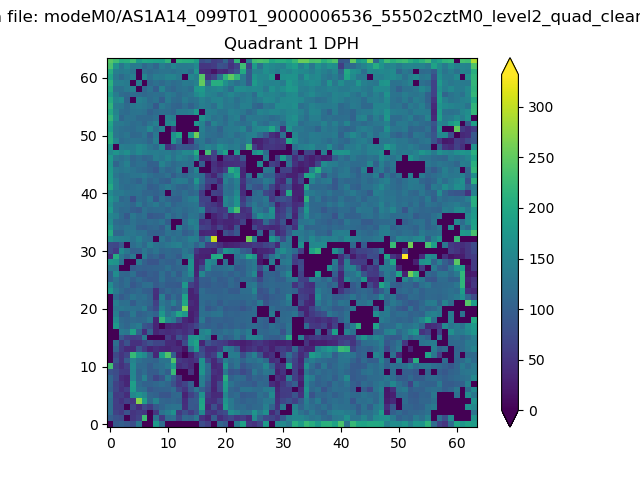 |
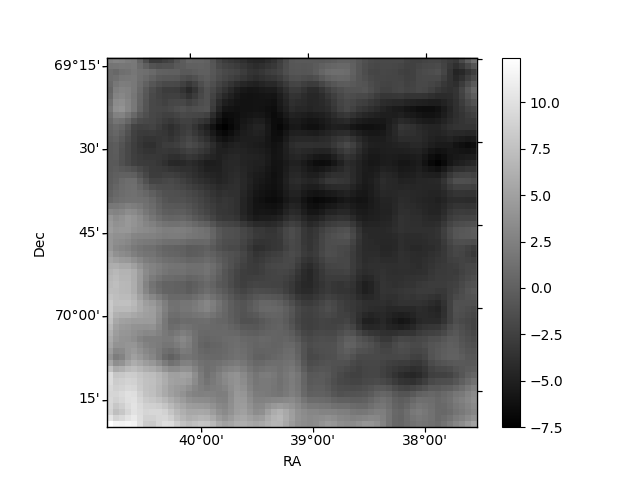
Quadrant B |
|---|---|---|---|
| Quadrant D | 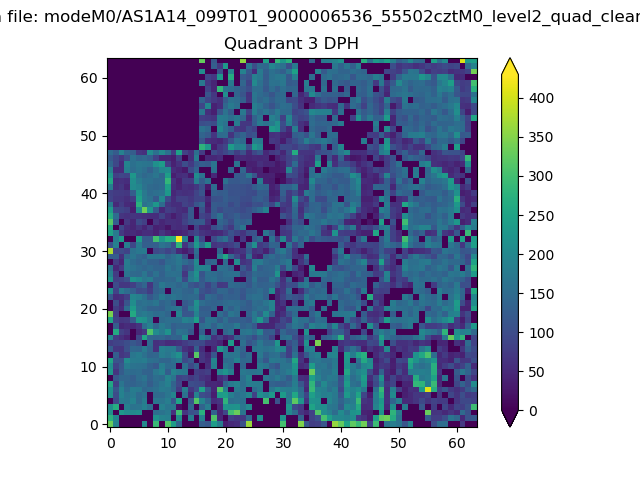 |
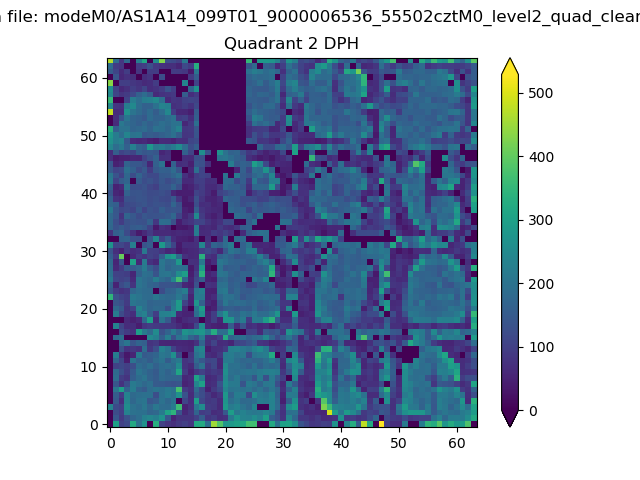 |
Quadrant C |
| Plot type | Count rate plots | Images |
|---|---|---|
| Comparison with Poisson distribution Blue bars denote a histogram of data divided into 1 sec bins. Red curve is a Poisson curve with rate = median count rate of data. |
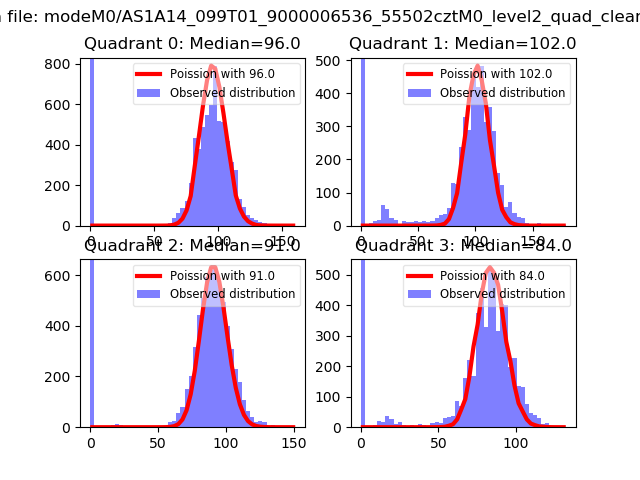 |
 |
| Quadrant-wise count rates Data is divided into 100 sec bins |
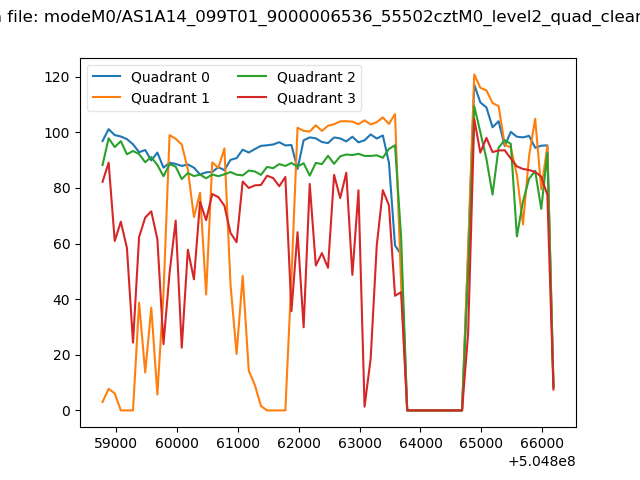 |
|
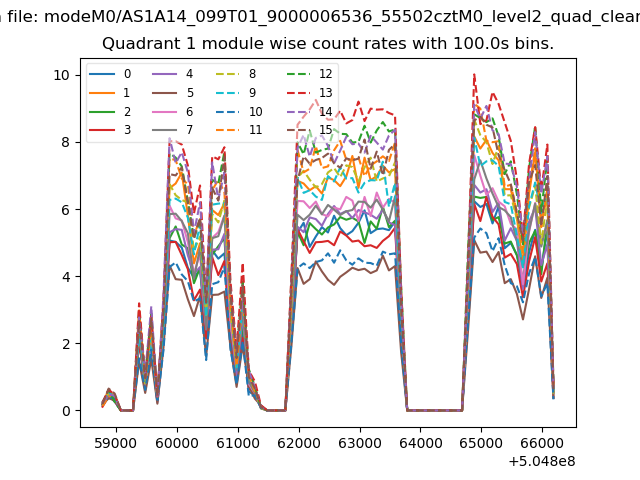
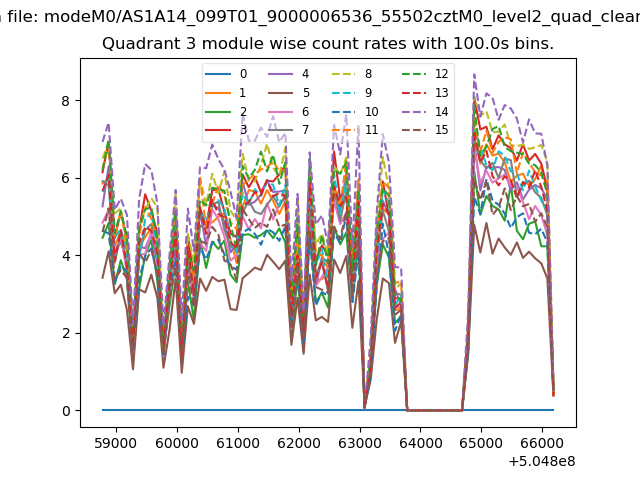
| Module-wise count rates for Quadrant A Data is divided into 100 sec bins |
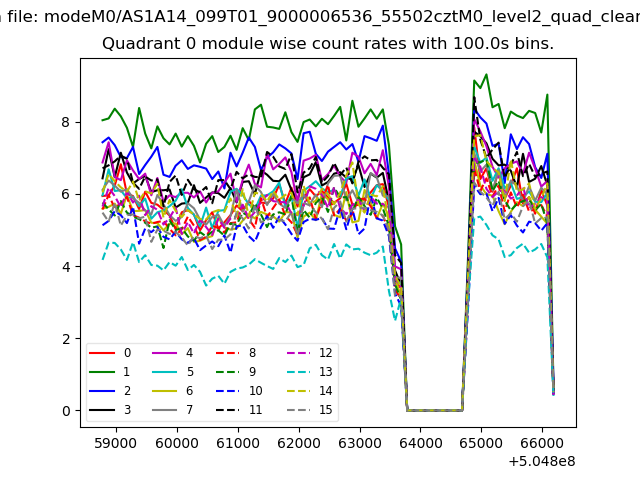 |
 |
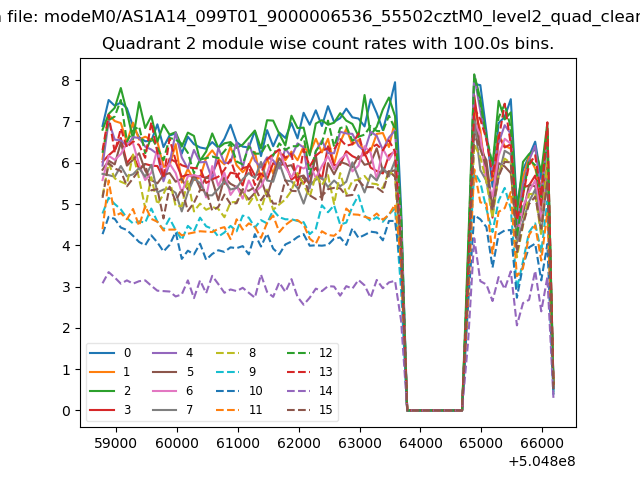
| Module-wise count rates for Quadrant B Data is divided into 100 sec bins |
 |
 |
| Module-wise count rates for Quadrant C Data is divided into 100 sec bins |
 |
 |
| Module-wise count rates for Quadrant D Data is divided into 100 sec bins |
 |
 |
| Parameter | Plot |
|---|---|
| CZT HV Monitor | 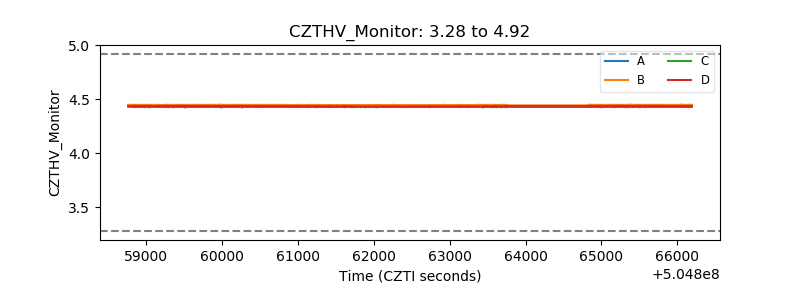 |
| D_VDD | 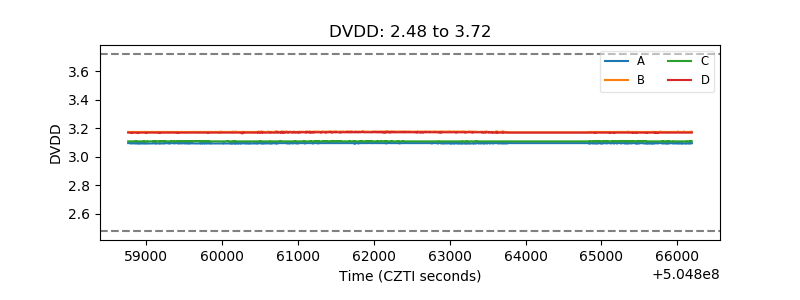 |
| Temperature 1 | 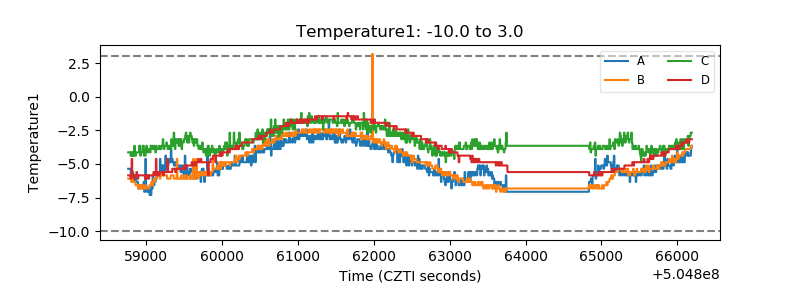 |
| Veto HV Monitor | 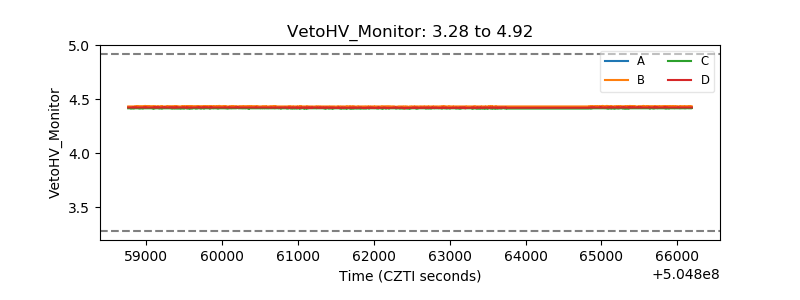 |
| Veto LLD | 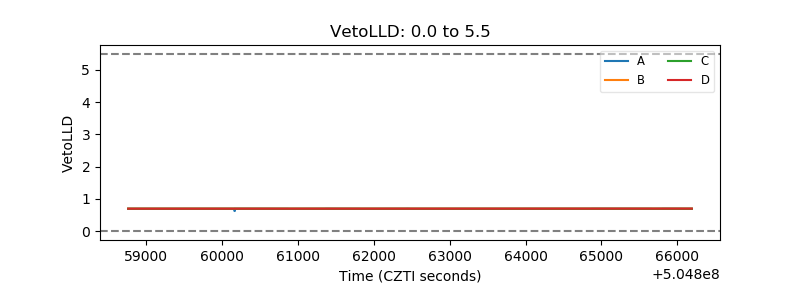 |
| Alpha Counter | 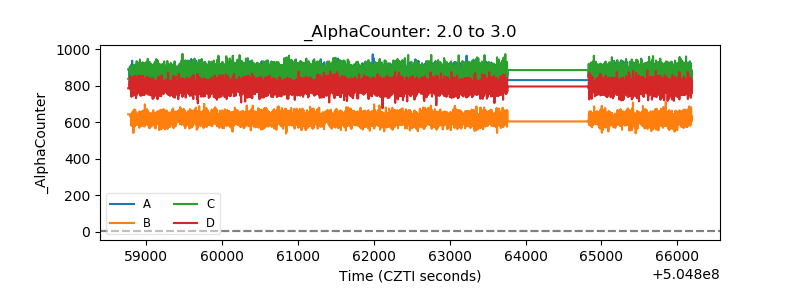 |
| _CPM_Rate | 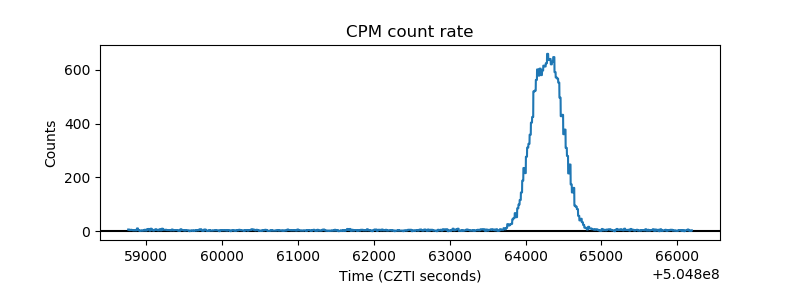 |
| CZT Counter | 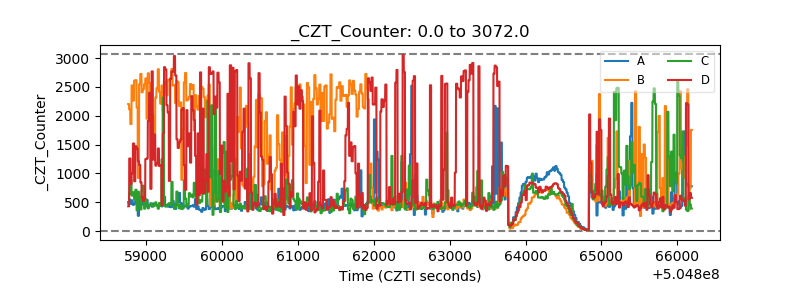 |
| +2.5 Volts monitor | 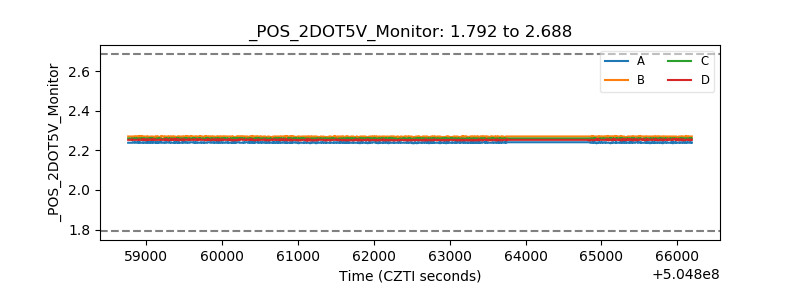 |
| +5 Volts monitor | 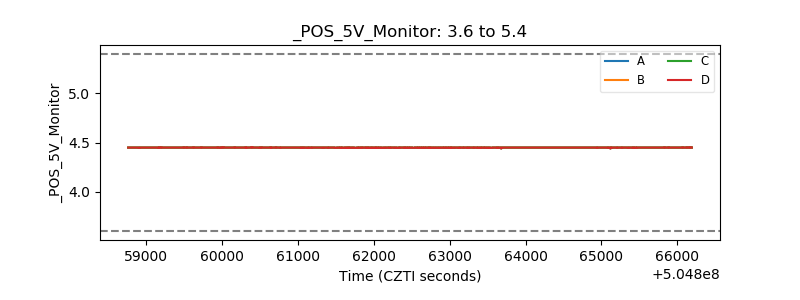 |
| _ROLL_ROT | 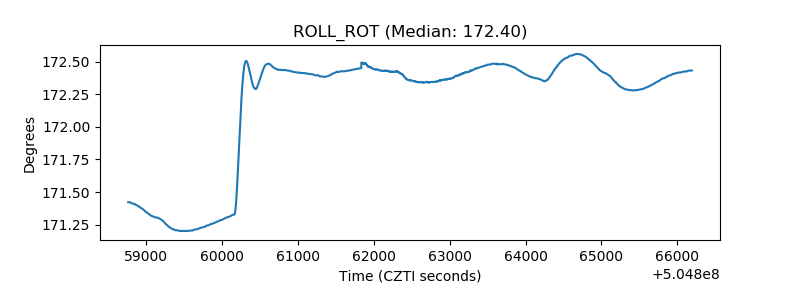 |
| _Roll_DEC | 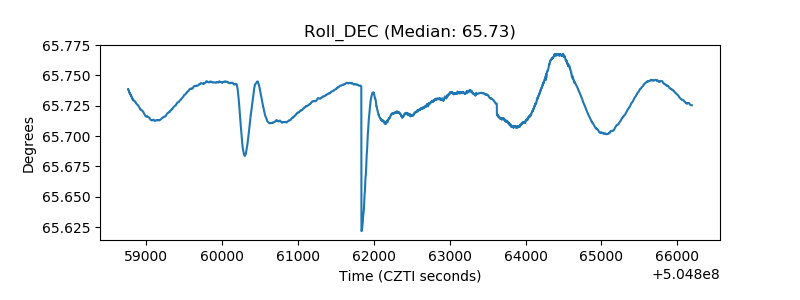 |
| _Roll_RA | 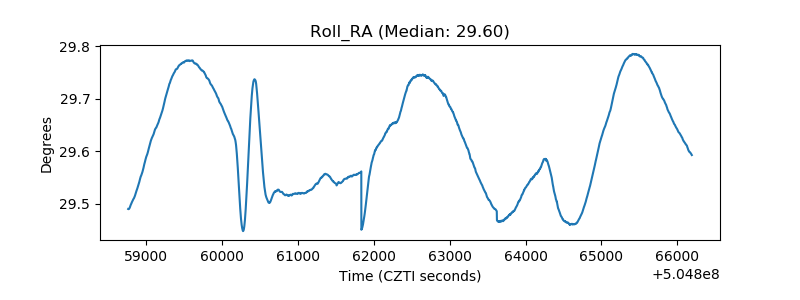 |
| Veto Counter | 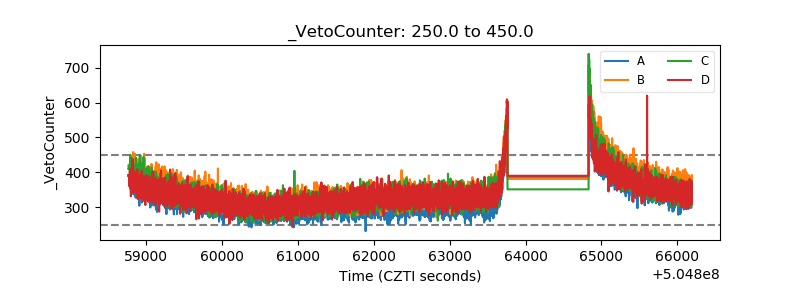 |