| Param | Original file | Final file |
|---|---|---|
| Filename | modeM0/AS1A14_099T01_9000006536_55504cztM0_level2.fits | modeM0/AS1A14_099T01_9000006536_55504cztM0_level2_quad_clean.evt |
| Size (bytes) | 468,599,040 | 84,522,240 |
| Size | 446.9 MB | 80.6 MB |
| Events in quadrant A | 3,435,460 | 569,780 |
| Events in quadrant B | 2,705,683 | 617,110 |
| Events in quadrant C | 7,300,846 | 450,696 |
| Events in quadrant D | 3,451,822 | 515,094 |
| Mode M9 | |||
|---|---|---|---|
| Quadrant | BADHDUFLAG | Total packets | Discarded packets |
| A | 0 | 11 | 0 |
| B | 0 | 11 | 0 |
| C | 0 | 11 | 0 |
| D | 0 | 11 | 0 |
| Mode SS | |||
|---|---|---|---|
| Quadrant | BADHDUFLAG | Total packets | Discarded packets |
| A | 0 | 118 | 0 |
| B | 0 | 118 | 0 |
| C | 0 | 118 | 0 |
| D | 0 | 118 | 0 |
| Mode M0 | |||
|---|---|---|---|
| Quadrant | BADHDUFLAG | Total packets | Discarded packets |
| A | 0 | 14215 | 3 |
| B | 0 | 12279 | 1 |
| C | 0 | 25780 | 2 |
| D | 0 | 14274 | 6 |
| Quadrant | Total seconds | Saturated seconds | Saturation percentage |
|---|---|---|---|
| A | 5816 | 251 | 4.315681% |
| B | 5817 | 147 | 2.527076% |
| C | 5816 | 1239 | 21.303301% |
| D | 5815 | 163 | 2.803095% |
Noise dominated data is calculated using 1-second bins in cleaned event files. If a bin has >2000 counts, and if more than 50% of those come from <1% of pixels, then it is considered to be noise-dominated and hence unusable.
| Quadrant | # 1 sec bins | Bins with >0 counts | Bins with >2000 counts | High rate bins dominated by noise | Noise dominated (total time) | Noise dominated (detector-on time) | Marked lightcurve |
|---|---|---|---|---|---|---|---|
| A | 6942 | 5818 | 123 | 123 | 1.77% | 2.11% | 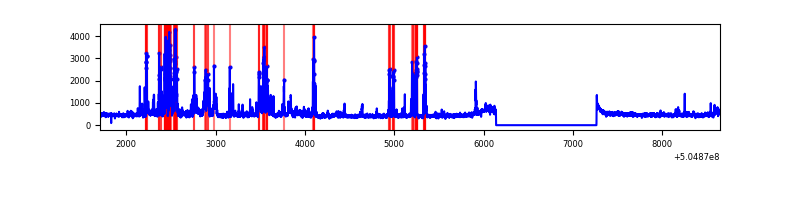 |
| B | 6942 | 5818 | 11 | 11 | 0.16% | 0.19% | 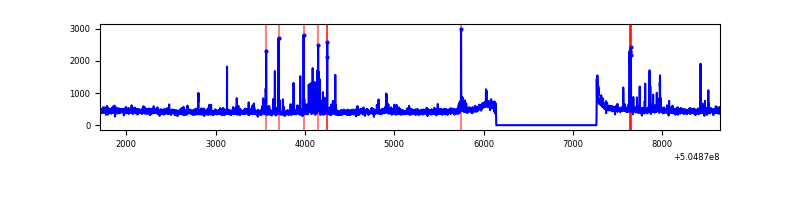 |
| C | 6941 | 5817 | 897 | 897 | 12.92% | 15.42% | 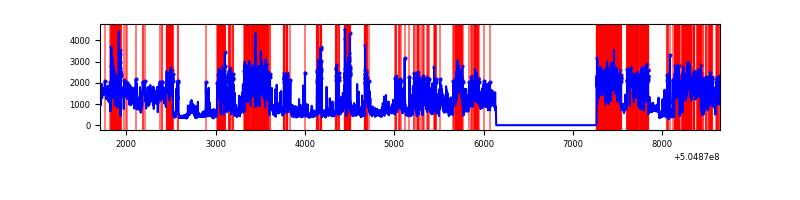 |
| D | 6941 | 5817 | 78 | 78 | 1.12% | 1.34% | 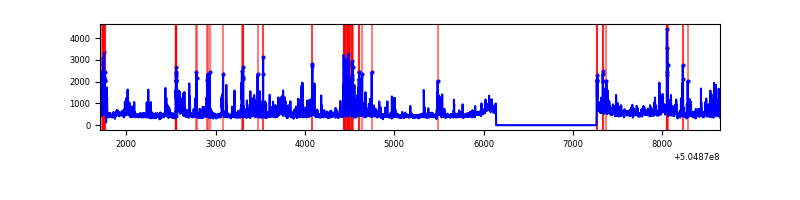 |
Top three noisy pixels from each quadrant. If the there are fewer than three noisy pixels in the level2.evt file, extra rows are filled as -1
| Pixel properties | Quadrant properties | ||||||
|---|---|---|---|---|---|---|---|
| Quadrant | DetID | PixID | Counts | Sigma | Mean | Median | Sigma |
| A | 0 | 8 | 455776 | 2906.56 | 636 | 621 | 156.6 |
| A | 3 | 78 | 401741 | 2561.5 | 636 | 621 | 156.6 |
| A | 13 | 248 | 37587 | 236.06 | 636 | 621 | 156.6 |
| B | 10 | 247 | 97415 | 717.95 | 625 | 602 | 134.8 |
| B | 4 | 67 | 25545 | 184.97 | 625 | 602 | 134.8 |
| B | 5 | 172 | 25153 | 182.07 | 625 | 602 | 134.8 |
| C | 9 | 38 | 4354207 | 27782.39 | 570 | 564 | 156.7 |
| C | 15 | 147 | 175753 | 1117.95 | 570 | 564 | 156.7 |
| C | 13 | 3 | 166477 | 1058.76 | 570 | 564 | 156.7 |
| D | 8 | 160 | 258040 | 1477.8 | 617 | 586 | 174.2 |
| D | 11 | 129 | 252671 | 1446.98 | 617 | 586 | 174.2 |
| D | 6 | 239 | 237380 | 1359.21 | 617 | 586 | 174.2 |
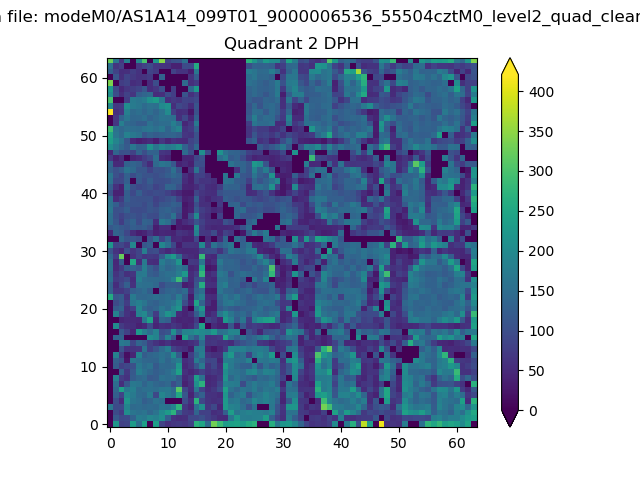
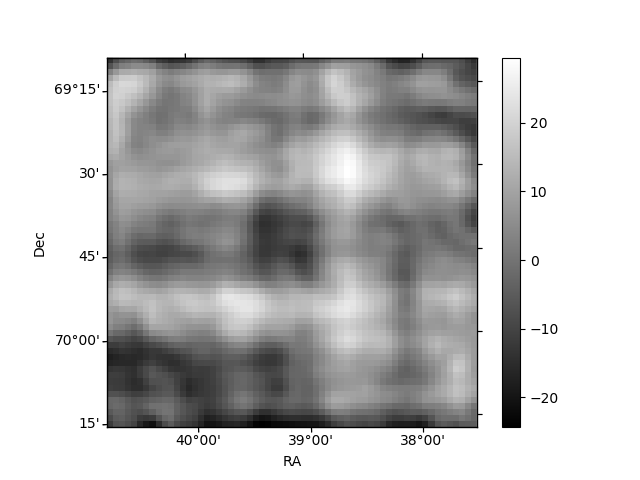
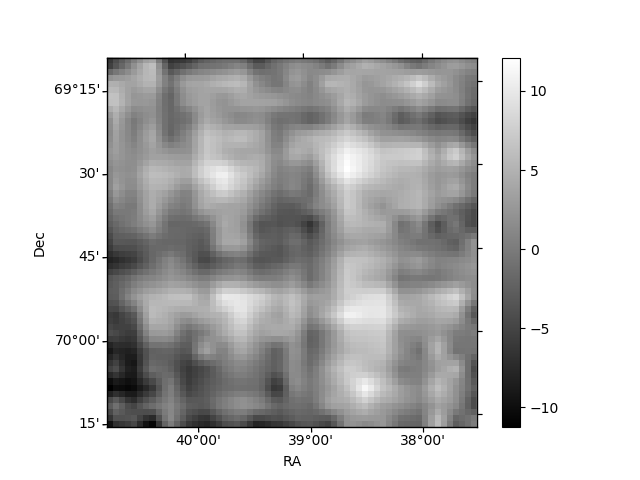
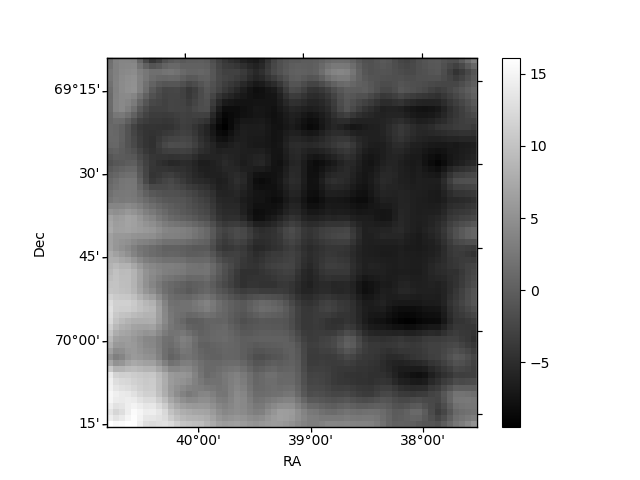
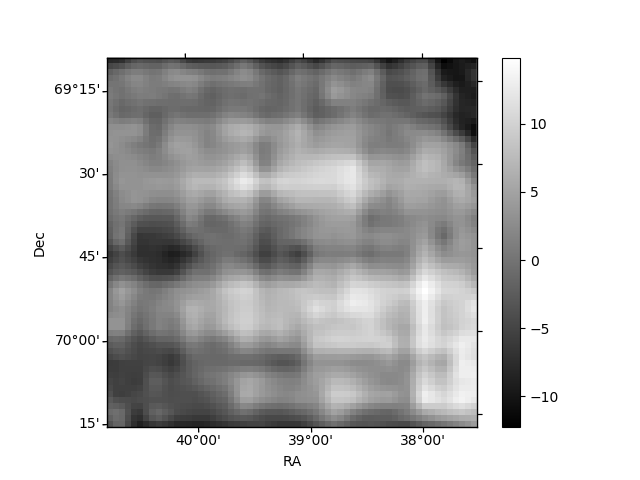
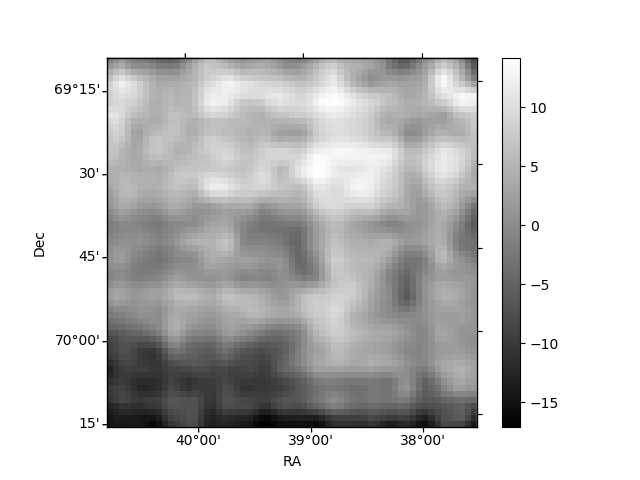
Histogram calculated using DETX and DETY for each event in the final _common_clean file
| Quadrant A | 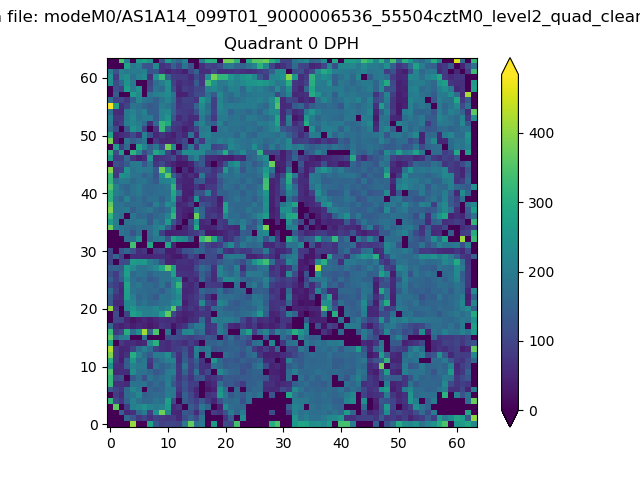 |
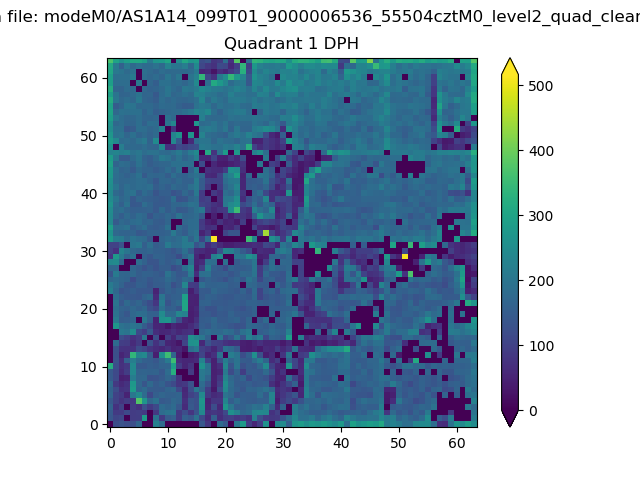 |
Quadrant B |
|---|---|---|---|
| Quadrant D | 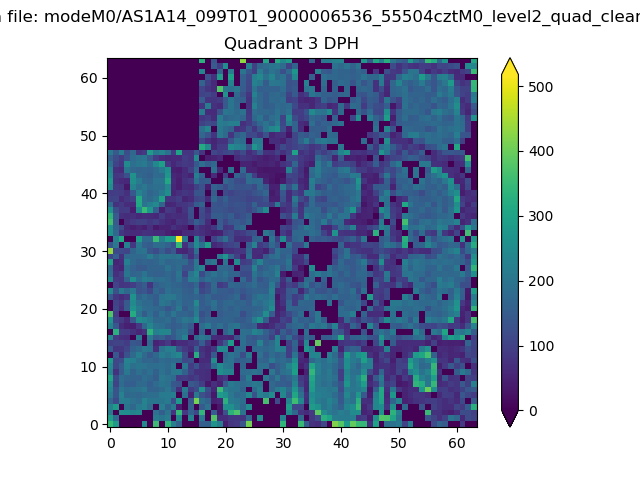 |
 |
Quadrant C |
| Plot type | Count rate plots | Images |
|---|---|---|
| Comparison with Poisson distribution Blue bars denote a histogram of data divided into 1 sec bins. Red curve is a Poisson curve with rate = median count rate of data. |
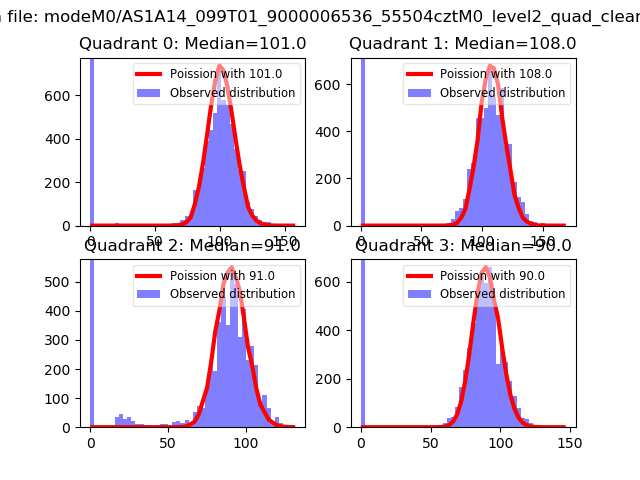 |
 |
| Quadrant-wise count rates Data is divided into 100 sec bins |
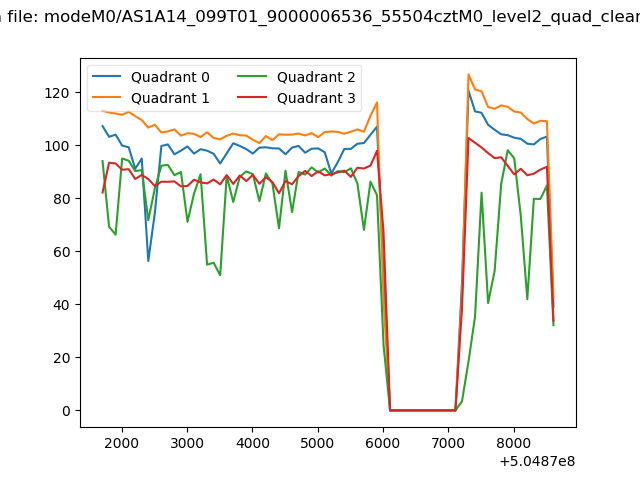 |
|
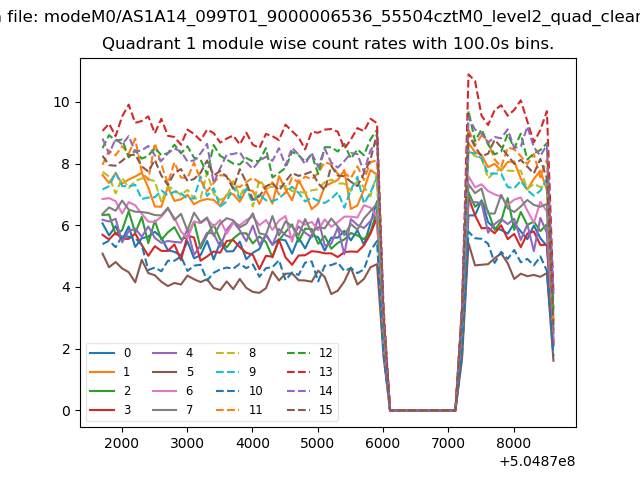
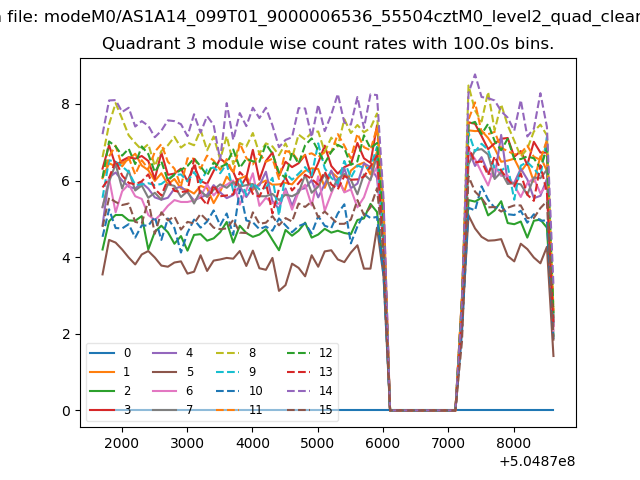
| Module-wise count rates for Quadrant A Data is divided into 100 sec bins |
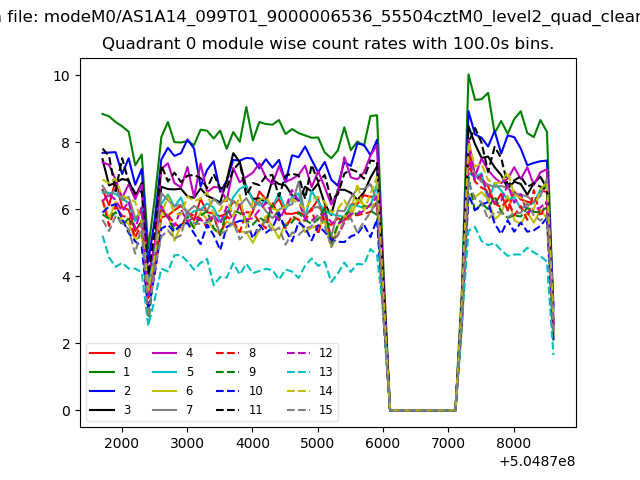 |
 |
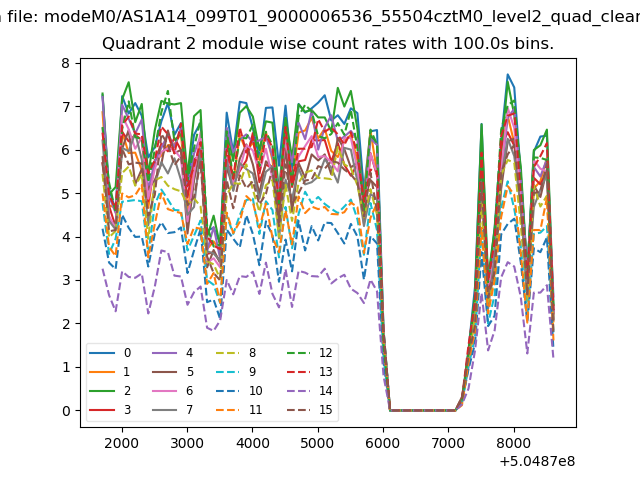
| Module-wise count rates for Quadrant B Data is divided into 100 sec bins |
 |
 |
| Module-wise count rates for Quadrant C Data is divided into 100 sec bins |
 |
 |
| Module-wise count rates for Quadrant D Data is divided into 100 sec bins |
 |
 |
| Parameter | Plot |
|---|---|
| CZT HV Monitor |  |
| D_VDD | 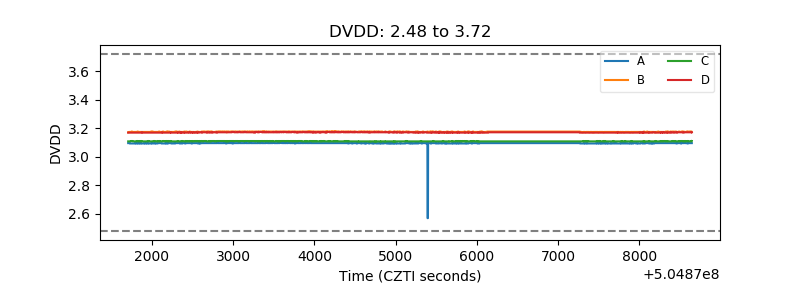 |
| Temperature 1 | 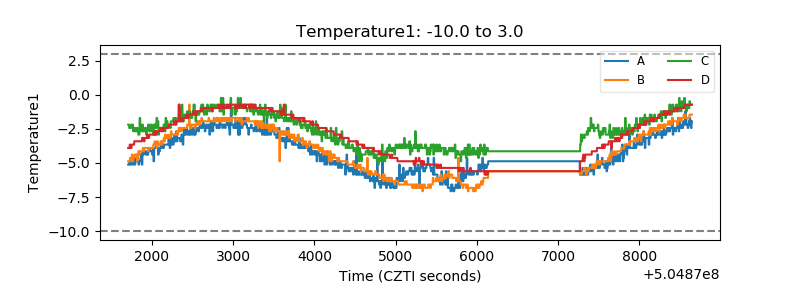 |
| Veto HV Monitor | 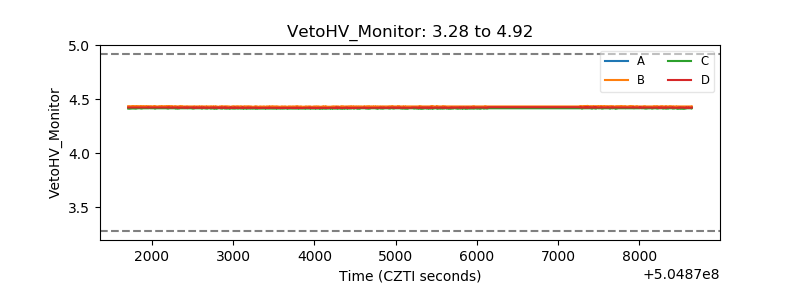 |
| Veto LLD | 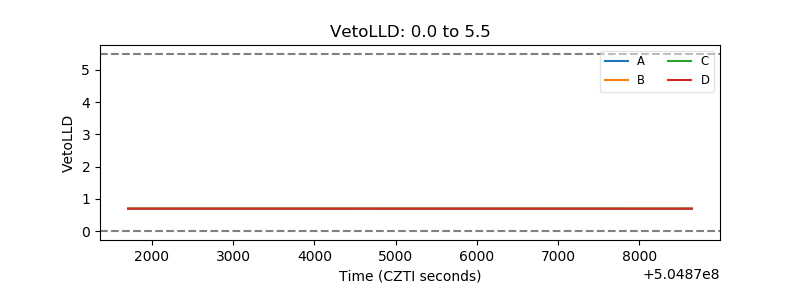 |
| Alpha Counter | 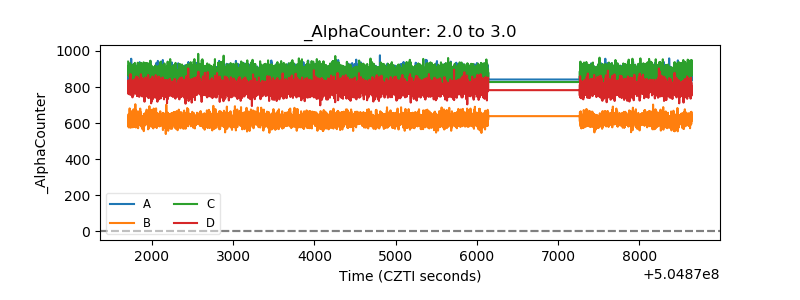 |
| _CPM_Rate | 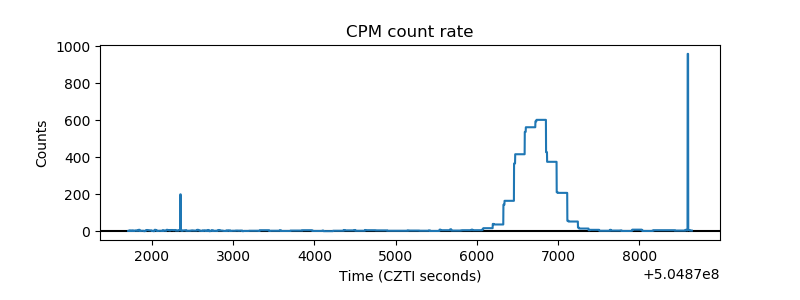 |
| CZT Counter | 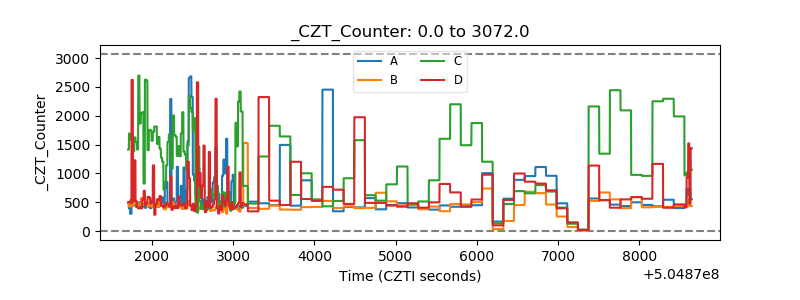 |
| +2.5 Volts monitor | 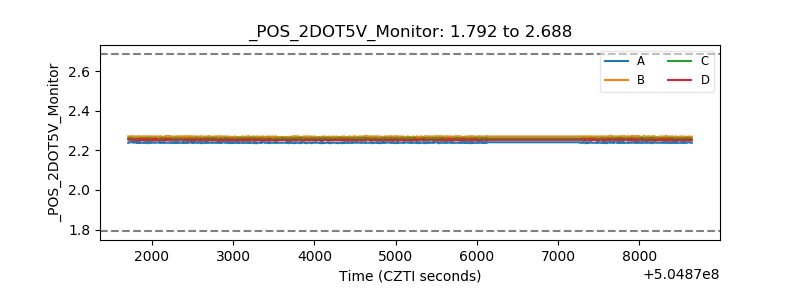 |
| +5 Volts monitor | 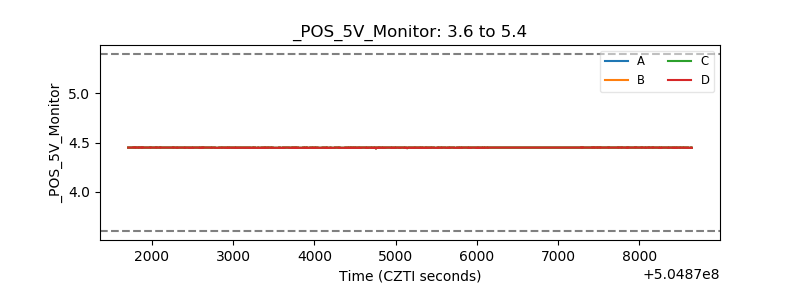 |
| _ROLL_ROT | 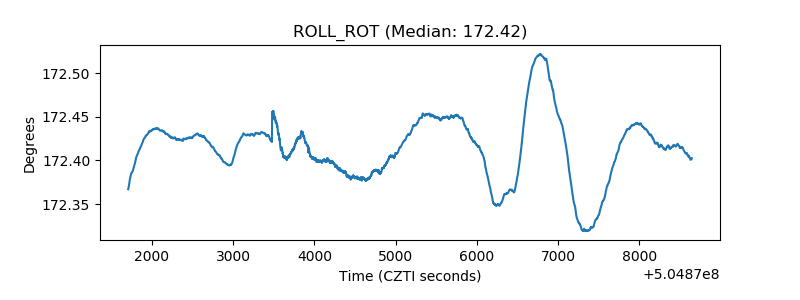 |
| _Roll_DEC | 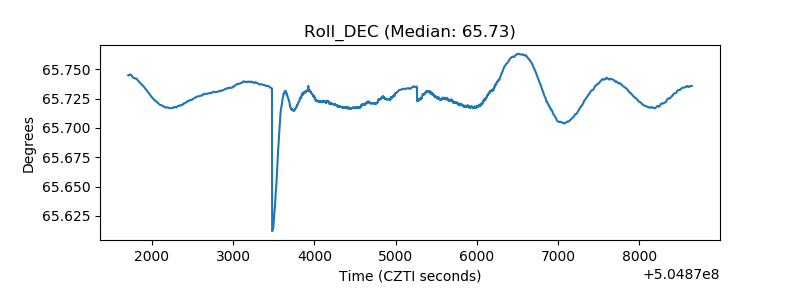 |
| _Roll_RA | 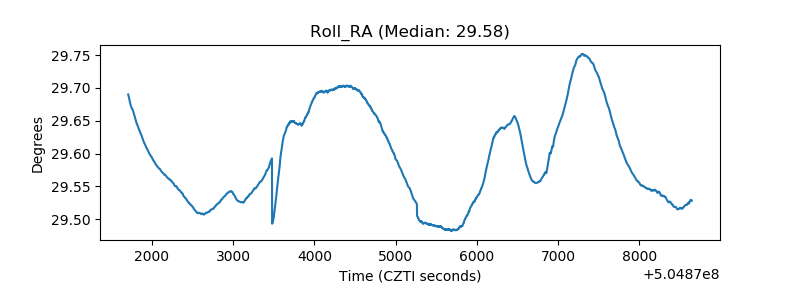 |
| Veto Counter | 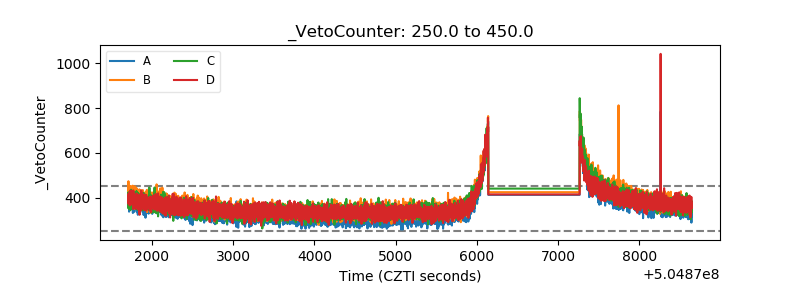 |