| Param | Original file | Final file |
|---|---|---|
| Filename | modeM0/AS1A14_099T01_9000006536_55505cztM0_level2.fits | modeM0/AS1A14_099T01_9000006536_55505cztM0_level2_quad_clean.evt |
| Size (bytes) | 521,657,280 | 91,218,240 |
| Size | 497.5 MB | 87.0 MB |
| Events in quadrant A | 3,249,838 | 629,004 |
| Events in quadrant B | 2,991,686 | 675,107 |
| Events in quadrant C | 8,112,328 | 464,284 |
| Events in quadrant D | 4,463,416 | 550,896 |
| Mode M9 | |||
|---|---|---|---|
| Quadrant | BADHDUFLAG | Total packets | Discarded packets |
| A | 0 | 11 | 0 |
| B | 0 | 11 | 0 |
| C | 0 | 11 | 0 |
| D | 0 | 11 | 0 |
| Mode SS | |||
|---|---|---|---|
| Quadrant | BADHDUFLAG | Total packets | Discarded packets |
| A | 0 | 130 | 0 |
| B | 0 | 130 | 0 |
| C | 0 | 130 | 0 |
| D | 0 | 130 | 0 |
| Mode M0 | |||
|---|---|---|---|
| Quadrant | BADHDUFLAG | Total packets | Discarded packets |
| A | 0 | 14227 | 70 |
| B | 0 | 13463 | 84 |
| C | 0 | 28681 | 248 |
| D | 0 | 17799 | 77 |
| Quadrant | Total seconds | Saturated seconds | Saturation percentage |
|---|---|---|---|
| A | 6345 | 122 | 1.922774% |
| B | 6340 | 112 | 1.766562% |
| C | 6336 | 1569 | 24.763258% |
| D | 6345 | 274 | 4.318361% |
Noise dominated data is calculated using 1-second bins in cleaned event files. If a bin has >2000 counts, and if more than 50% of those come from <1% of pixels, then it is considered to be noise-dominated and hence unusable.
| Quadrant | # 1 sec bins | Bins with >0 counts | Bins with >2000 counts | High rate bins dominated by noise | Noise dominated (total time) | Noise dominated (detector-on time) | Marked lightcurve |
|---|---|---|---|---|---|---|---|
| A | 7446 | 6353 | 28 | 28 | 0.38% | 0.44% | 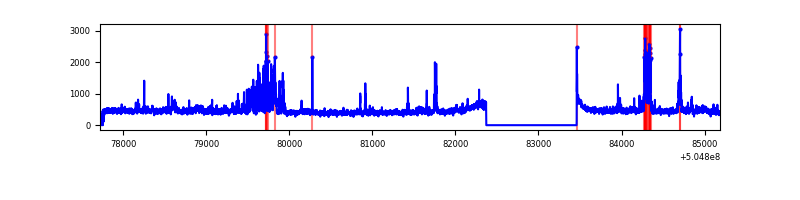 |
| B | 7440 | 6346 | 6 | 6 | 0.08% | 0.09% | 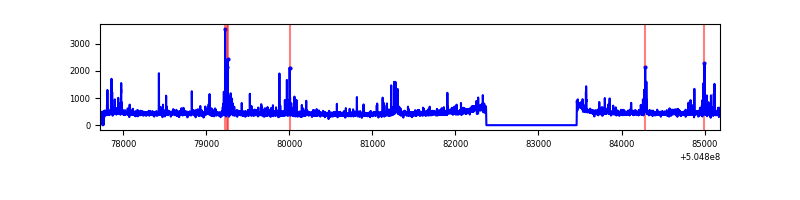 |
| C | 7450 | 6344 | 1292 | 1292 | 17.34% | 20.37% | 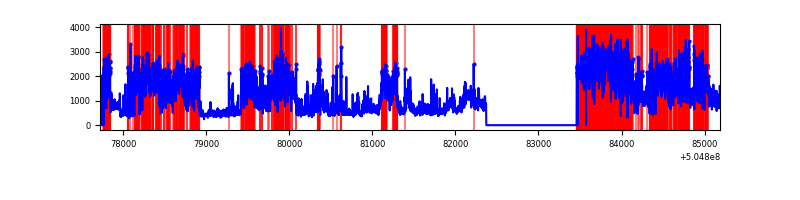 |
| D | 7464 | 6354 | 164 | 164 | 2.20% | 2.58% | 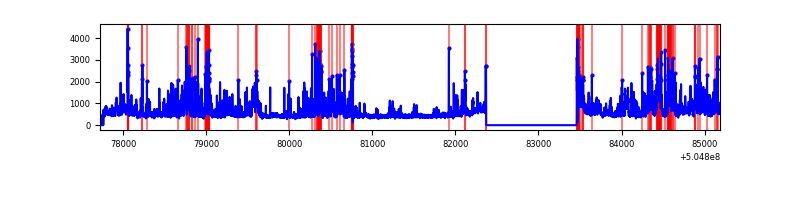 |
Top three noisy pixels from each quadrant. If the there are fewer than three noisy pixels in the level2.evt file, extra rows are filled as -1
| Pixel properties | Quadrant properties | ||||||
|---|---|---|---|---|---|---|---|
| Quadrant | DetID | PixID | Counts | Sigma | Mean | Median | Sigma |
| A | 4 | 159 | 276037 | 1595.27 | 693 | 674 | 172.6 |
| A | 3 | 78 | 199794 | 1153.57 | 693 | 674 | 172.6 |
| A | 0 | 8 | 35777 | 203.36 | 693 | 674 | 172.6 |
| B | 5 | 172 | 123973 | 857.45 | 677 | 653 | 143.8 |
| B | 10 | 247 | 118782 | 821.36 | 677 | 653 | 143.8 |
| B | 12 | 111 | 16968 | 113.44 | 677 | 653 | 143.8 |
| C | 9 | 38 | 5471205 | 33405.39 | 593 | 586 | 163.8 |
| C | 1 | 16 | 82819 | 502.14 | 593 | 586 | 163.8 |
| C | 15 | 199 | 54190 | 327.32 | 593 | 586 | 163.8 |
| D | 11 | 129 | 399216 | 2145.85 | 663 | 633 | 185.7 |
| D | 10 | 181 | 382378 | 2055.2 | 663 | 633 | 185.7 |
| D | 6 | 239 | 367827 | 1976.86 | 663 | 633 | 185.7 |
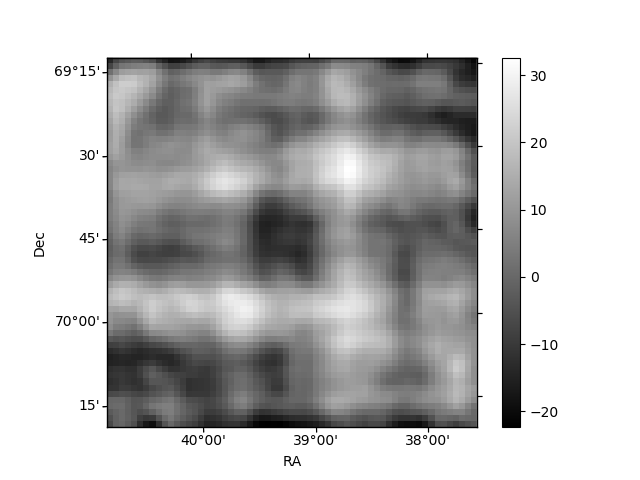
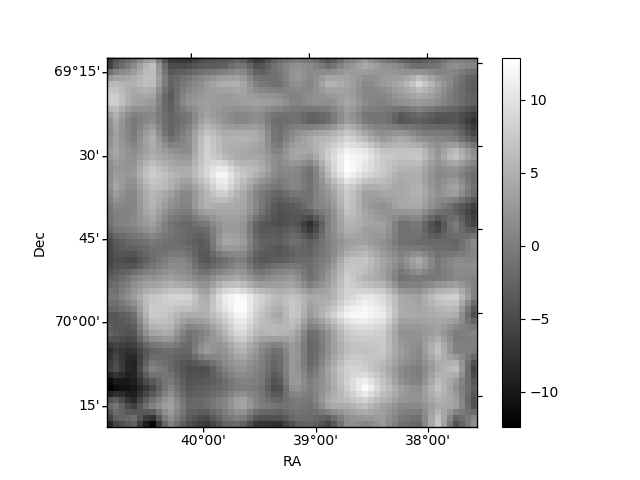
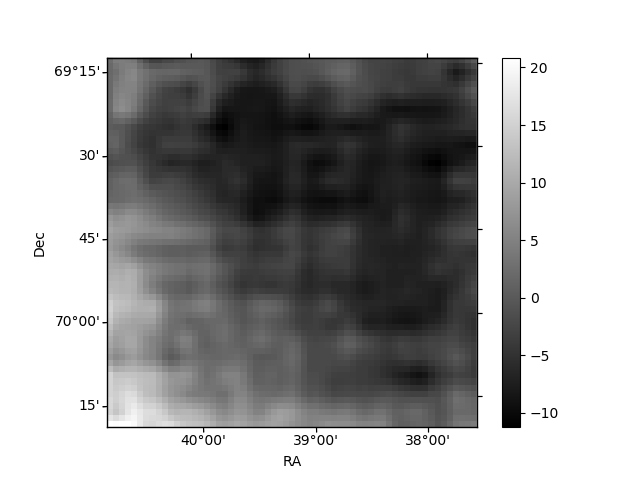
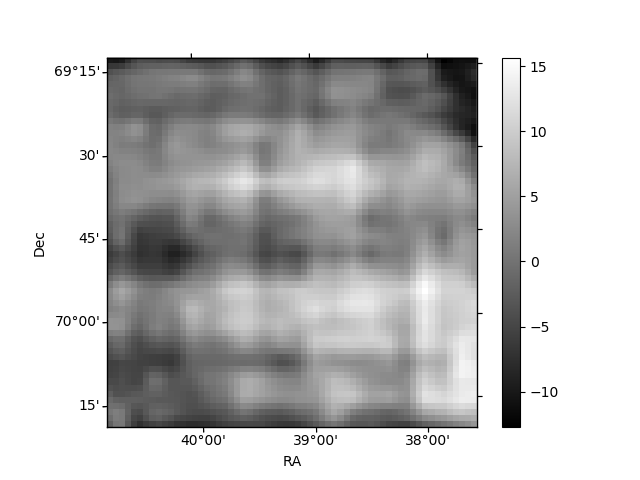
Histogram calculated using DETX and DETY for each event in the final _common_clean file
| Quadrant A | 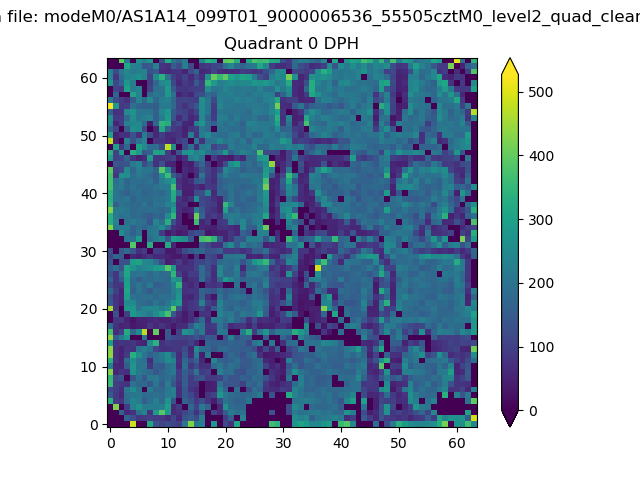 |
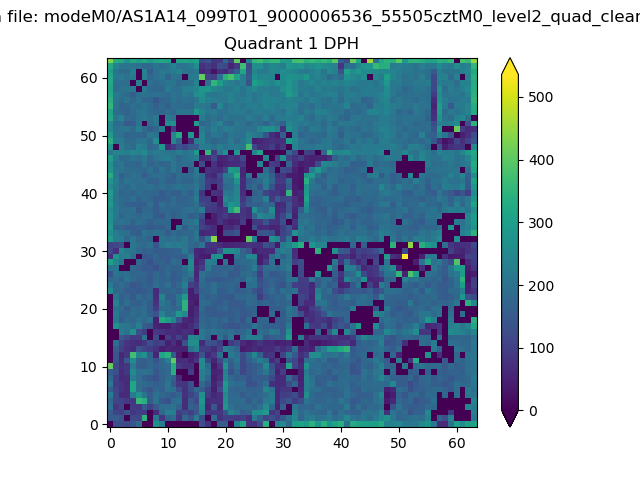 |
Quadrant B |
|---|---|---|---|
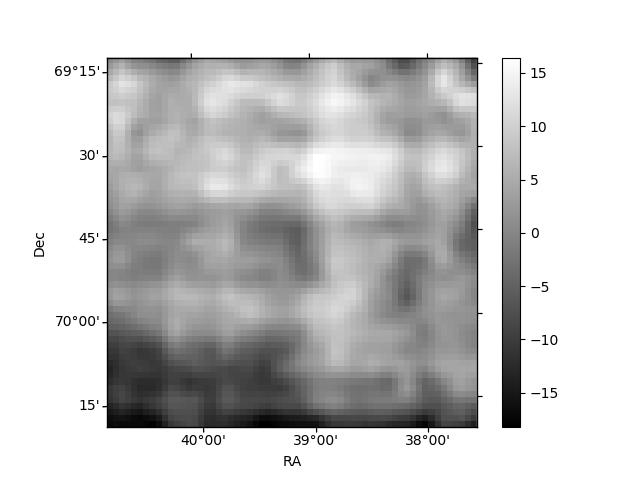
| Quadrant D | 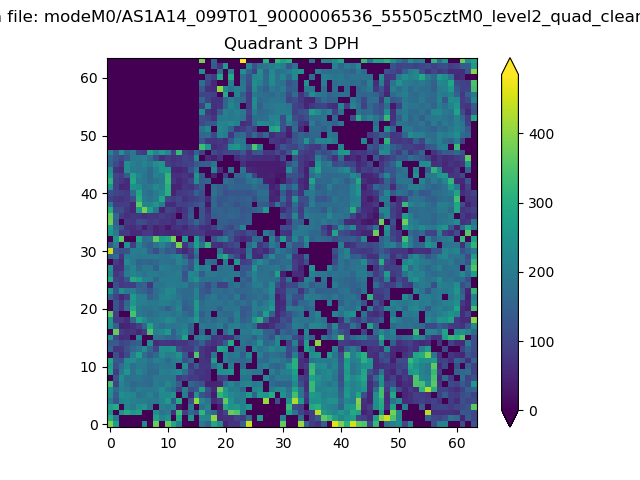 |
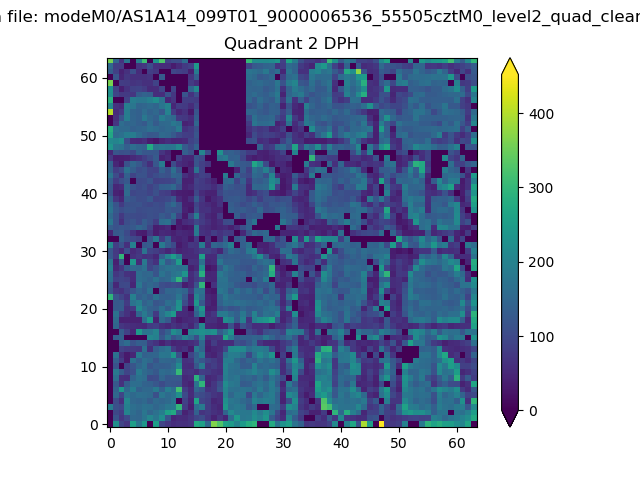 |
Quadrant C |
| Plot type | Count rate plots | Images |
|---|---|---|
| Comparison with Poisson distribution Blue bars denote a histogram of data divided into 1 sec bins. Red curve is a Poisson curve with rate = median count rate of data. |
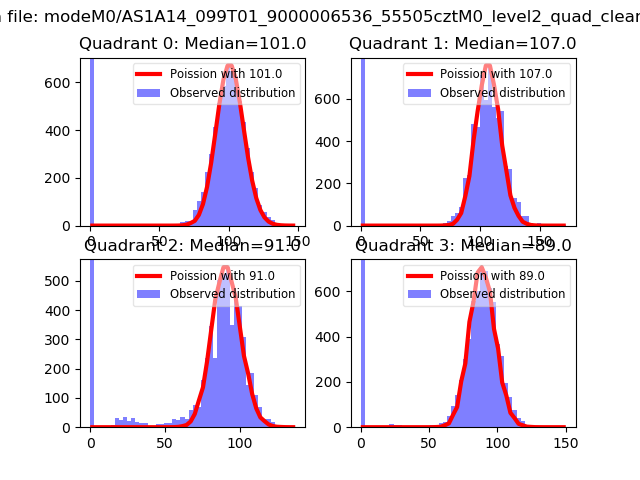 |
 |
| Quadrant-wise count rates Data is divided into 100 sec bins |
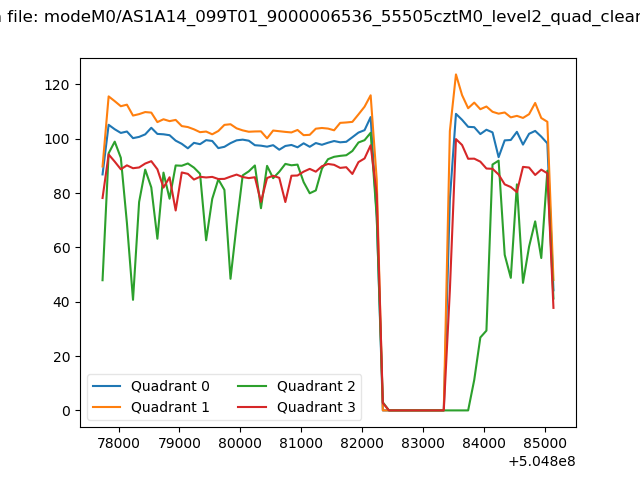 |
|
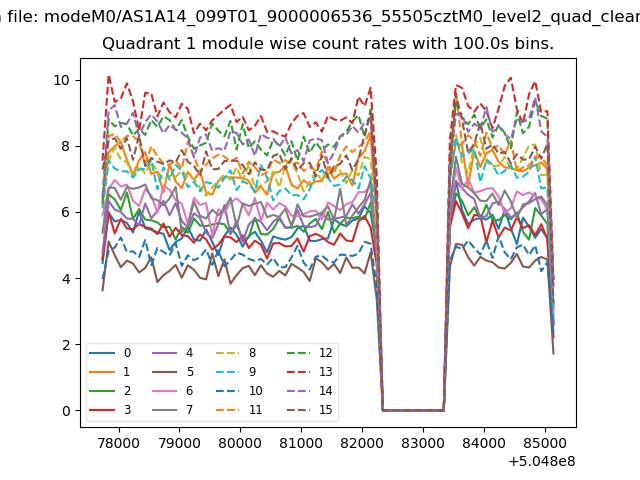
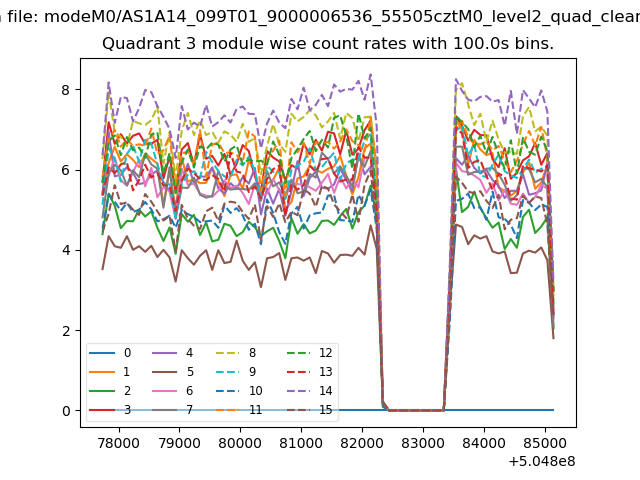
| Module-wise count rates for Quadrant A Data is divided into 100 sec bins |
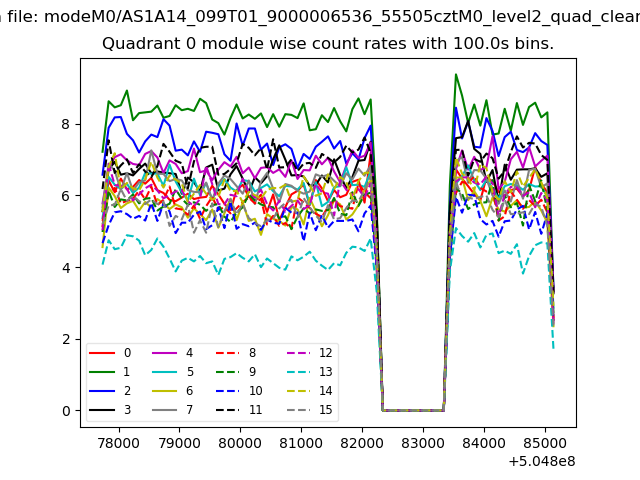 |
 |
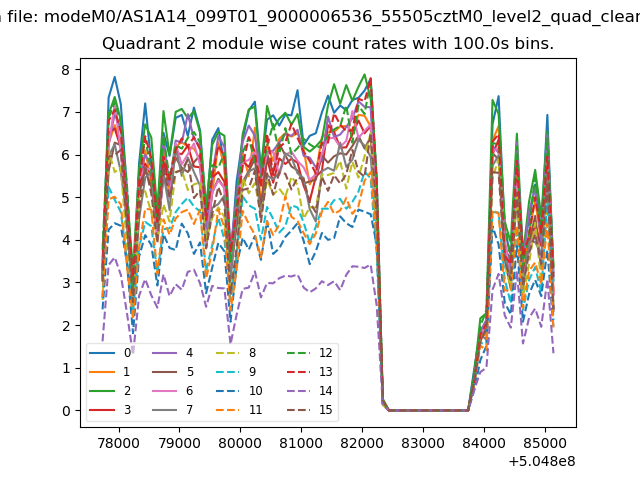
| Module-wise count rates for Quadrant B Data is divided into 100 sec bins |
 |
 |
| Module-wise count rates for Quadrant C Data is divided into 100 sec bins |
 |
 |
| Module-wise count rates for Quadrant D Data is divided into 100 sec bins |
 |
 |
| Parameter | Plot |
|---|---|
| CZT HV Monitor | 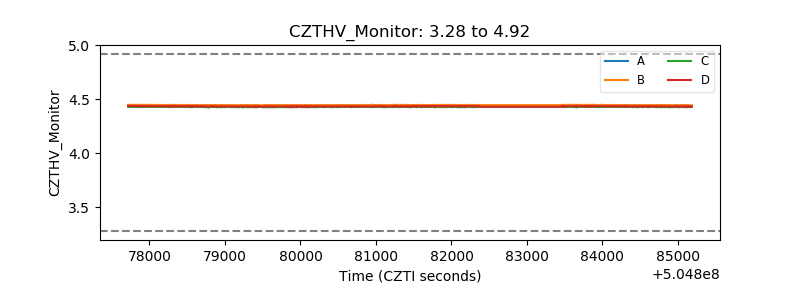 |
| D_VDD | 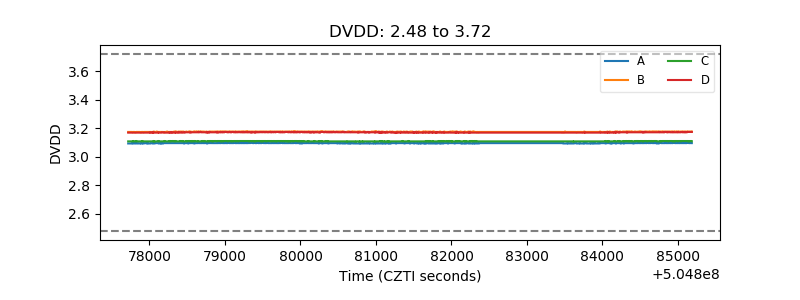 |
| Temperature 1 | 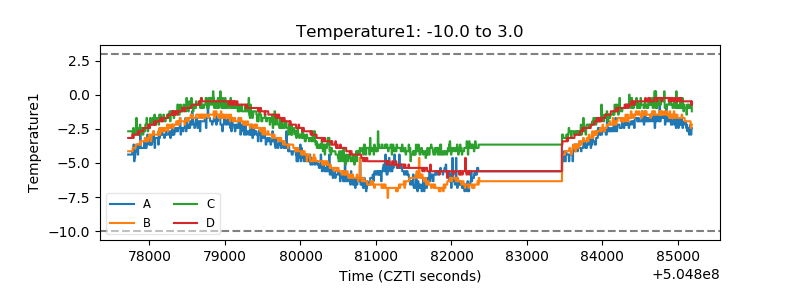 |
| Veto HV Monitor |  |
| Veto LLD | 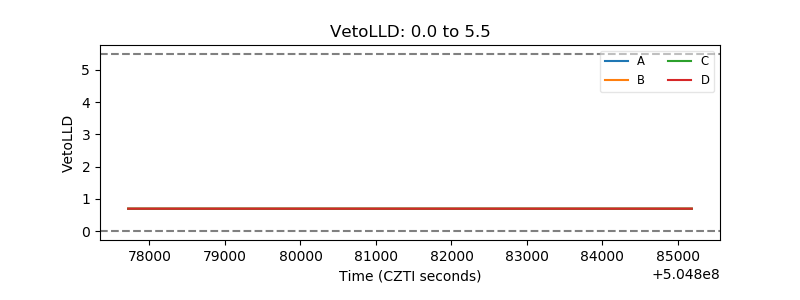 |
| Alpha Counter | 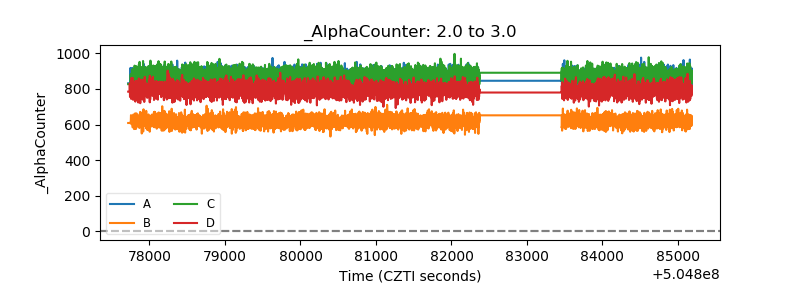 |
| _CPM_Rate | 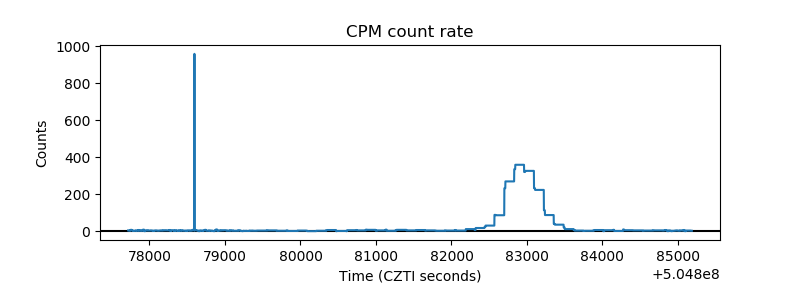 |
| CZT Counter | 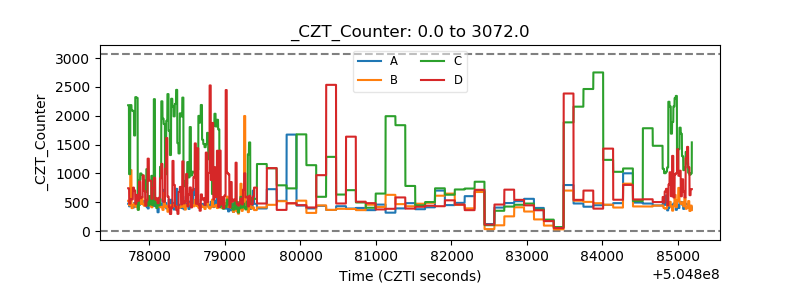 |
| +2.5 Volts monitor | 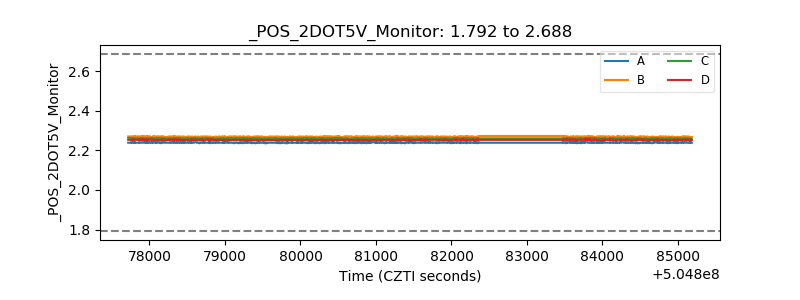 |
| +5 Volts monitor | 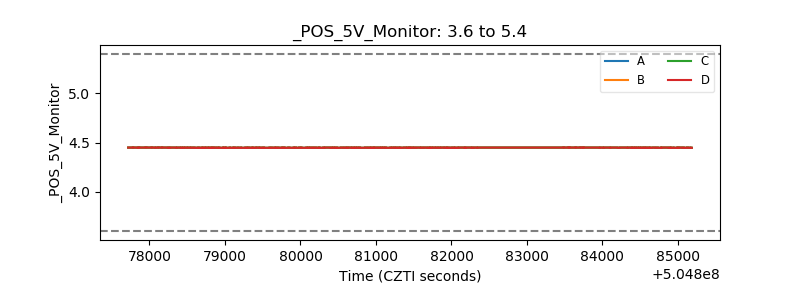 |
| _ROLL_ROT | 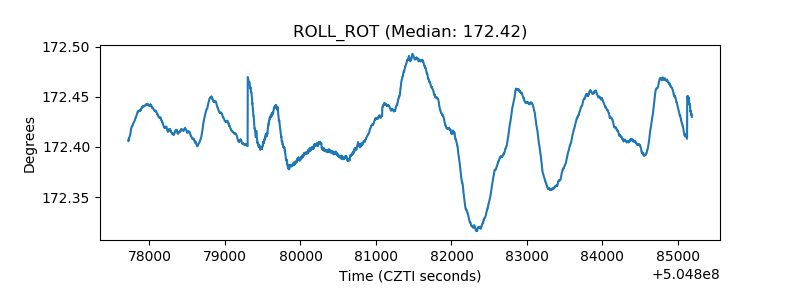 |
| _Roll_DEC | 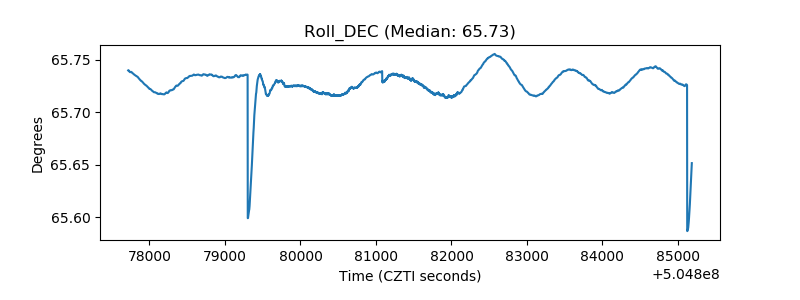 |
| _Roll_RA | 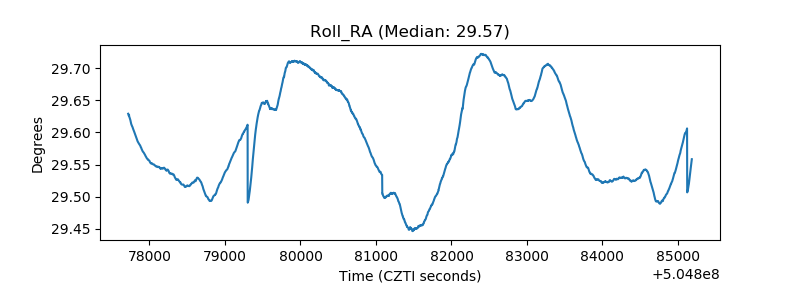 |
| Veto Counter | 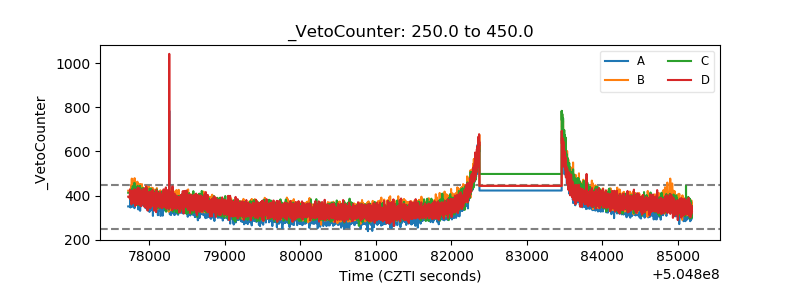 |