| Param | Original file | Final file |
|---|---|---|
| Filename | modeM0/AS1A14_099T01_9000006536_55507cztM0_level2.fits | modeM0/AS1A14_099T01_9000006536_55507cztM0_level2_quad_clean.evt |
| Size (bytes) | 697,181,760 | 87,189,120 |
| Size | 664.9 MB | 83.2 MB |
| Events in quadrant A | 3,130,313 | 646,235 |
| Events in quadrant B | 8,770,446 | 476,465 |
| Events in quadrant C | 6,954,149 | 540,634 |
| Events in quadrant D | 6,425,496 | 502,897 |
| Mode M9 | |||
|---|---|---|---|
| Quadrant | BADHDUFLAG | Total packets | Discarded packets |
| A | 0 | 6 | 0 |
| B | 0 | 6 | 0 |
| C | 0 | 6 | 0 |
| D | 0 | 6 | 0 |
| Mode SS | |||
|---|---|---|---|
| Quadrant | BADHDUFLAG | Total packets | Discarded packets |
| A | 0 | 138 | 0 |
| B | 0 | 138 | 0 |
| C | 0 | 138 | 0 |
| D | 0 | 138 | 0 |
| Mode M0 | |||
|---|---|---|---|
| Quadrant | BADHDUFLAG | Total packets | Discarded packets |
| A | 0 | 14432 | 1 |
| B | 0 | 30853 | 1 |
| C | 0 | 25432 | 1 |
| D | 0 | 23739 | 1 |
| Quadrant | Total seconds | Saturated seconds | Saturation percentage |
|---|---|---|---|
| A | 6791 | 79 | 1.163304% |
| B | 6792 | 2314 | 34.069494% |
| C | 6792 | 1044 | 15.371025% |
| D | 6792 | 1036 | 15.253239% |
Noise dominated data is calculated using 1-second bins in cleaned event files. If a bin has >2000 counts, and if more than 50% of those come from <1% of pixels, then it is considered to be noise-dominated and hence unusable.
| Quadrant | # 1 sec bins | Bins with >0 counts | Bins with >2000 counts | High rate bins dominated by noise | Noise dominated (total time) | Noise dominated (detector-on time) | Marked lightcurve |
|---|---|---|---|---|---|---|---|
| A | 7421 | 6792 | 18 | 18 | 0.24% | 0.27% | 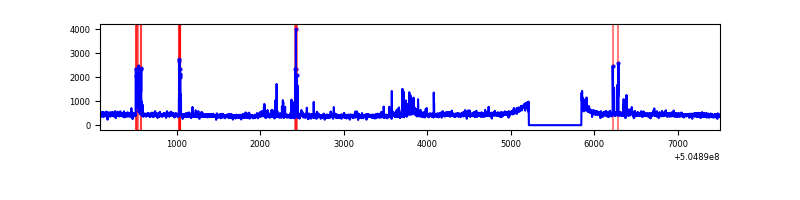 |
| B | 7422 | 6793 | 1476 | 1476 | 19.89% | 21.73% | 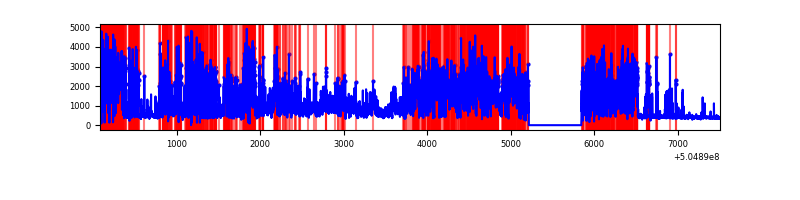 |
| C | 7422 | 6793 | 837 | 837 | 11.28% | 12.32% | 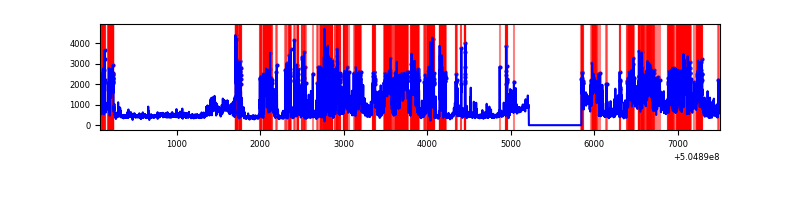 |
| D | 7422 | 6793 | 947 | 947 | 12.76% | 13.94% | 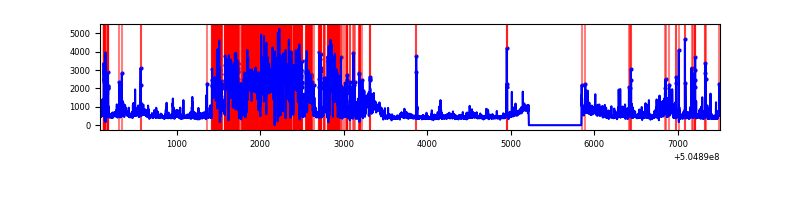 |
Top three noisy pixels from each quadrant. If the there are fewer than three noisy pixels in the level2.evt file, extra rows are filled as -1
| Pixel properties | Quadrant properties | ||||||
|---|---|---|---|---|---|---|---|
| Quadrant | DetID | PixID | Counts | Sigma | Mean | Median | Sigma |
| A | 0 | 31 | 133717 | 742.33 | 722 | 701 | 179.2 |
| A | 0 | 8 | 83050 | 459.57 | 722 | 701 | 179.2 |
| A | 12 | 115 | 30085 | 163.98 | 722 | 701 | 179.2 |
| B | 5 | 172 | 6243750 | 48657.22 | 601 | 577 | 128.3 |
| B | 10 | 247 | 57617 | 444.55 | 601 | 577 | 128.3 |
| B | 7 | 252 | 35252 | 270.25 | 601 | 577 | 128.3 |
| C | 9 | 38 | 3086564 | 17021.31 | 668 | 662 | 181.3 |
| C | 12 | 252 | 567212 | 3124.99 | 668 | 662 | 181.3 |
| C | 13 | 3 | 264334 | 1454.37 | 668 | 662 | 181.3 |
| D | 11 | 129 | 3178436 | 17001.0 | 657 | 629 | 186.9 |
| D | 3 | 12 | 135748 | 722.88 | 657 | 629 | 186.9 |
| D | 6 | 239 | 88826 | 471.85 | 657 | 629 | 186.9 |
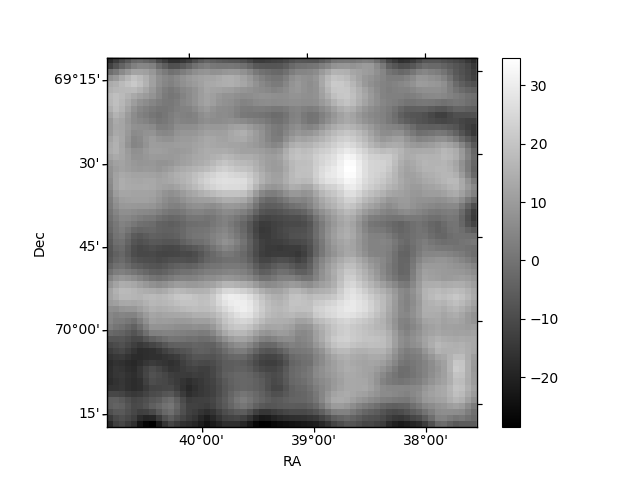
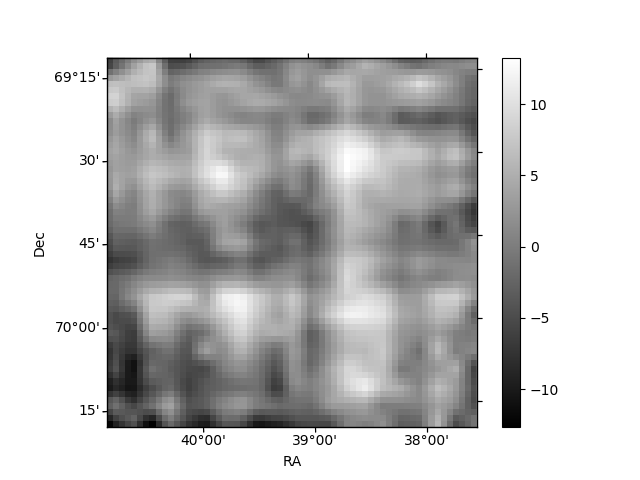
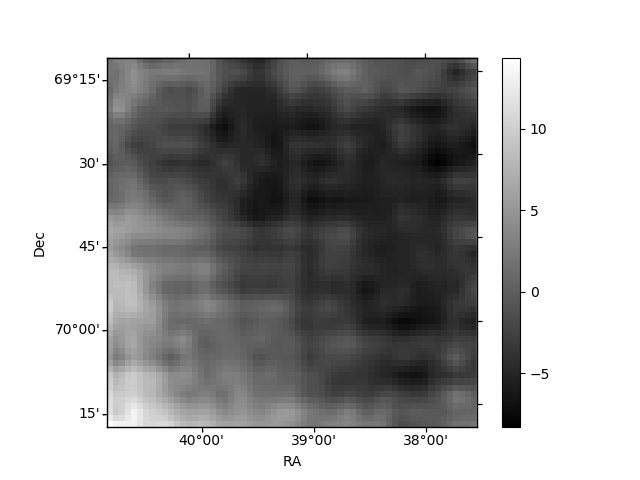
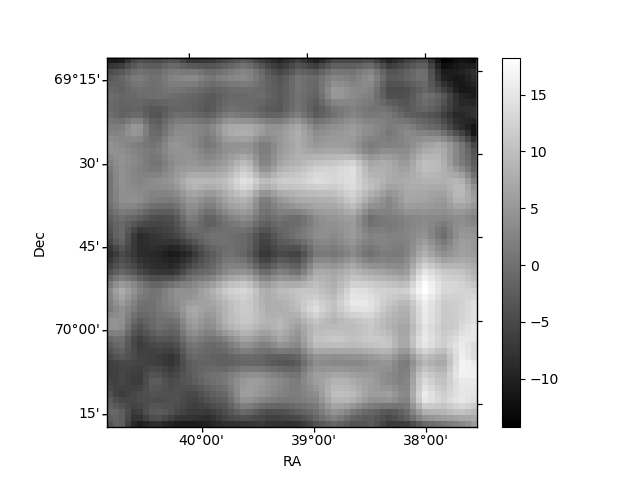
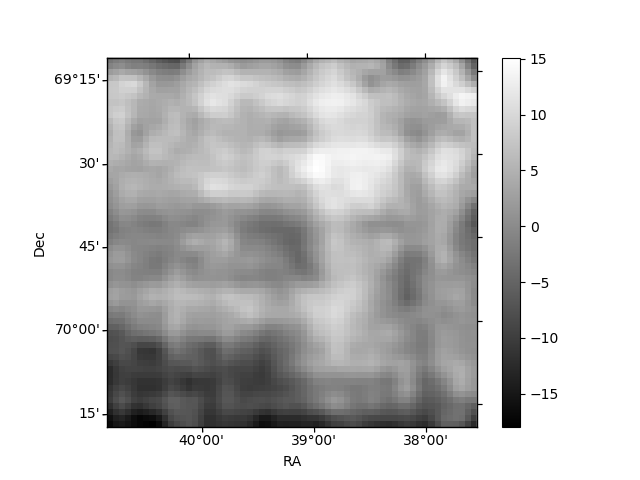
Histogram calculated using DETX and DETY for each event in the final _common_clean file
| Quadrant A | 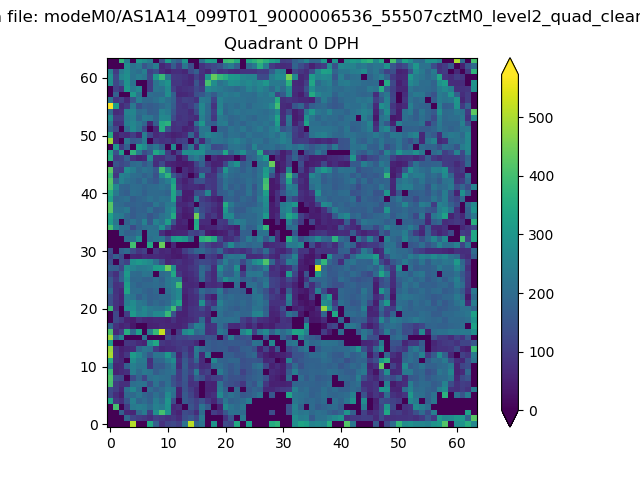 |
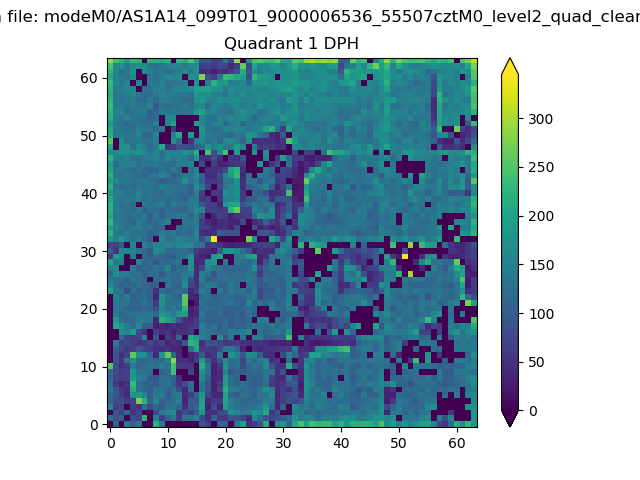 |
Quadrant B |
|---|---|---|---|
| Quadrant D | 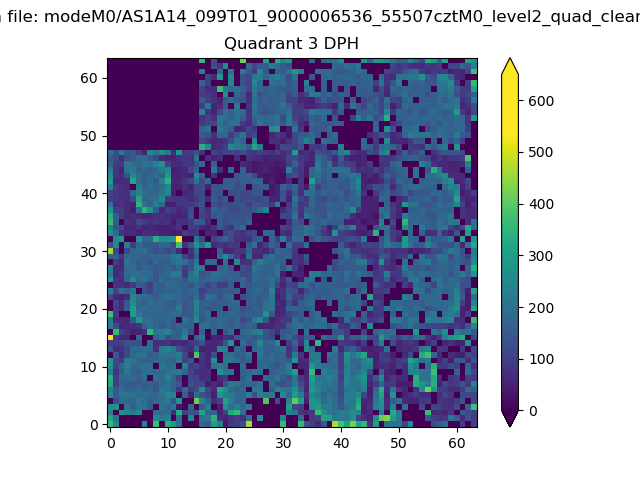 |
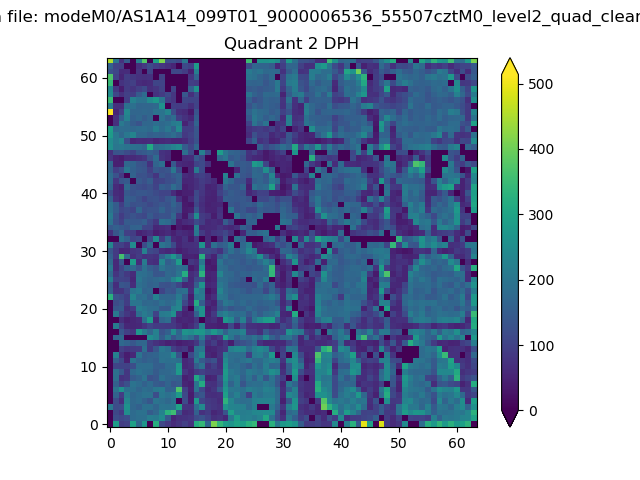 |
Quadrant C |
| Plot type | Count rate plots | Images |
|---|---|---|
| Comparison with Poisson distribution Blue bars denote a histogram of data divided into 1 sec bins. Red curve is a Poisson curve with rate = median count rate of data. |
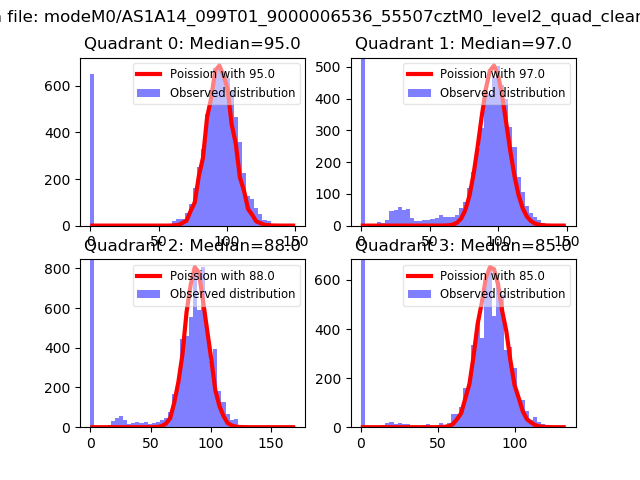 |
 |
| Quadrant-wise count rates Data is divided into 100 sec bins |
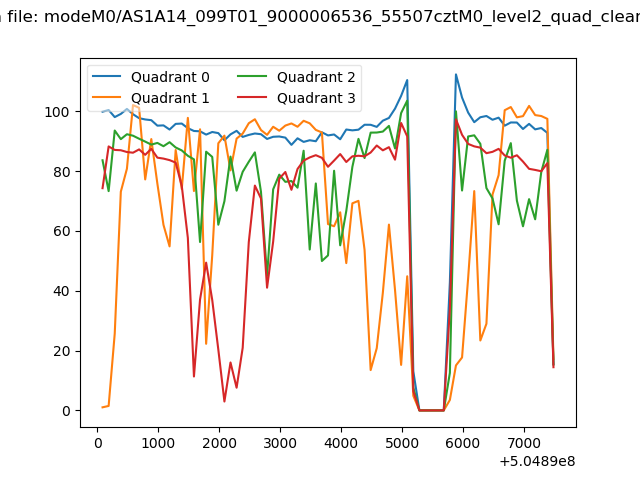 |
|
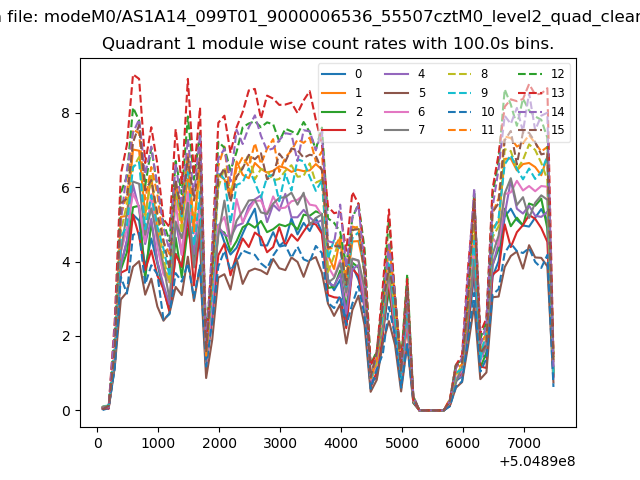
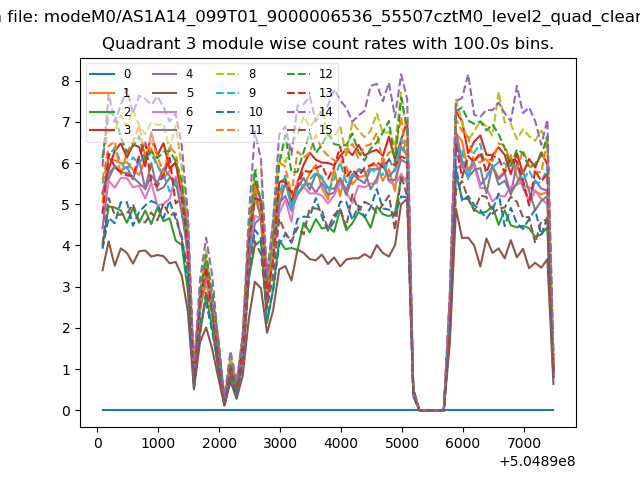
| Module-wise count rates for Quadrant A Data is divided into 100 sec bins |
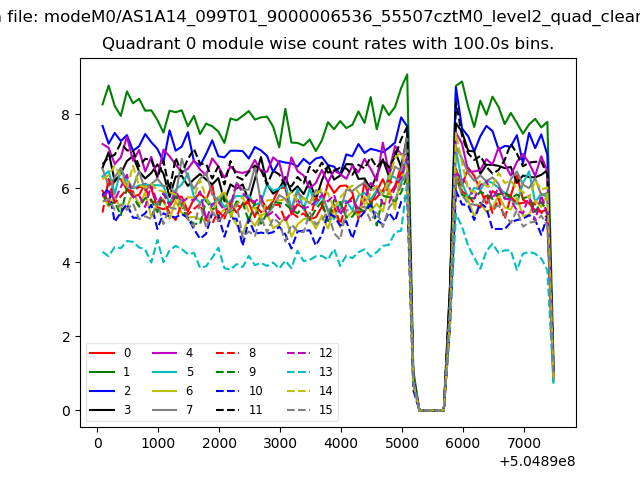 |
 |
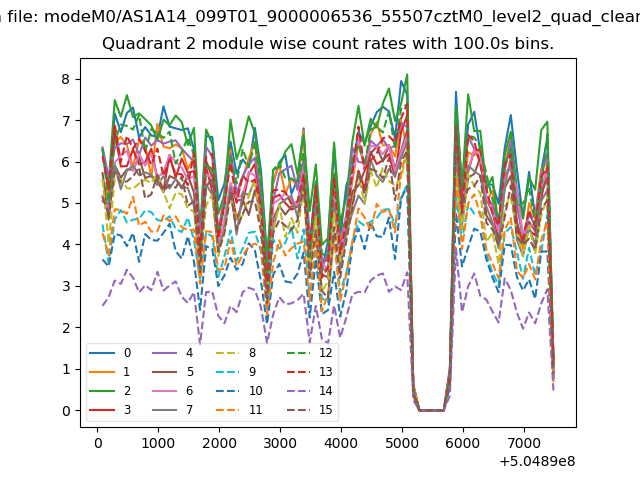
| Module-wise count rates for Quadrant B Data is divided into 100 sec bins |
 |
 |
| Module-wise count rates for Quadrant C Data is divided into 100 sec bins |
 |
 |
| Module-wise count rates for Quadrant D Data is divided into 100 sec bins |
 |
 |
| Parameter | Plot |
|---|---|
| CZT HV Monitor |  |
| D_VDD | 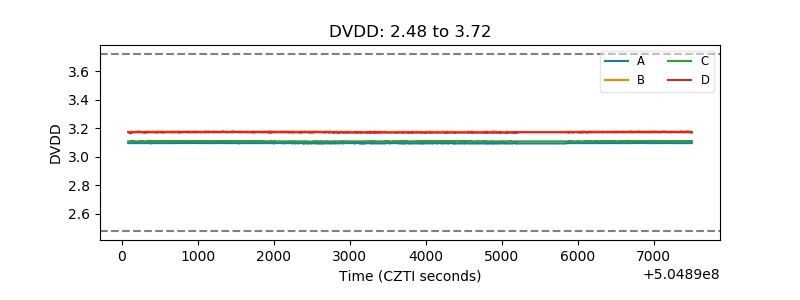 |
| Temperature 1 | 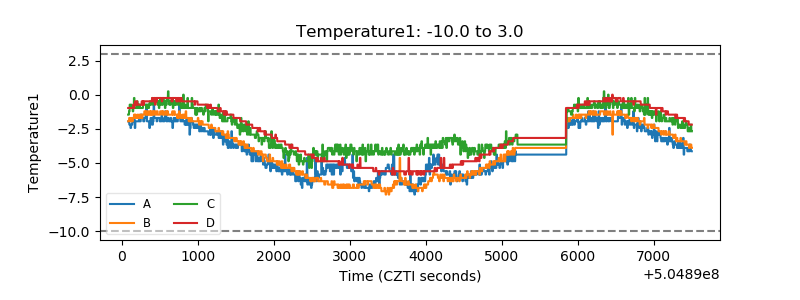 |
| Veto HV Monitor | 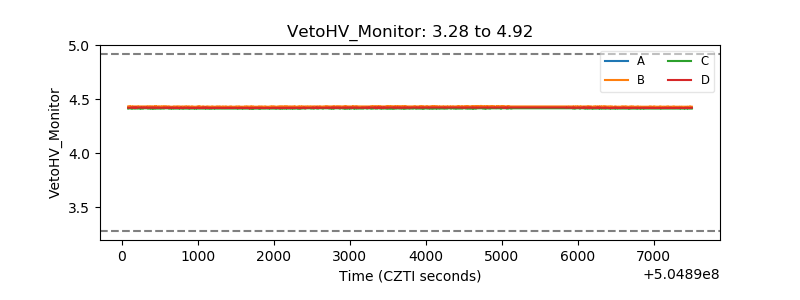 |
| Veto LLD | 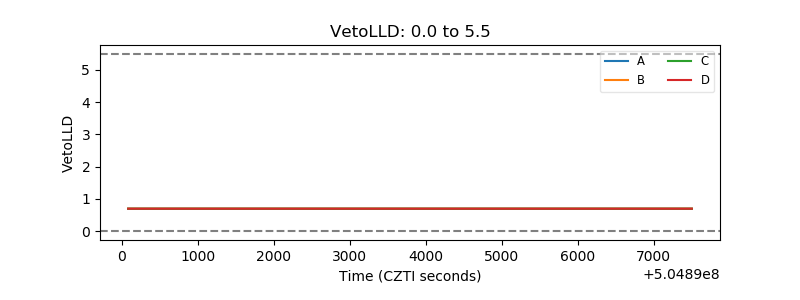 |
| Alpha Counter | 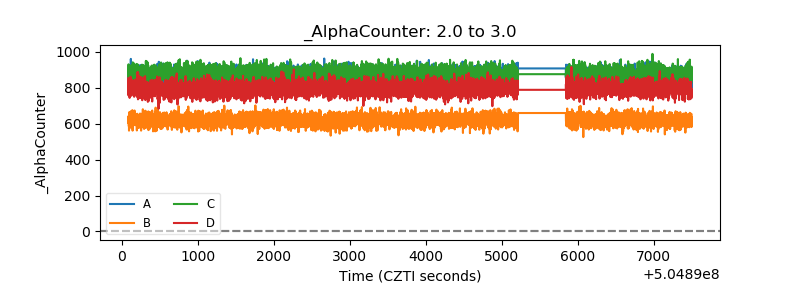 |
| _CPM_Rate | 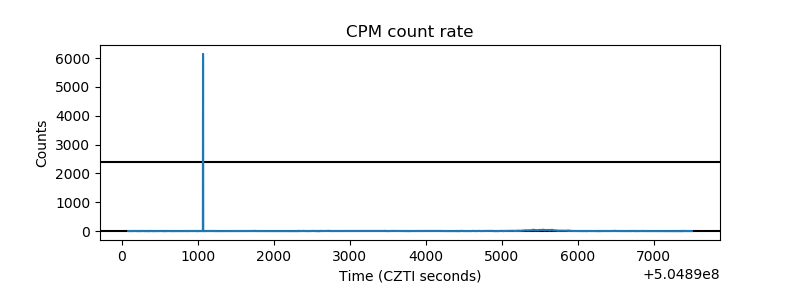 |
| CZT Counter | 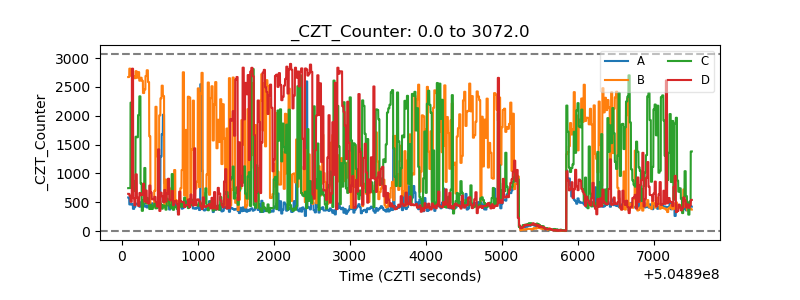 |
| +2.5 Volts monitor |  |
| +5 Volts monitor |  |
| _ROLL_ROT | 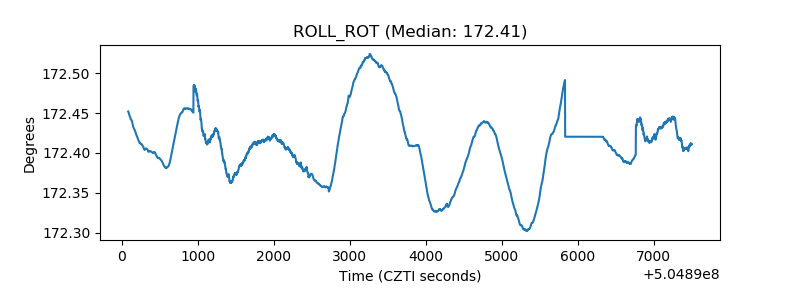 |
| _Roll_DEC | 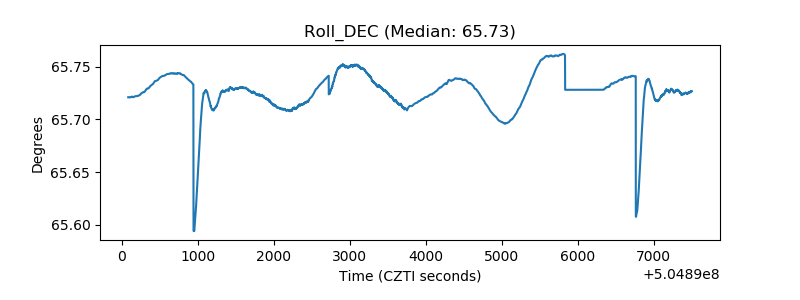 |
| _Roll_RA | 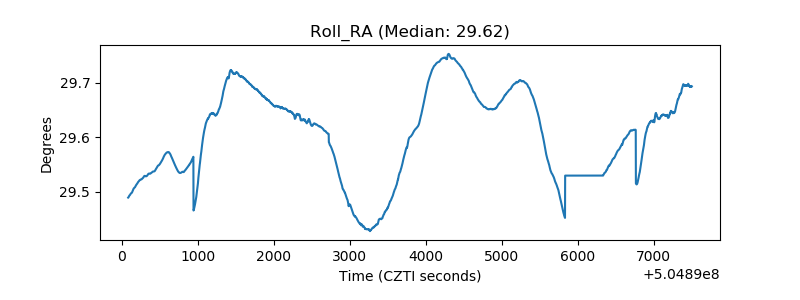 |
| Veto Counter | 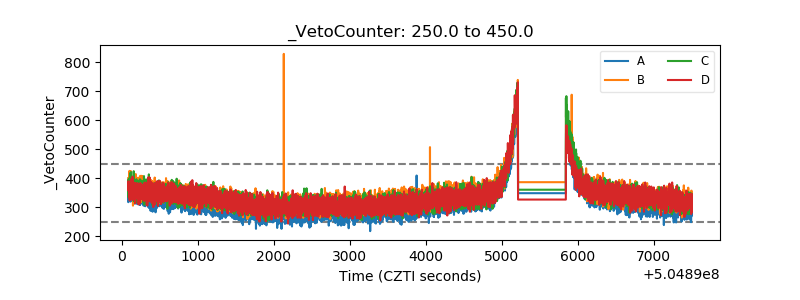 |