| Param | Original file | Final file |
|---|---|---|
| Filename | modeM0/AS1A14_099T01_9000006536_55508cztM0_level2.fits | modeM0/AS1A14_099T01_9000006536_55508cztM0_level2_quad_clean.evt |
| Size (bytes) | 609,474,240 | 100,918,080 |
| Size | 581.2 MB | 96.2 MB |
| Events in quadrant A | 4,374,158 | 659,210 |
| Events in quadrant B | 5,495,083 | 697,529 |
| Events in quadrant C | 4,518,859 | 642,093 |
| Events in quadrant D | 7,602,381 | 544,761 |
| Mode SS | |||
|---|---|---|---|
| Quadrant | BADHDUFLAG | Total packets | Discarded packets |
| A | 0 | 148 | 0 |
| B | 0 | 148 | 0 |
| C | 0 | 148 | 0 |
| D | 0 | 148 | 0 |
| Mode M0 | |||
|---|---|---|---|
| Quadrant | BADHDUFLAG | Total packets | Discarded packets |
| A | 0 | 18611 | 5 |
| B | 0 | 21636 | 0 |
| C | 0 | 18951 | 0 |
| D | 0 | 27716 | 0 |
| Quadrant | Total seconds | Saturated seconds | Saturation percentage |
|---|---|---|---|
| A | 7348 | 426 | 5.797496% |
| B | 7349 | 571 | 7.769765% |
| C | 7349 | 294 | 4.000544% |
| D | 7349 | 1186 | 16.138250% |
Noise dominated data is calculated using 1-second bins in cleaned event files. If a bin has >2000 counts, and if more than 50% of those come from <1% of pixels, then it is considered to be noise-dominated and hence unusable.
| Quadrant | # 1 sec bins | Bins with >0 counts | Bins with >2000 counts | High rate bins dominated by noise | Noise dominated (total time) | Noise dominated (detector-on time) | Marked lightcurve |
|---|---|---|---|---|---|---|---|
| A | 7348 | 7348 | 257 | 257 | 3.50% | 3.50% | 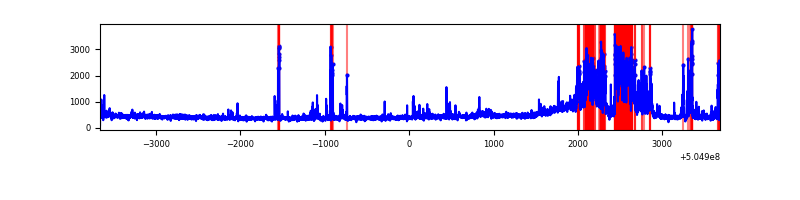 |
| B | 7349 | 7349 | 316 | 316 | 4.30% | 4.30% | 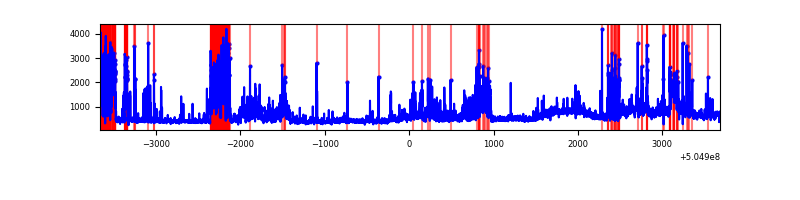 |
| C | 7349 | 7349 | 223 | 223 | 3.03% | 3.03% | 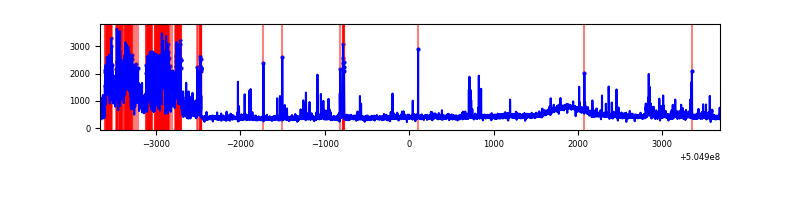 |
| D | 7349 | 7349 | 892 | 892 | 12.14% | 12.14% | 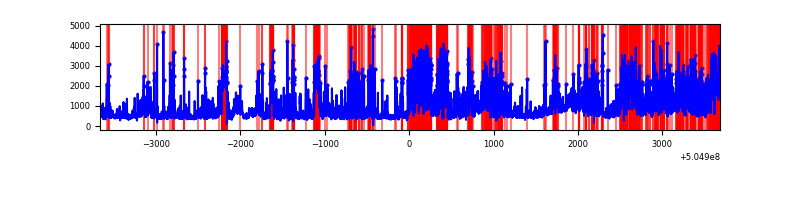 |
Top three noisy pixels from each quadrant. If the there are fewer than three noisy pixels in the level2.evt file, extra rows are filled as -1
| Pixel properties | Quadrant properties | ||||||
|---|---|---|---|---|---|---|---|
| Quadrant | DetID | PixID | Counts | Sigma | Mean | Median | Sigma |
| A | 4 | 159 | 1037658 | 5473.53 | 770 | 750 | 189.4 |
| A | 0 | 31 | 119688 | 627.84 | 770 | 750 | 189.4 |
| A | 3 | 62 | 80468 | 420.81 | 770 | 750 | 189.4 |
| B | 5 | 172 | 2271123 | 13831.77 | 759 | 728 | 164.1 |
| B | 10 | 247 | 105237 | 636.69 | 759 | 728 | 164.1 |
| B | 0 | 171 | 28694 | 170.38 | 759 | 728 | 164.1 |
| C | 9 | 38 | 1026324 | 4896.52 | 764 | 758 | 209.4 |
| C | 13 | 3 | 181366 | 862.31 | 764 | 758 | 209.4 |
| C | 1 | 16 | 111955 | 530.91 | 764 | 758 | 209.4 |
| D | 11 | 129 | 3155320 | 15408.18 | 722 | 691 | 204.7 |
| D | 7 | 70 | 268520 | 1308.16 | 722 | 691 | 204.7 |
| D | 10 | 181 | 255149 | 1242.85 | 722 | 691 | 204.7 |
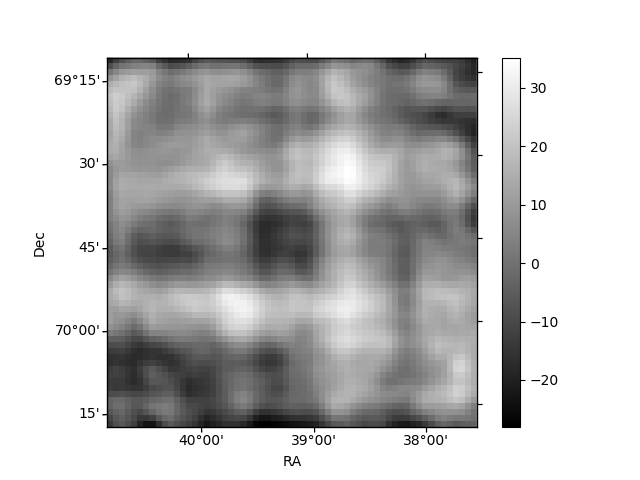
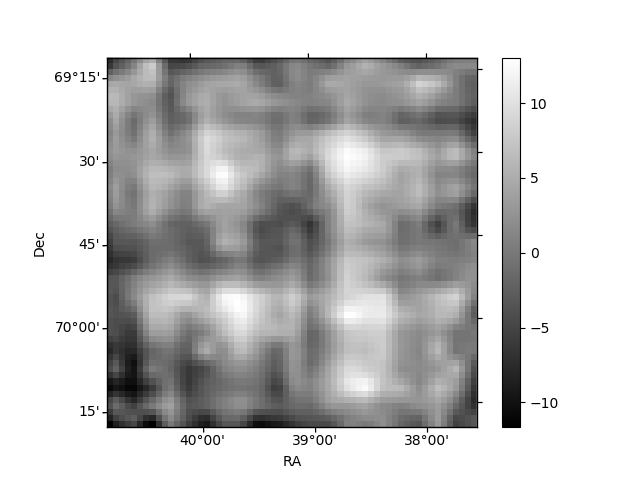
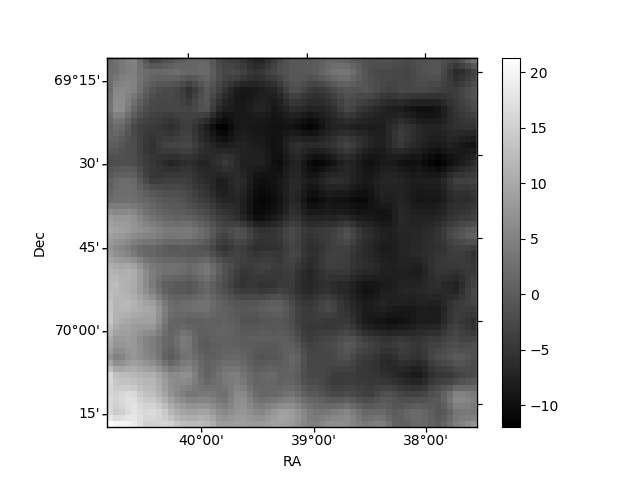
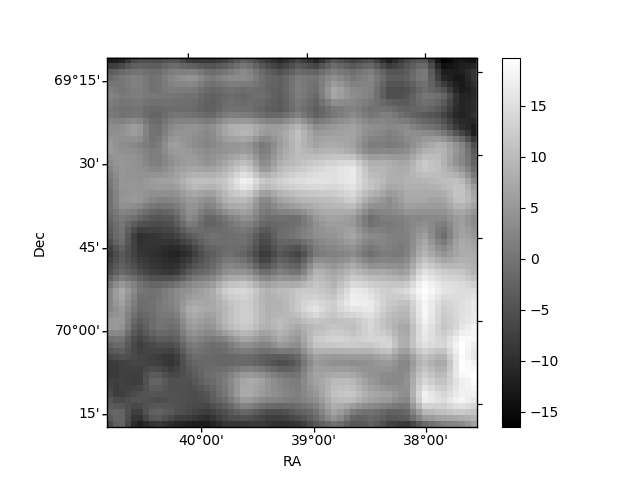
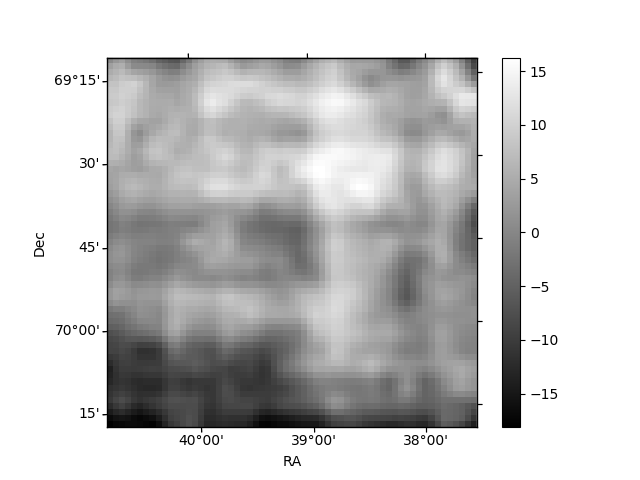
Histogram calculated using DETX and DETY for each event in the final _common_clean file
| Quadrant A | 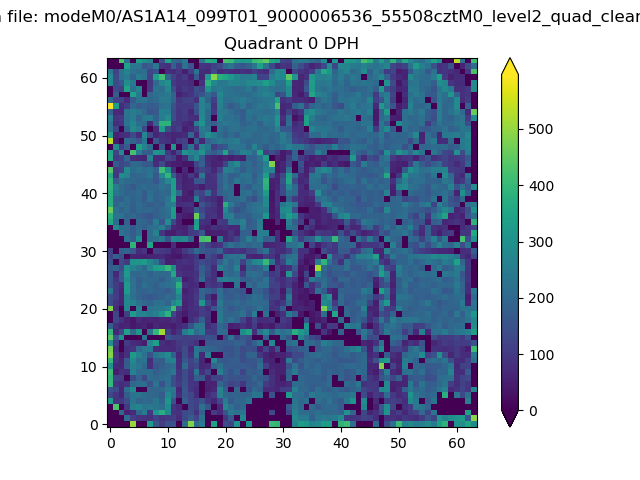 |
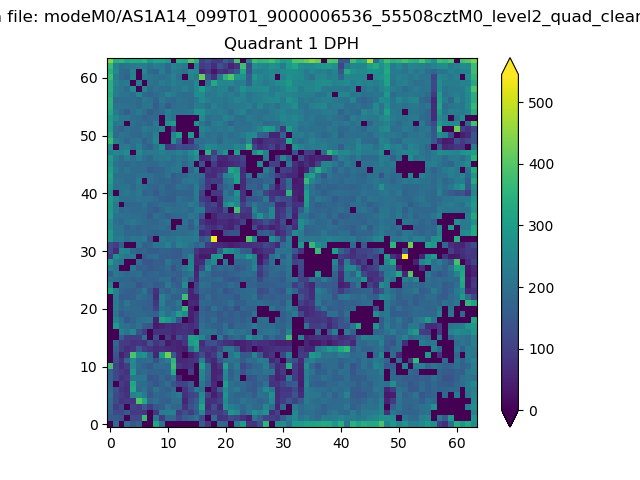 |
Quadrant B |
|---|---|---|---|
| Quadrant D | 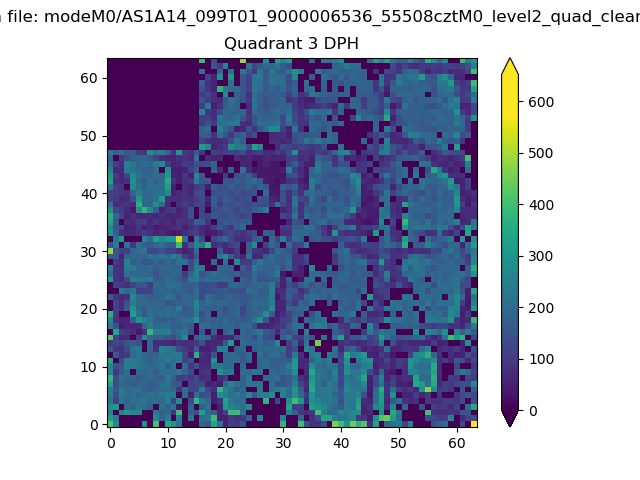 |
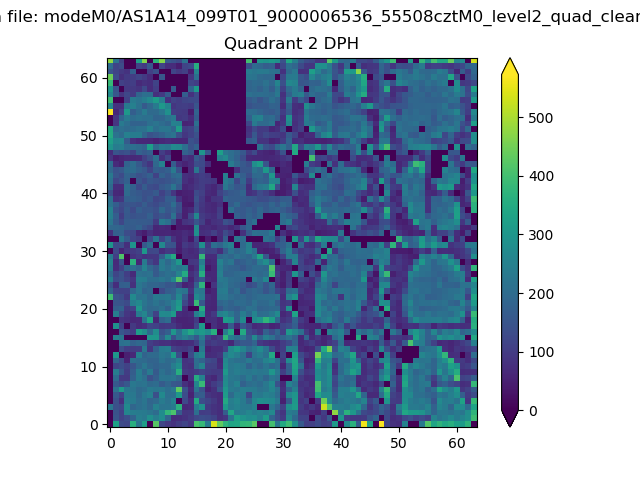 |
Quadrant C |
| Plot type | Count rate plots | Images |
|---|---|---|
| Comparison with Poisson distribution Blue bars denote a histogram of data divided into 1 sec bins. Red curve is a Poisson curve with rate = median count rate of data. |
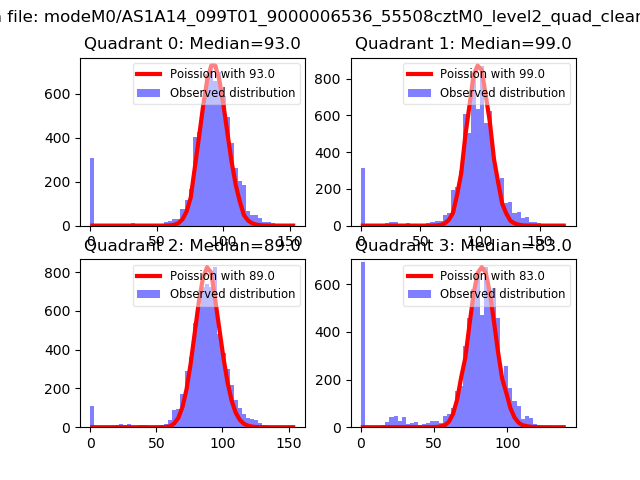 |
 |
| Quadrant-wise count rates Data is divided into 100 sec bins |
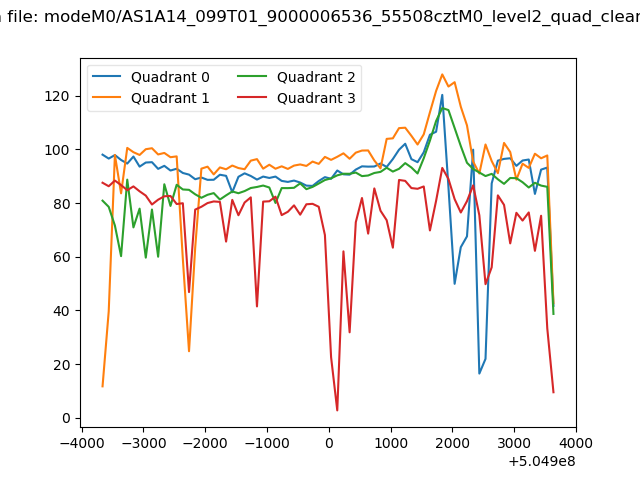 |
|
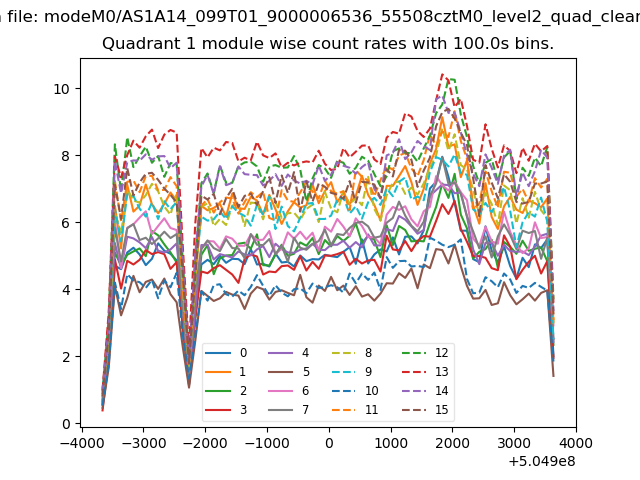
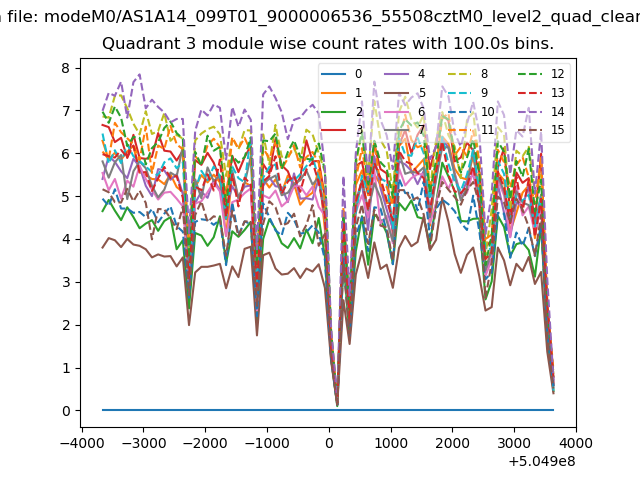
| Module-wise count rates for Quadrant A Data is divided into 100 sec bins |
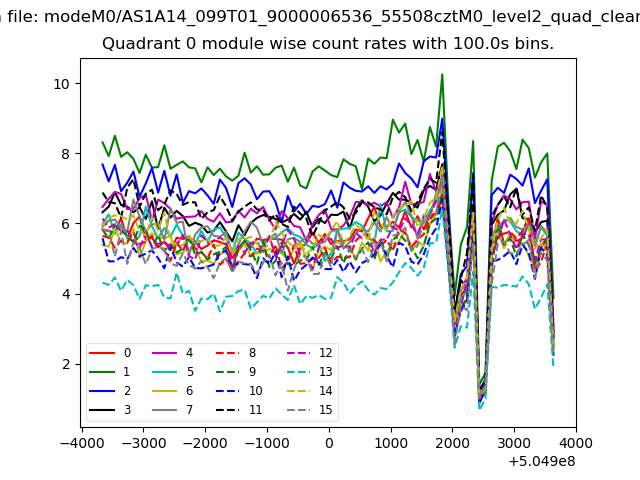 |
 |
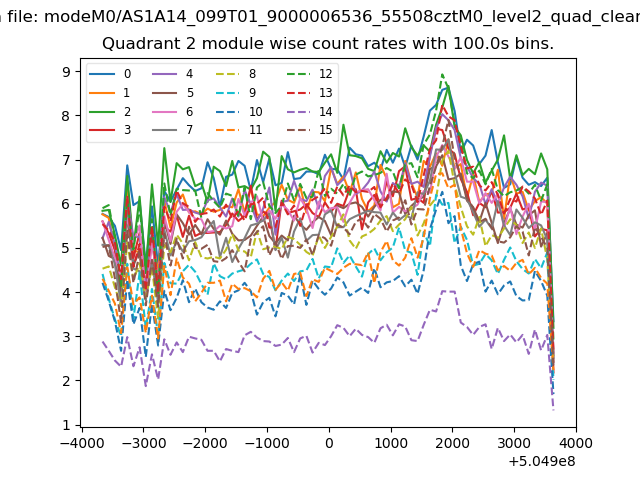
| Module-wise count rates for Quadrant B Data is divided into 100 sec bins |
 |
 |
| Module-wise count rates for Quadrant C Data is divided into 100 sec bins |
 |
 |
| Module-wise count rates for Quadrant D Data is divided into 100 sec bins |
 |
 |
| Parameter | Plot |
|---|---|
| CZT HV Monitor | 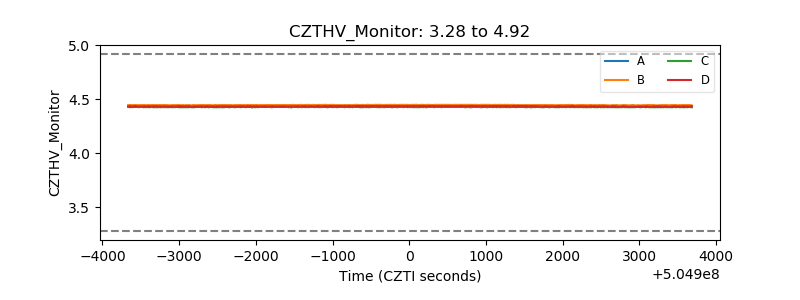 |
| D_VDD | 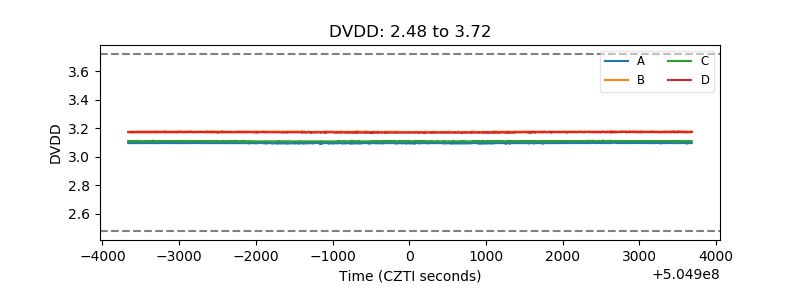 |
| Temperature 1 | 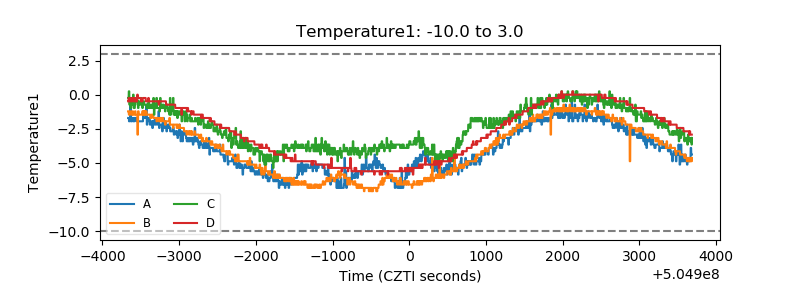 |
| Veto HV Monitor | 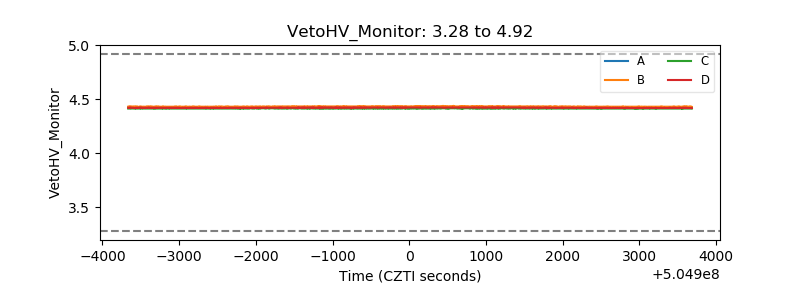 |
| Veto LLD | 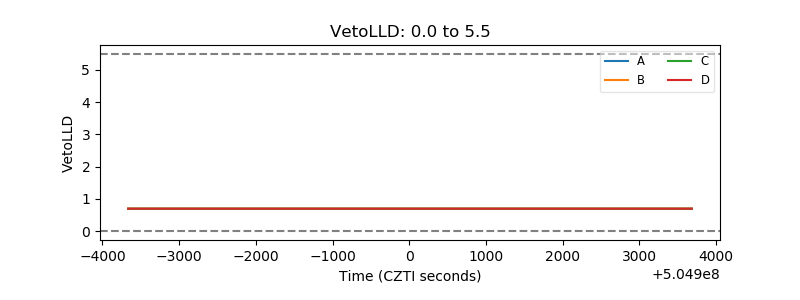 |
| Alpha Counter | 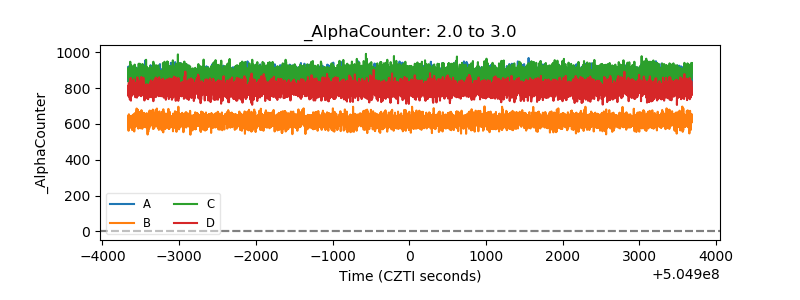 |
| _CPM_Rate | 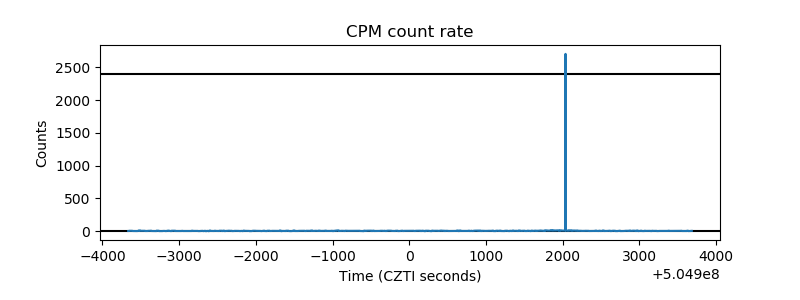 |
| CZT Counter | 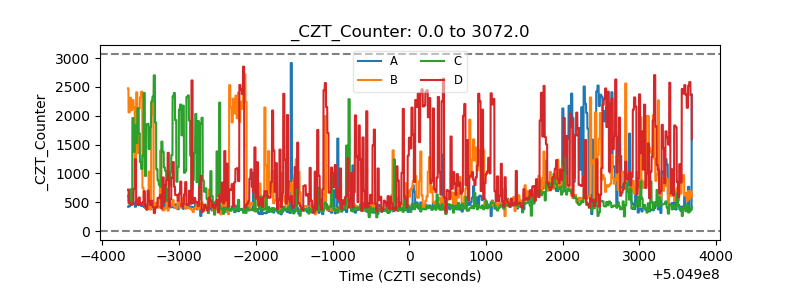 |
| +2.5 Volts monitor | 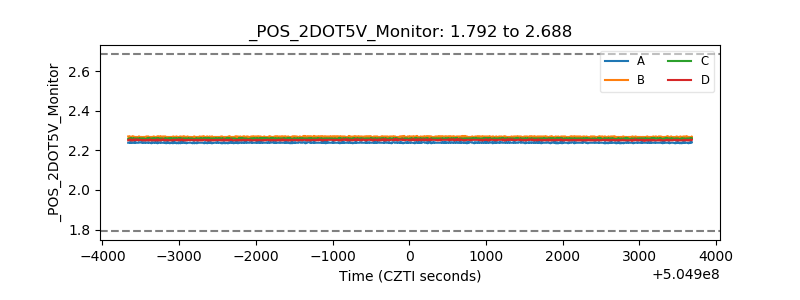 |
| +5 Volts monitor | 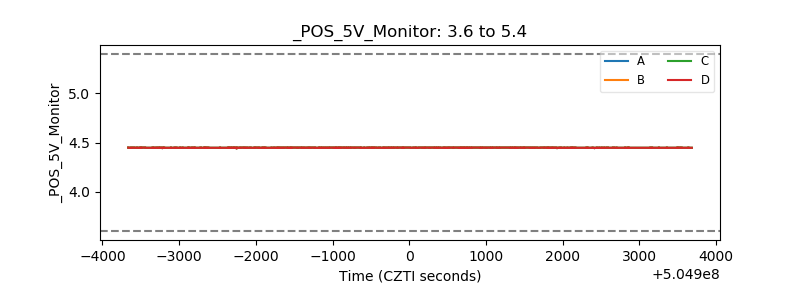 |
| _ROLL_ROT | 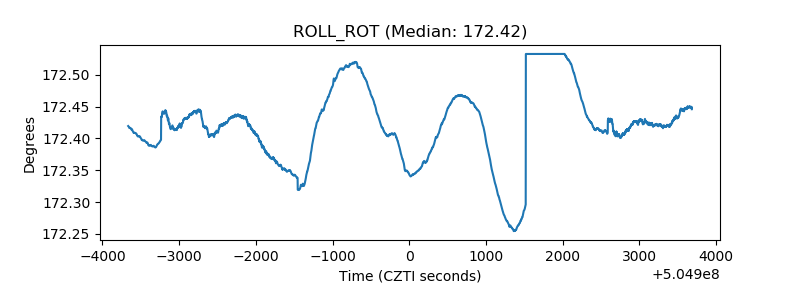 |
| _Roll_DEC | 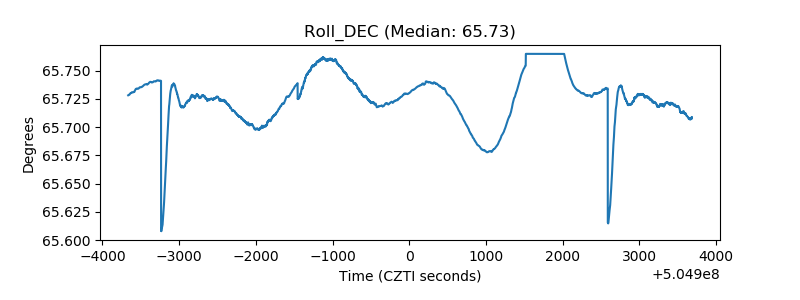 |
| _Roll_RA | 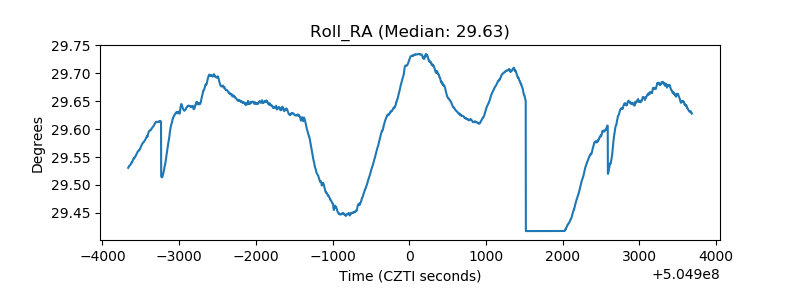 |
| Veto Counter | 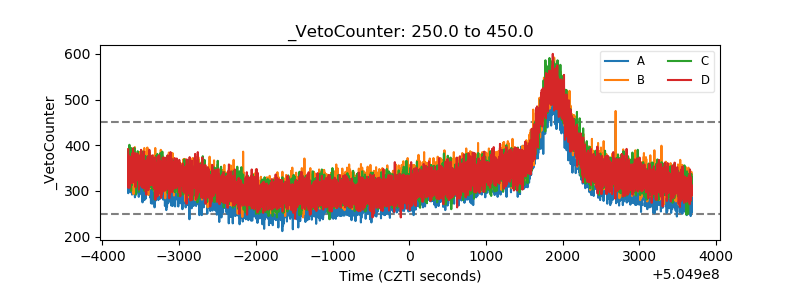 |