| Param | Original file | Final file |
|---|---|---|
| Filename | modeM0/AS1A14_099T01_9000006536_55513cztM0_level2.fits | modeM0/AS1A14_099T01_9000006536_55513cztM0_level2_quad_clean.evt |
| Size (bytes) | 2,263,415,040 | 217,851,840 |
| Size | 2.1 GB | 207.8 MB |
| Events in quadrant A | 14,852,508 | 1,549,941 |
| Events in quadrant B | 31,886,600 | 969,755 |
| Events in quadrant C | 17,811,587 | 1,380,806 |
| Events in quadrant D | 17,732,023 | 1,353,260 |
| Mode M9 | |||
|---|---|---|---|
| Quadrant | BADHDUFLAG | Total packets | Discarded packets |
| A | 0 | 13 | 0 |
| B | 0 | 13 | 0 |
| C | 0 | 13 | 0 |
| D | 0 | 13 | 0 |
| Mode SS | |||
|---|---|---|---|
| Quadrant | BADHDUFLAG | Total packets | Discarded packets |
| A | 0 | 398 | 0 |
| B | 0 | 398 | 0 |
| C | 0 | 398 | 0 |
| D | 0 | 398 | 0 |
| Mode M0 | |||
|---|---|---|---|
| Quadrant | BADHDUFLAG | Total packets | Discarded packets |
| A | 0 | 58151 | 4 |
| B | 0 | 108335 | 4 |
| C | 0 | 66892 | 4 |
| D | 0 | 66524 | 4 |
| Quadrant | Total seconds | Saturated seconds | Saturation percentage |
|---|---|---|---|
| A | 19463 | 2073 | 10.650979% |
| B | 19463 | 9815 | 50.429019% |
| C | 19463 | 3419 | 17.566665% |
| D | 19463 | 2384 | 12.248882% |
Noise dominated data is calculated using 1-second bins in cleaned event files. If a bin has >2000 counts, and if more than 50% of those come from <1% of pixels, then it is considered to be noise-dominated and hence unusable.
| Quadrant | # 1 sec bins | Bins with >0 counts | Bins with >2000 counts | High rate bins dominated by noise | Noise dominated (total time) | Noise dominated (detector-on time) | Marked lightcurve |
|---|---|---|---|---|---|---|---|
| A | 20823 | 19469 | 1572 | 1572 | 7.55% | 8.07% | 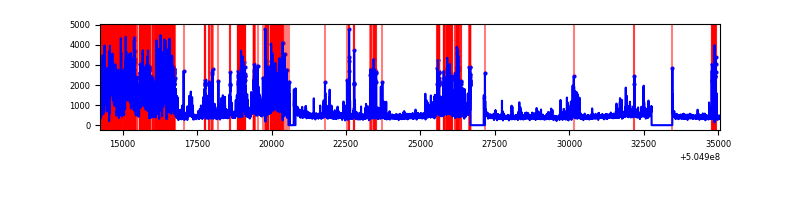 |
| B | 20823 | 19465 | 7710 | 7710 | 37.03% | 39.61% | 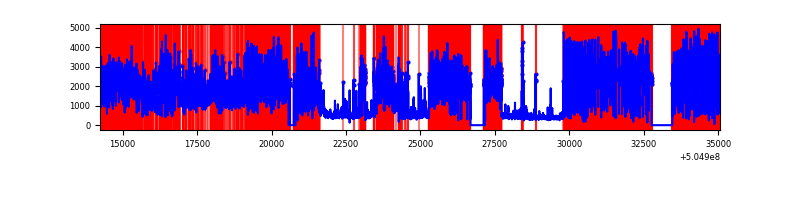 |
| C | 20823 | 19469 | 2704 | 2704 | 12.99% | 13.89% | 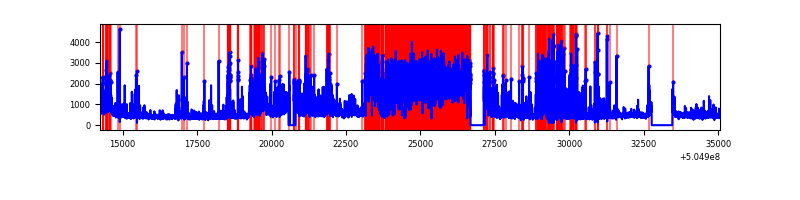 |
| D | 20823 | 19469 | 1955 | 1955 | 9.39% | 10.04% | 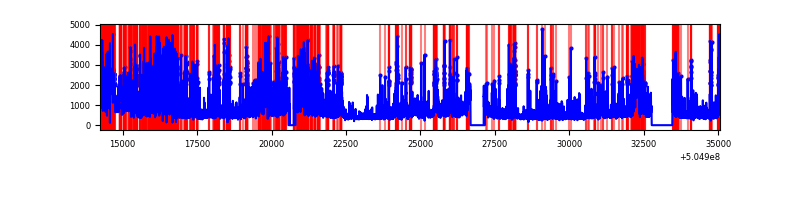 |
Top three noisy pixels from each quadrant. If the there are fewer than three noisy pixels in the level2.evt file, extra rows are filled as -1
| Pixel properties | Quadrant properties | ||||||
|---|---|---|---|---|---|---|---|
| Quadrant | DetID | PixID | Counts | Sigma | Mean | Median | Sigma |
| A | 4 | 159 | 6109601 | 12633.13 | 1956 | 1904 | 483.5 |
| A | 3 | 14 | 497105 | 1024.27 | 1956 | 1904 | 483.5 |
| A | 0 | 8 | 392264 | 807.42 | 1956 | 1904 | 483.5 |
| B | 5 | 172 | 24810798 | 78783.94 | 1474 | 1422 | 314.9 |
| B | 5 | 236 | 751722 | 2382.63 | 1474 | 1422 | 314.9 |
| B | 7 | 252 | 142044 | 446.56 | 1474 | 1422 | 314.9 |
| C | 9 | 38 | 9010248 | 17882.81 | 1856 | 1837 | 503.7 |
| C | 13 | 3 | 480376 | 949.96 | 1856 | 1837 | 503.7 |
| C | 15 | 147 | 373408 | 737.61 | 1856 | 1837 | 503.7 |
| D | 11 | 129 | 7610274 | 14272.34 | 1880 | 1797 | 533.1 |
| D | 2 | 153 | 729536 | 1365.13 | 1880 | 1797 | 533.1 |
| D | 7 | 70 | 536588 | 1003.19 | 1880 | 1797 | 533.1 |
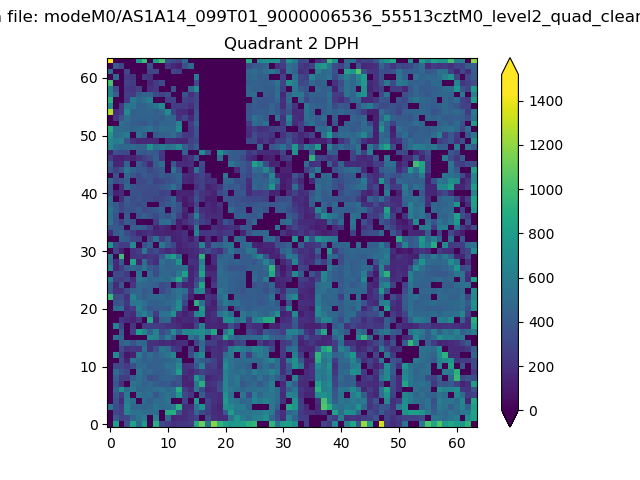
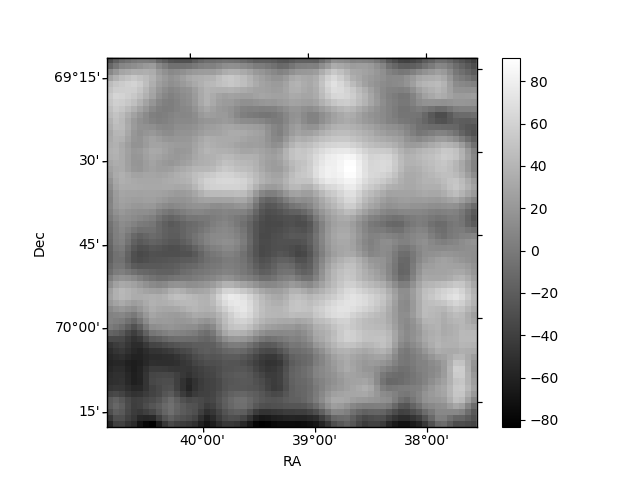
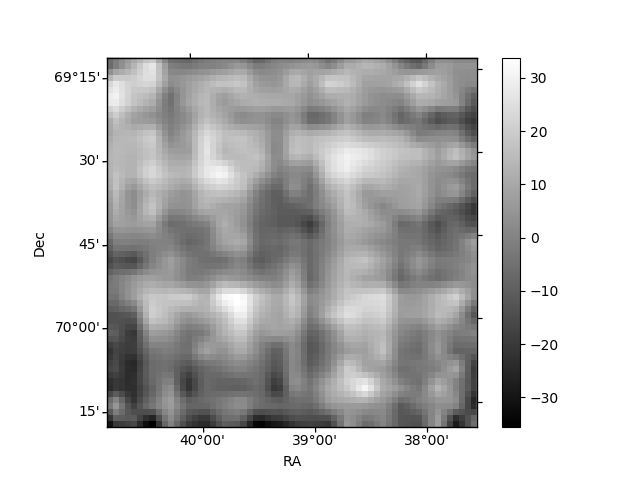
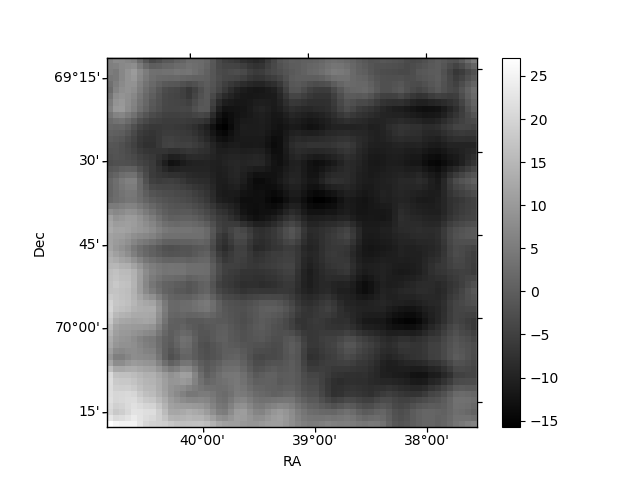
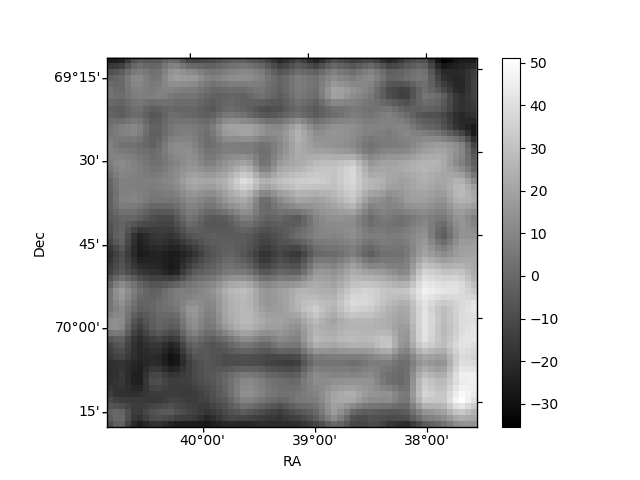
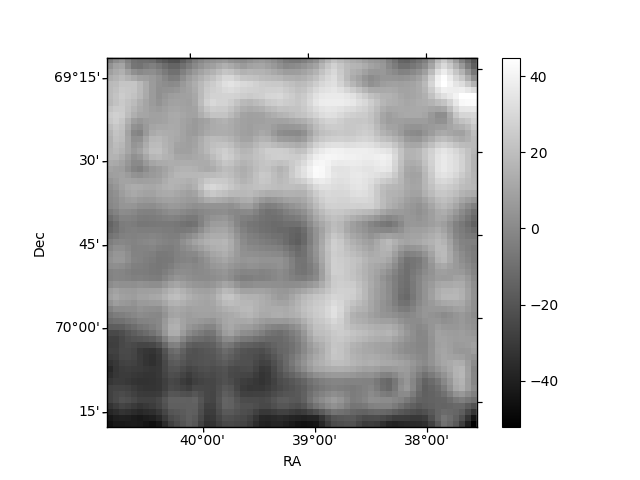
Histogram calculated using DETX and DETY for each event in the final _common_clean file
| Quadrant A | 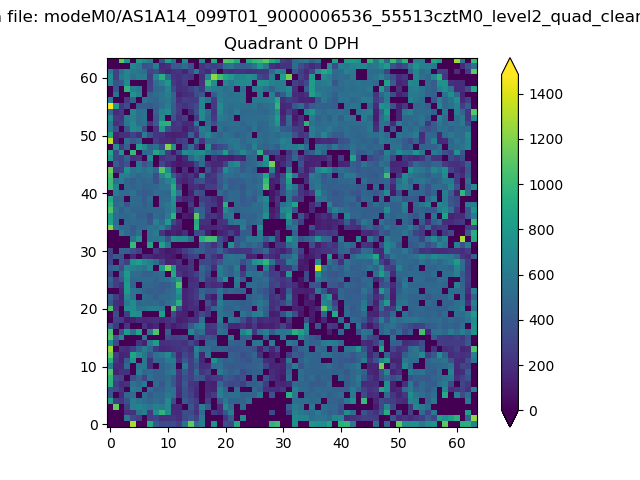 |
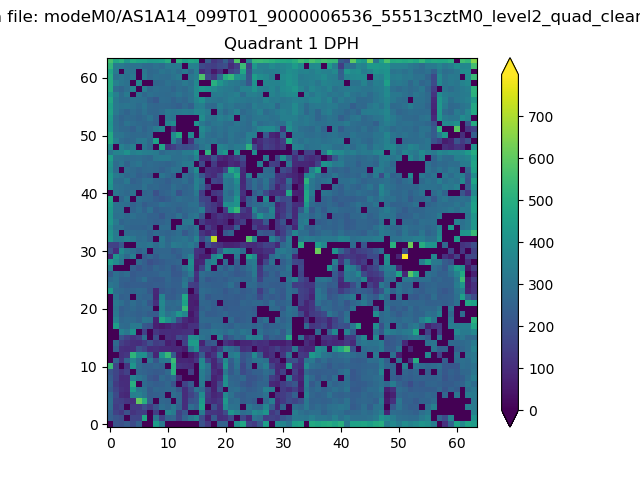 |
Quadrant B |
|---|---|---|---|
| Quadrant D | 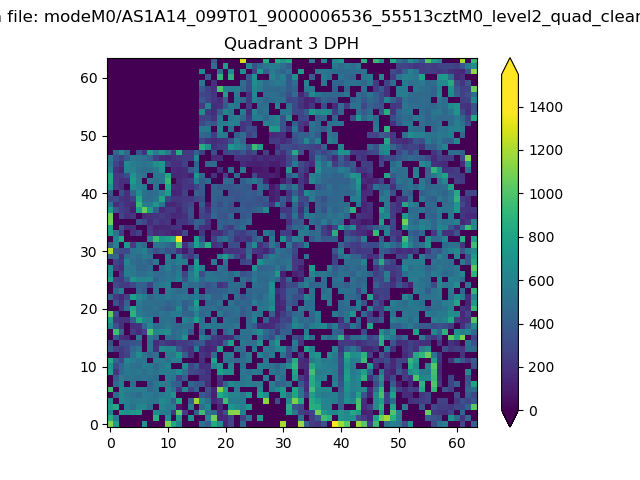 |
 |
Quadrant C |
| Plot type | Count rate plots | Images |
|---|---|---|
| Comparison with Poisson distribution Blue bars denote a histogram of data divided into 1 sec bins. Red curve is a Poisson curve with rate = median count rate of data. |
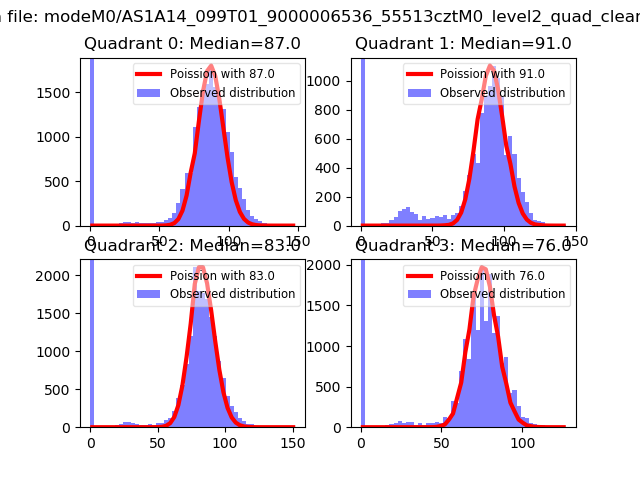 |
 |
| Quadrant-wise count rates Data is divided into 100 sec bins |
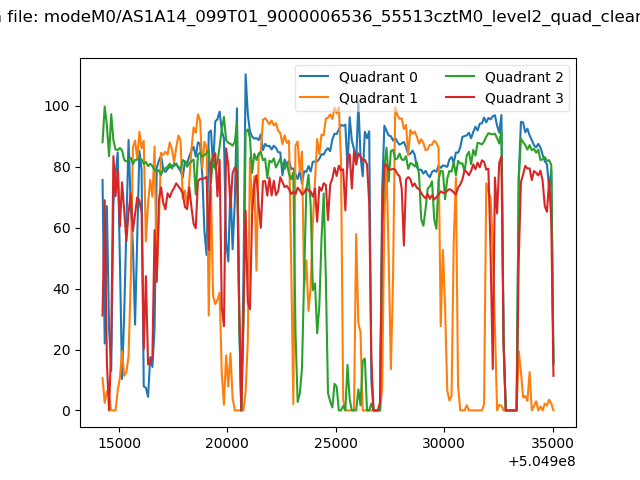 |
|
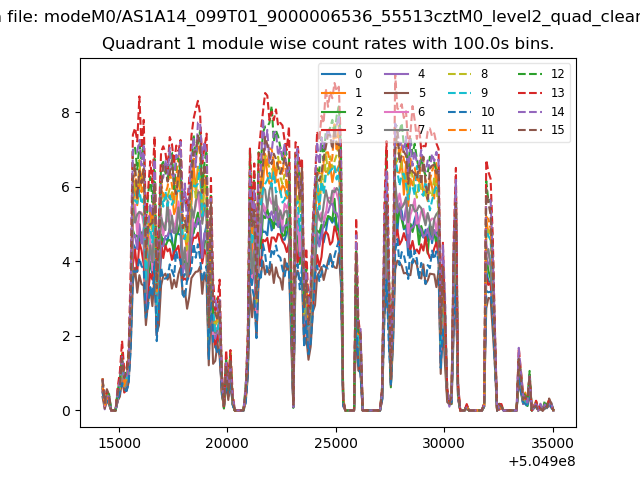
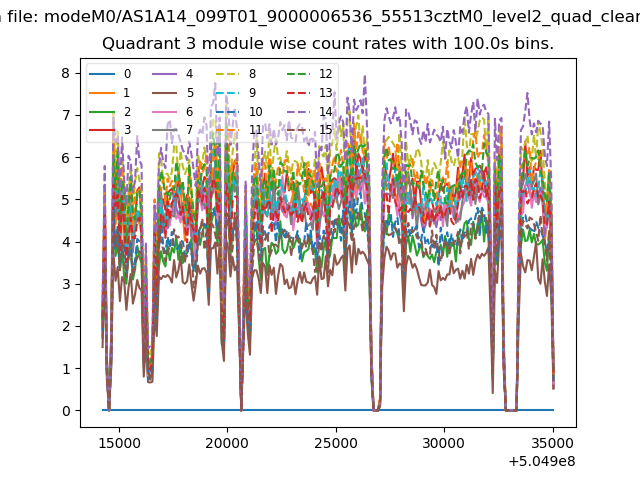
| Module-wise count rates for Quadrant A Data is divided into 100 sec bins |
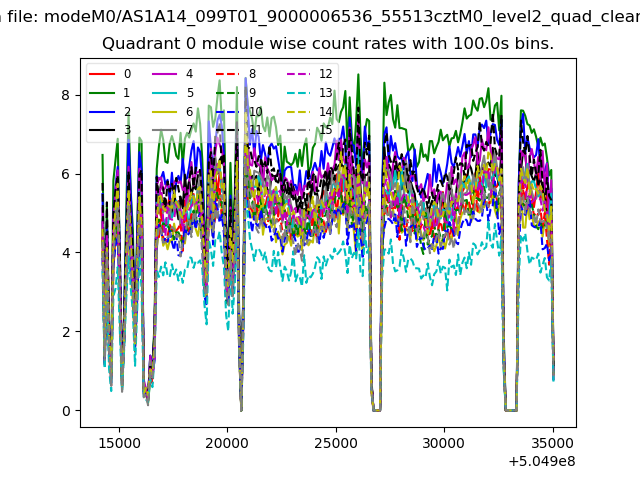 |
 |
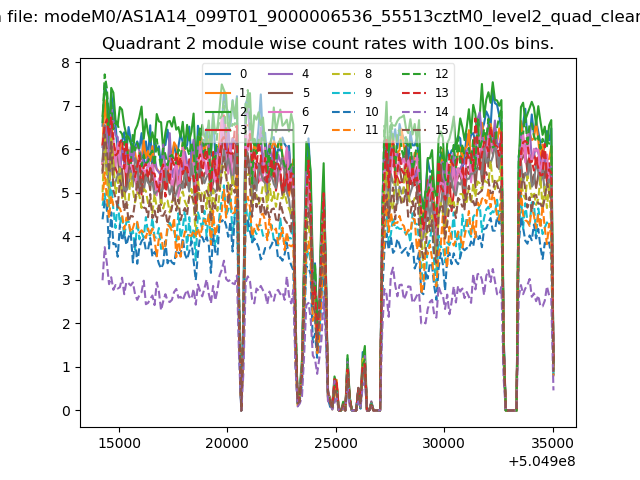
| Module-wise count rates for Quadrant B Data is divided into 100 sec bins |
 |
 |
| Module-wise count rates for Quadrant C Data is divided into 100 sec bins |
 |
 |
| Module-wise count rates for Quadrant D Data is divided into 100 sec bins |
 |
 |
| Parameter | Plot |
|---|---|
| CZT HV Monitor | 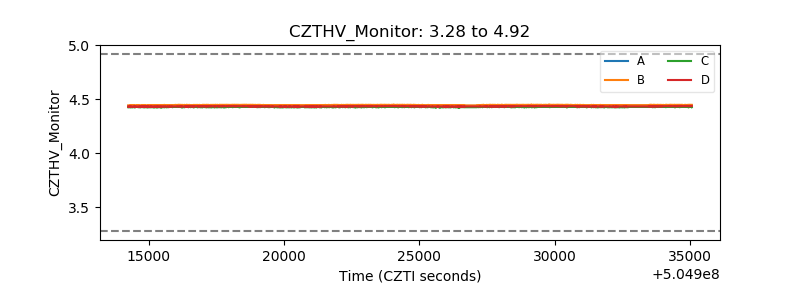 |
| D_VDD | 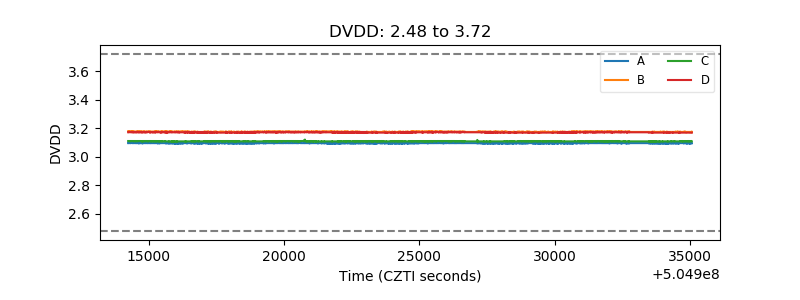 |
| Temperature 1 | 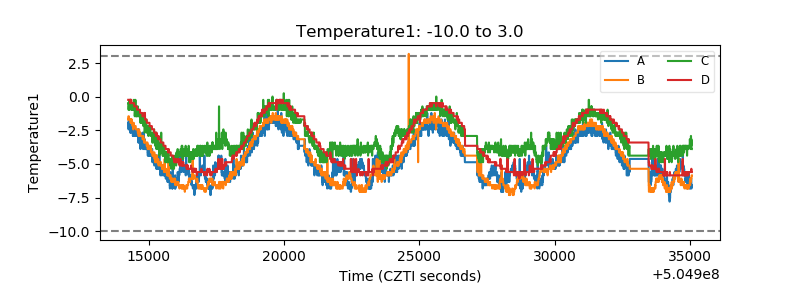 |
| Veto HV Monitor | 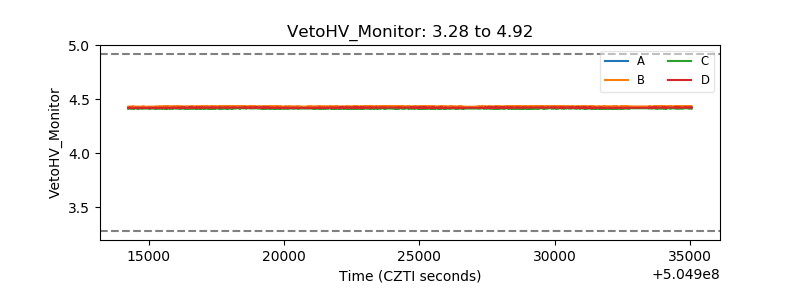 |
| Veto LLD | 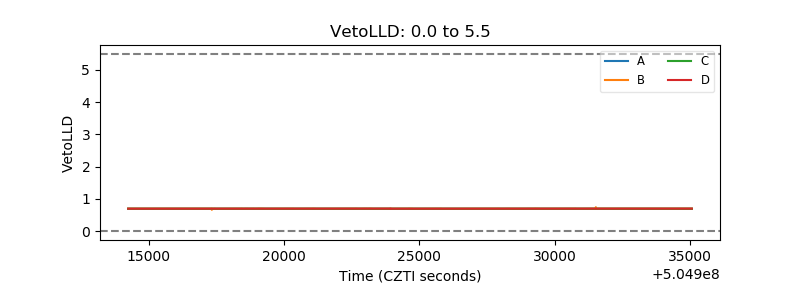 |
| Alpha Counter | 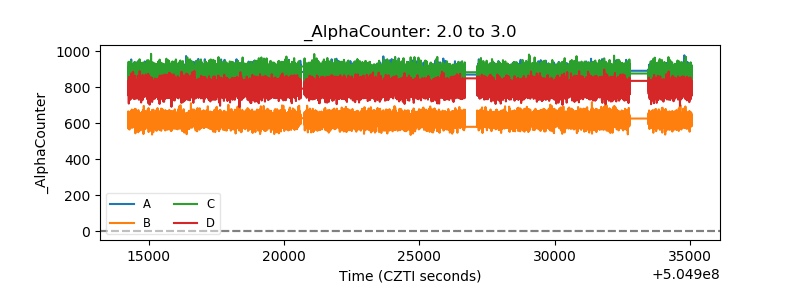 |
| _CPM_Rate | 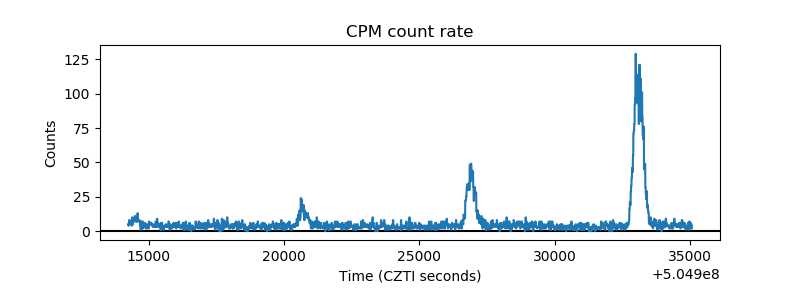 |
| CZT Counter | 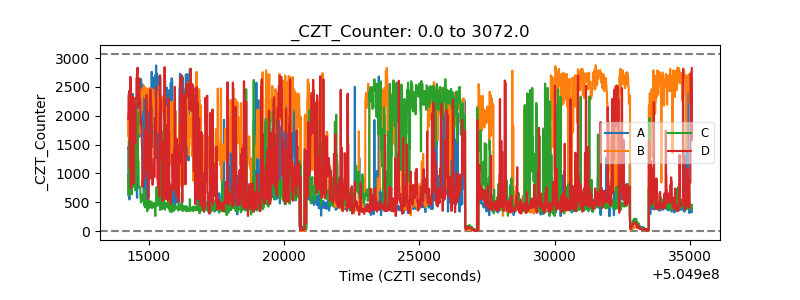 |
| +2.5 Volts monitor | 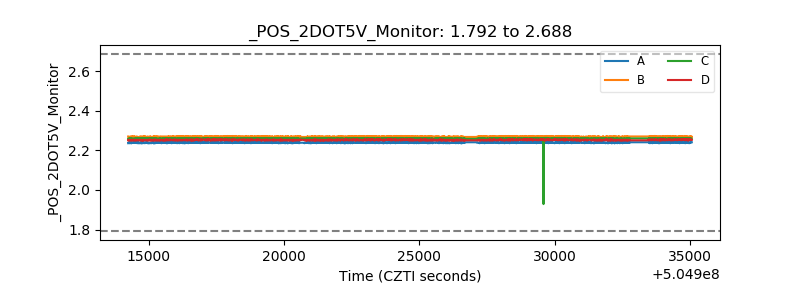 |
| +5 Volts monitor | 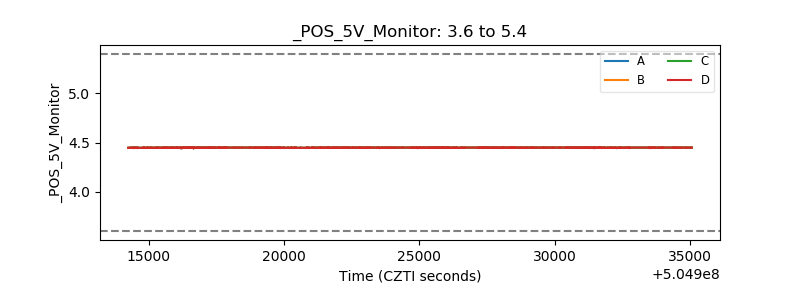 |
| _ROLL_ROT | 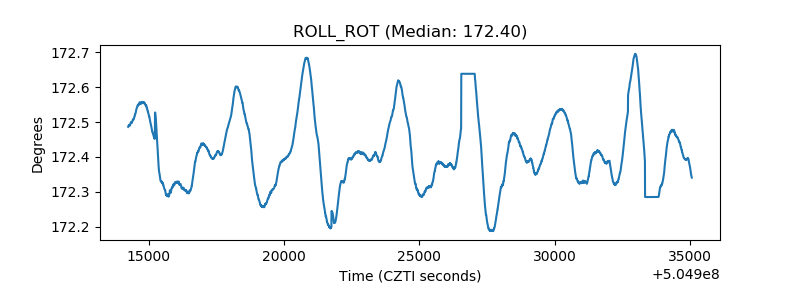 |
| _Roll_DEC | 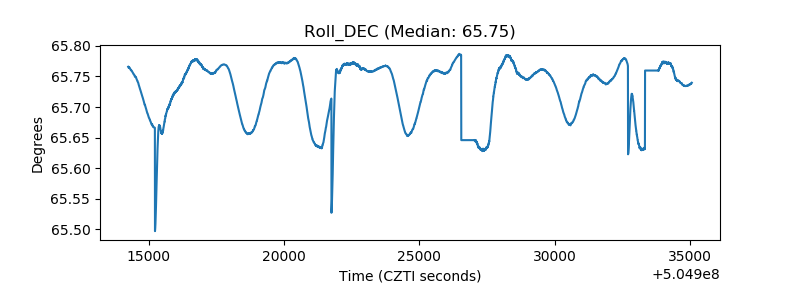 |
| _Roll_RA | 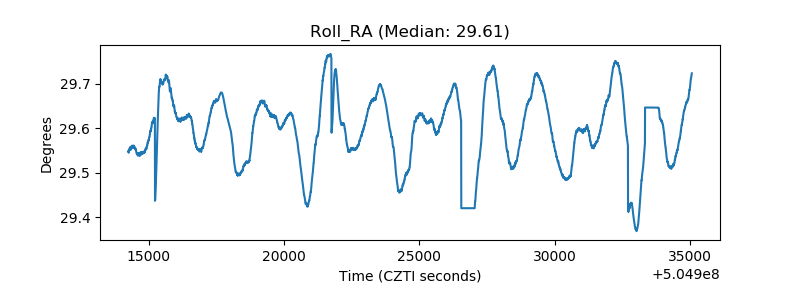 |
| Veto Counter | 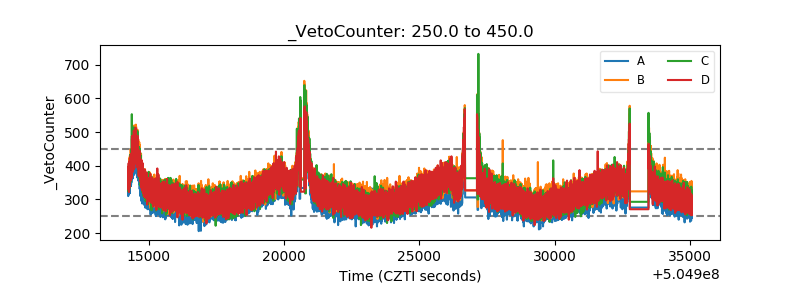 |