| Param | Original file | Final file |
|---|---|---|
| Filename | modeM0/AS1A14_099T01_9000006536_55516cztM0_level2.fits | modeM0/AS1A14_099T01_9000006536_55516cztM0_level2_quad_clean.evt |
| Size (bytes) | 543,317,760 | 90,169,920 |
| Size | 518.1 MB | 86.0 MB |
| Events in quadrant A | 2,929,932 | 625,485 |
| Events in quadrant B | 9,411,363 | 492,519 |
| Events in quadrant C | 3,299,179 | 592,920 |
| Events in quadrant D | 3,951,942 | 553,211 |
| Mode M9 | |||
|---|---|---|---|
| Quadrant | BADHDUFLAG | Total packets | Discarded packets |
| A | 0 | 13 | 0 |
| B | 0 | 14 | 0 |
| C | 0 | 14 | 0 |
| D | 0 | 14 | 0 |
| Mode SS | |||
|---|---|---|---|
| Quadrant | BADHDUFLAG | Total packets | Discarded packets |
| A | 0 | 136 | 0 |
| B | 0 | 136 | 0 |
| C | 0 | 136 | 0 |
| D | 0 | 136 | 0 |
| Mode M0 | |||
|---|---|---|---|
| Quadrant | BADHDUFLAG | Total packets | Discarded packets |
| A | 0 | 13849 | 2 |
| B | 0 | 32593 | 2 |
| C | 0 | 14853 | 2 |
| D | 0 | 16556 | 2 |
| Quadrant | Total seconds | Saturated seconds | Saturation percentage |
|---|---|---|---|
| A | 6684 | 59 | 0.882705% |
| B | 6684 | 2019 | 30.206463% |
| C | 6684 | 126 | 1.885099% |
| D | 6684 | 234 | 3.500898% |
Noise dominated data is calculated using 1-second bins in cleaned event files. If a bin has >2000 counts, and if more than 50% of those come from <1% of pixels, then it is considered to be noise-dominated and hence unusable.
| Quadrant | # 1 sec bins | Bins with >0 counts | Bins with >2000 counts | High rate bins dominated by noise | Noise dominated (total time) | Noise dominated (detector-on time) | Marked lightcurve |
|---|---|---|---|---|---|---|---|
| A | 7694 | 6685 | 11 | 11 | 0.14% | 0.16% | 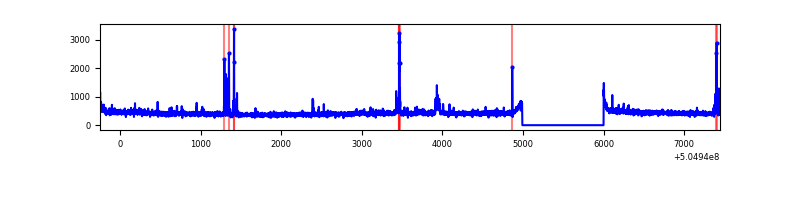 |
| B | 7694 | 6685 | 1609 | 1609 | 20.91% | 24.07% | 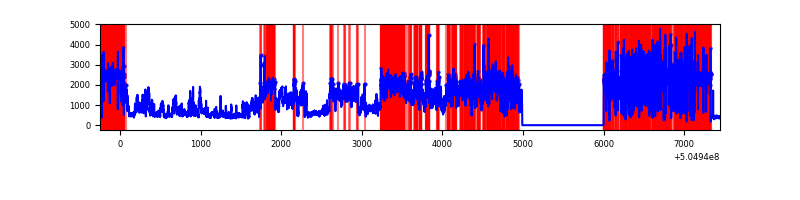 |
| C | 7694 | 6685 | 79 | 79 | 1.03% | 1.18% | 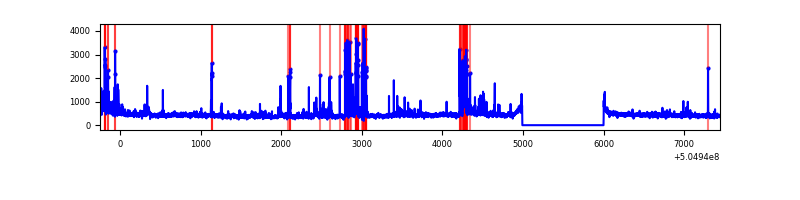 |
| D | 7694 | 6685 | 179 | 179 | 2.33% | 2.68% | 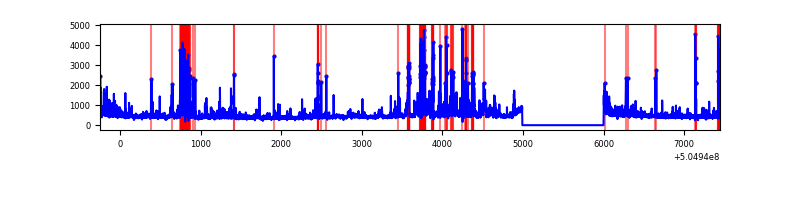 |
Top three noisy pixels from each quadrant. If the there are fewer than three noisy pixels in the level2.evt file, extra rows are filled as -1
| Pixel properties | Quadrant properties | ||||||
|---|---|---|---|---|---|---|---|
| Quadrant | DetID | PixID | Counts | Sigma | Mean | Median | Sigma |
| A | 0 | 8 | 106821 | 604.54 | 706 | 687 | 175.6 |
| A | 4 | 159 | 37453 | 209.42 | 706 | 687 | 175.6 |
| A | 13 | 254 | 12580 | 67.74 | 706 | 687 | 175.6 |
| B | 5 | 172 | 6997790 | 55326.61 | 589 | 567 | 126.5 |
| B | 10 | 247 | 32337 | 251.2 | 589 | 567 | 126.5 |
| B | 12 | 111 | 15502 | 118.09 | 589 | 567 | 126.5 |
| C | 15 | 147 | 268098 | 1425.1 | 681 | 675 | 187.7 |
| C | 9 | 38 | 91447 | 483.73 | 681 | 675 | 187.7 |
| C | 15 | 178 | 89864 | 475.29 | 681 | 675 | 187.7 |
| D | 2 | 153 | 434123 | 2299.82 | 670 | 640 | 188.5 |
| D | 11 | 129 | 296822 | 1571.38 | 670 | 640 | 188.5 |
| D | 10 | 181 | 271734 | 1438.27 | 670 | 640 | 188.5 |
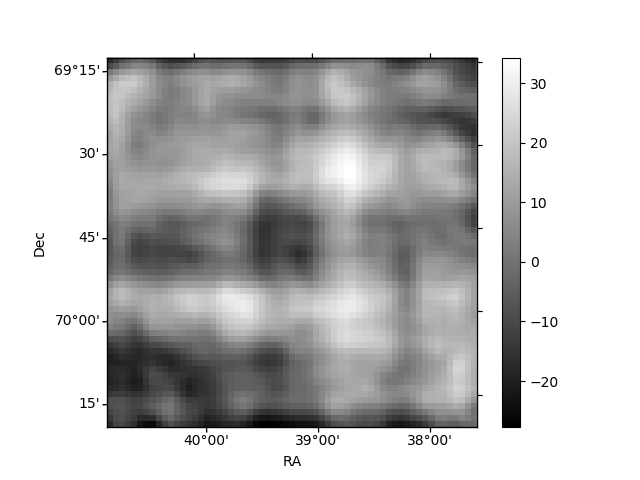
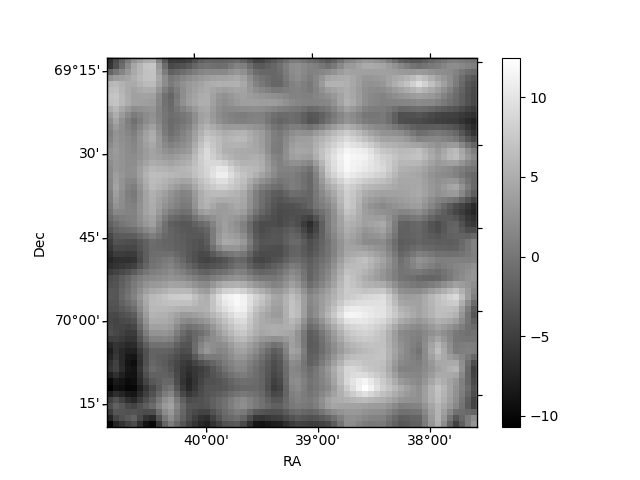
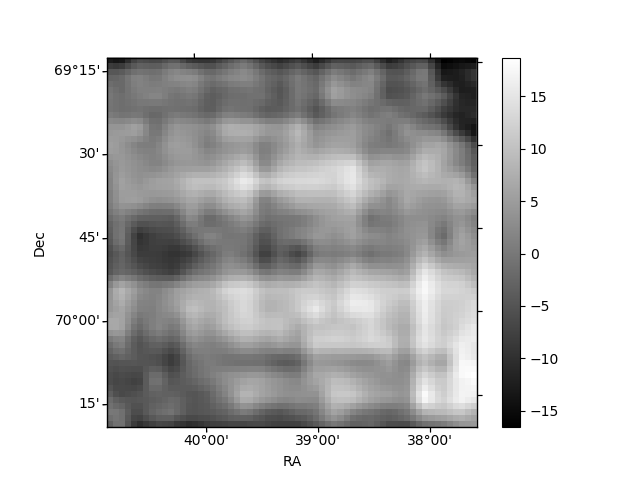
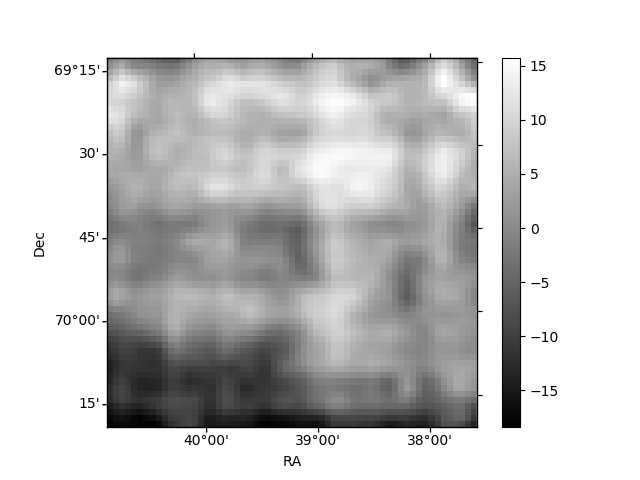
Histogram calculated using DETX and DETY for each event in the final _common_clean file
| Quadrant A | 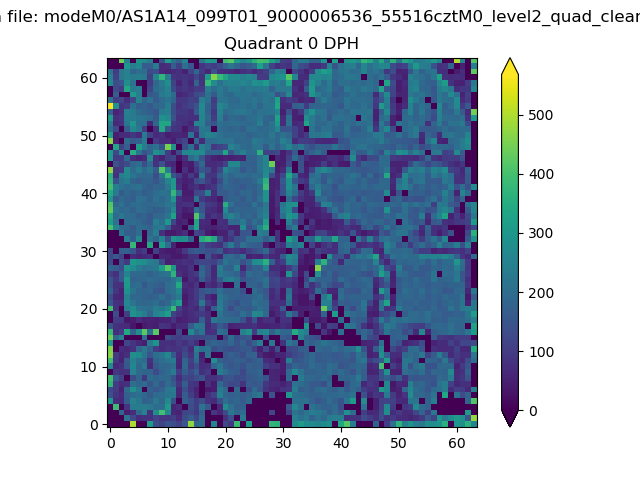 |
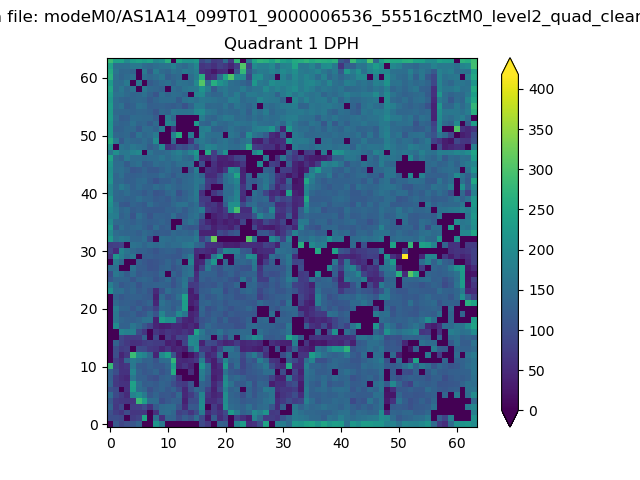 |
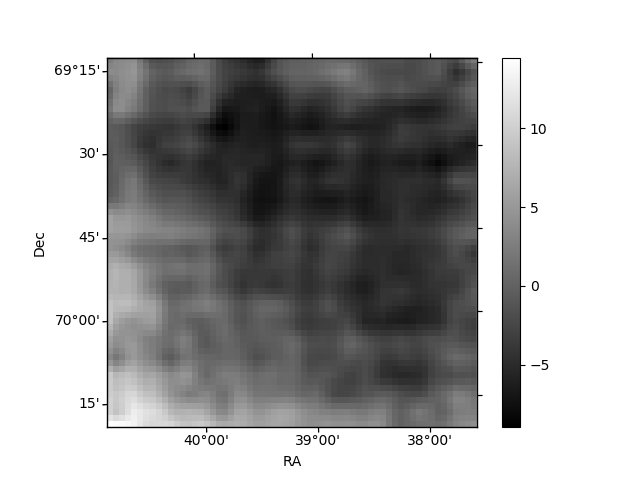
Quadrant B |
|---|---|---|---|
| Quadrant D | 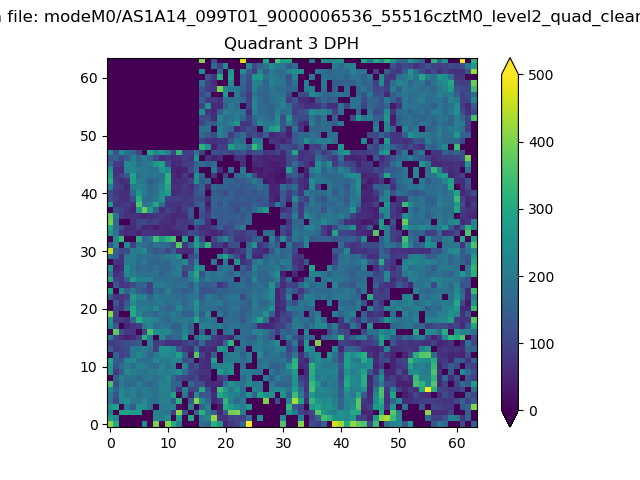 |
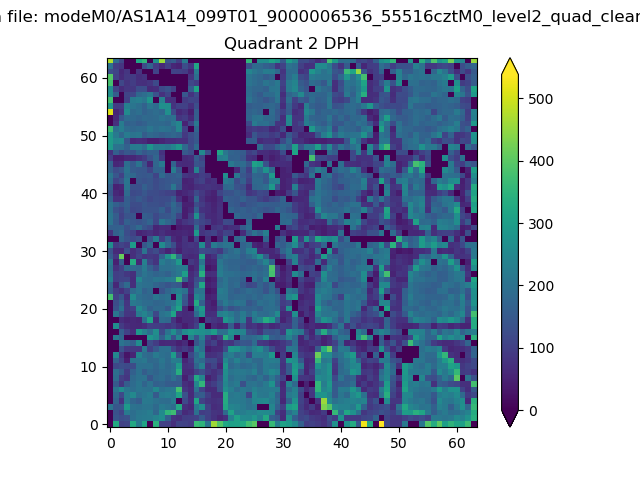 |
Quadrant C |
| Plot type | Count rate plots | Images |
|---|---|---|
| Comparison with Poisson distribution Blue bars denote a histogram of data divided into 1 sec bins. Red curve is a Poisson curve with rate = median count rate of data. |
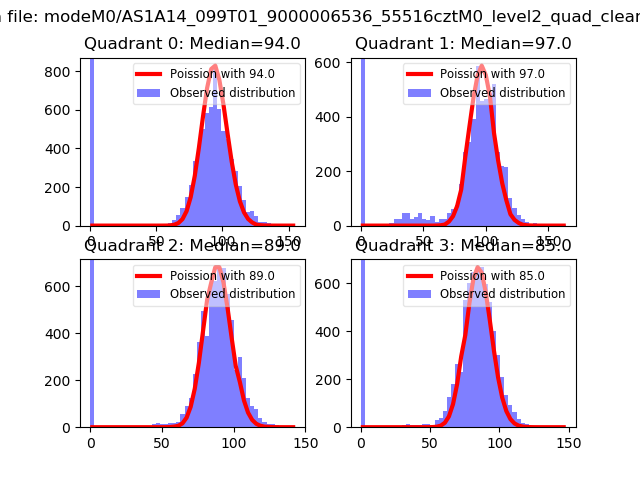 |
 |
| Quadrant-wise count rates Data is divided into 100 sec bins |
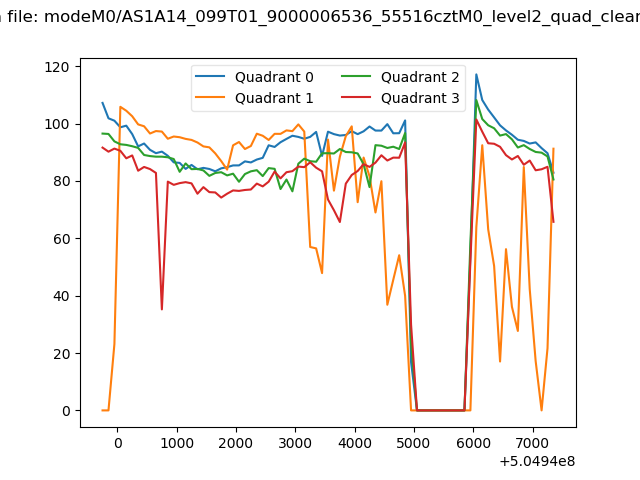 |
|
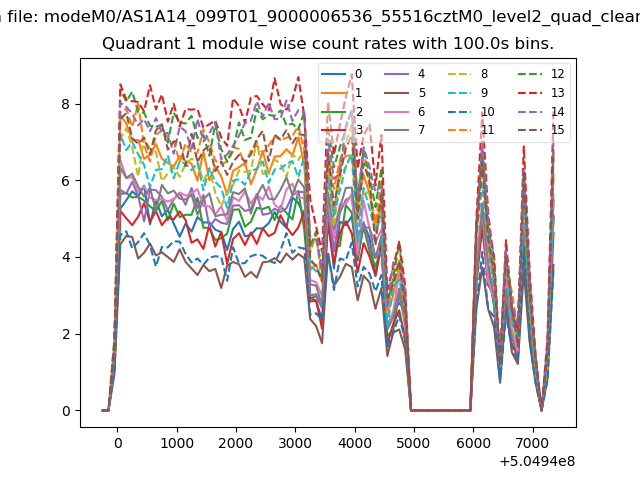
| Module-wise count rates for Quadrant A Data is divided into 100 sec bins |
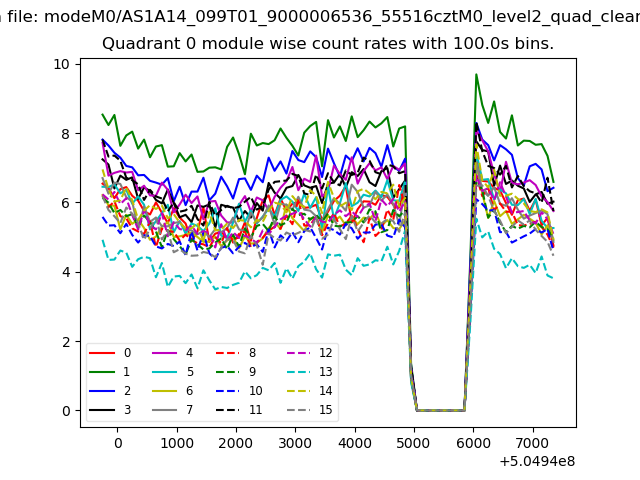 |
 |
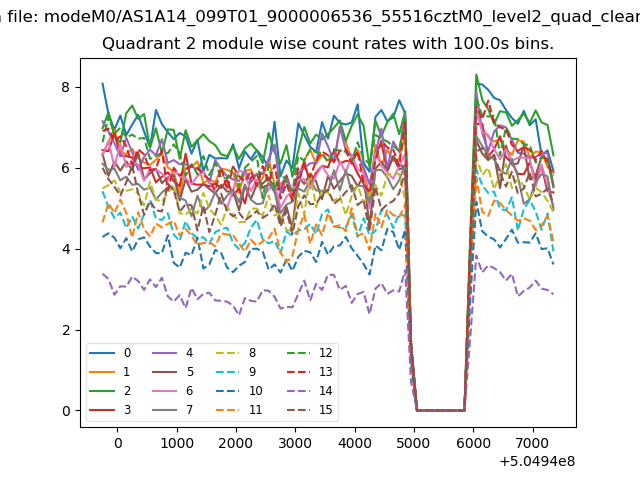
| Module-wise count rates for Quadrant B Data is divided into 100 sec bins |
 |
 |
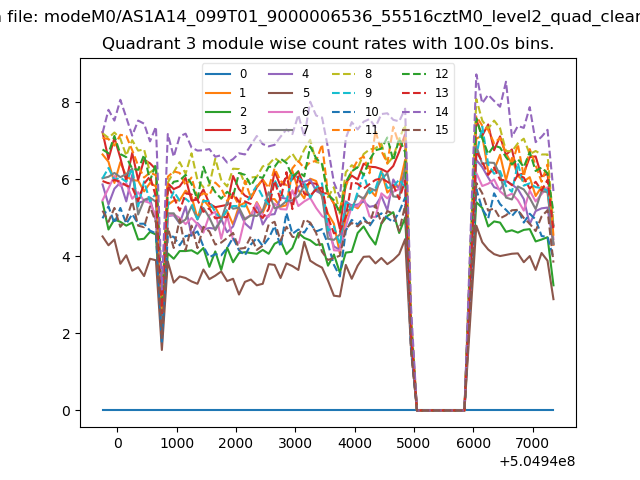
| Module-wise count rates for Quadrant C Data is divided into 100 sec bins |
 |
 |
| Module-wise count rates for Quadrant D Data is divided into 100 sec bins |
 |
 |
| Parameter | Plot |
|---|---|
| CZT HV Monitor | 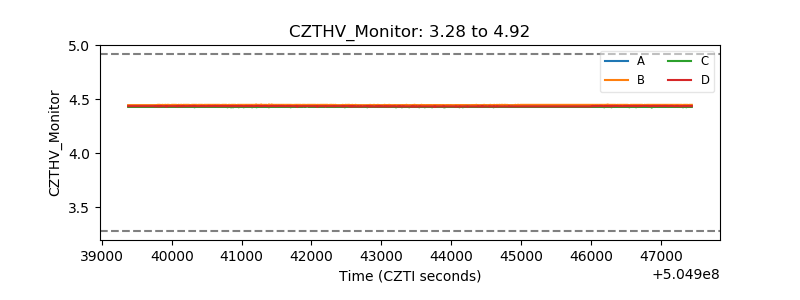 |
| D_VDD | 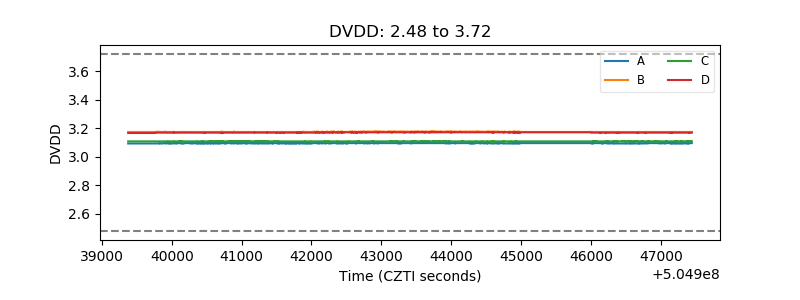 |
| Temperature 1 | 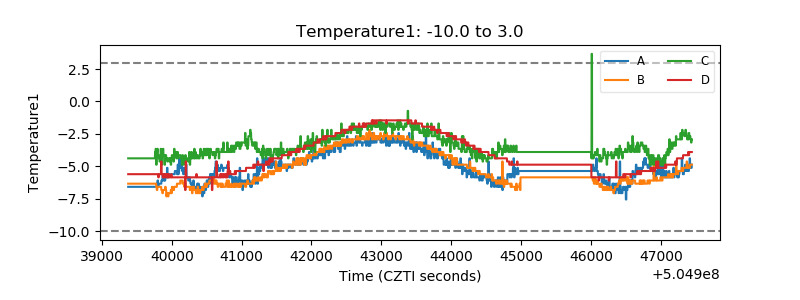 |
| Veto HV Monitor | 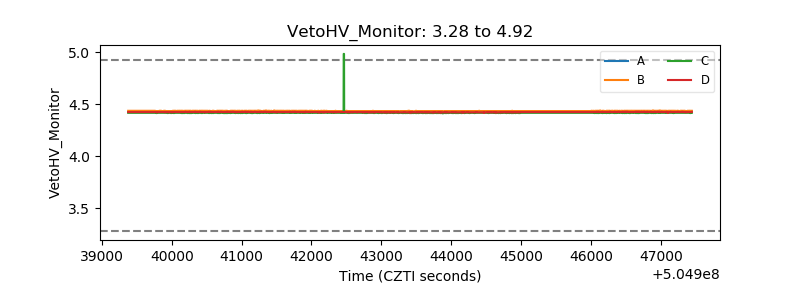 |
| Veto LLD | 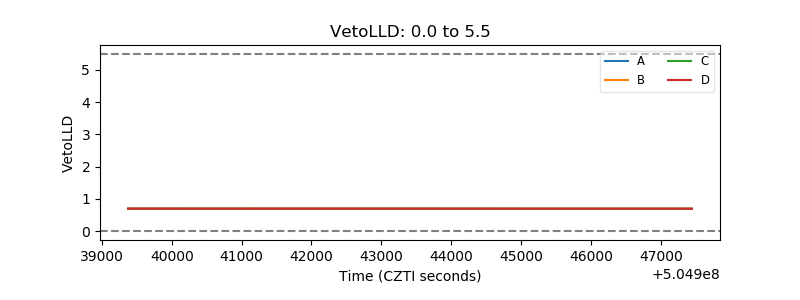 |
| Alpha Counter | 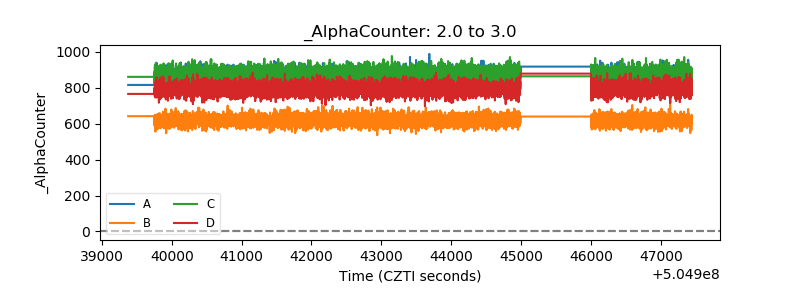 |
| _CPM_Rate | 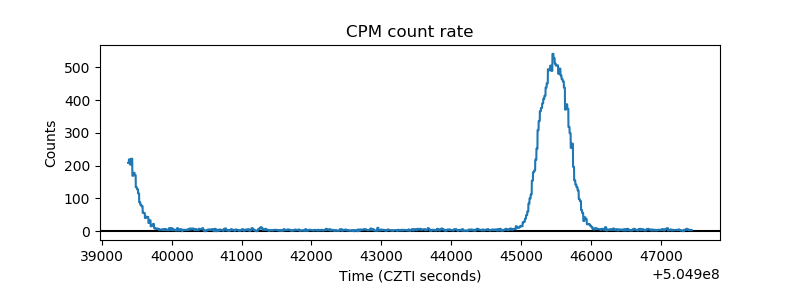 |
| CZT Counter | 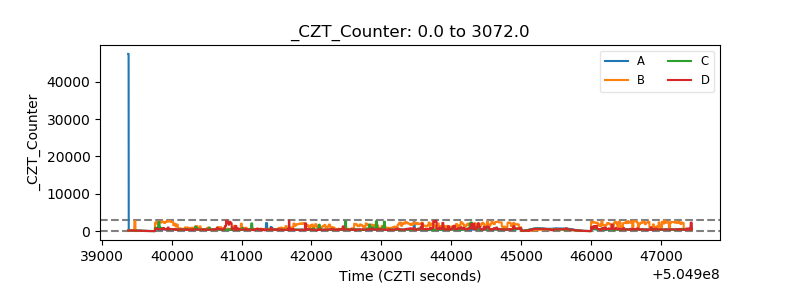 |
| +2.5 Volts monitor |  |
| +5 Volts monitor |  |
| _ROLL_ROT | 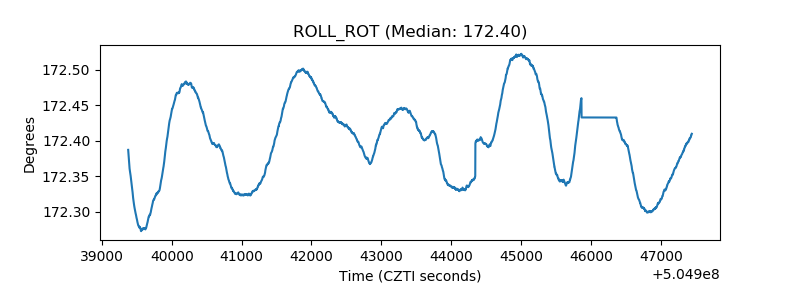 |
| _Roll_DEC | 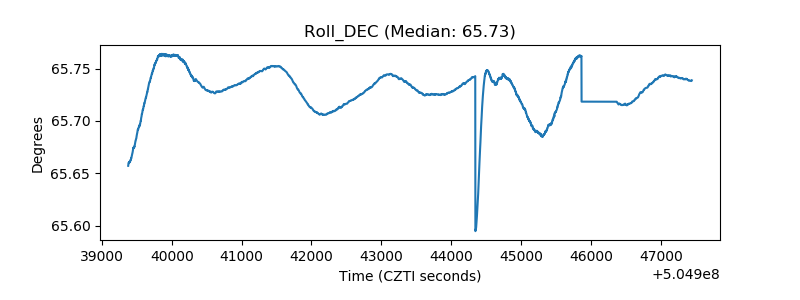 |
| _Roll_RA | 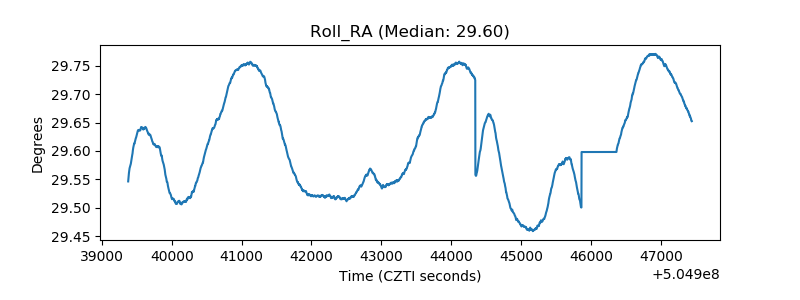 |
| Veto Counter | 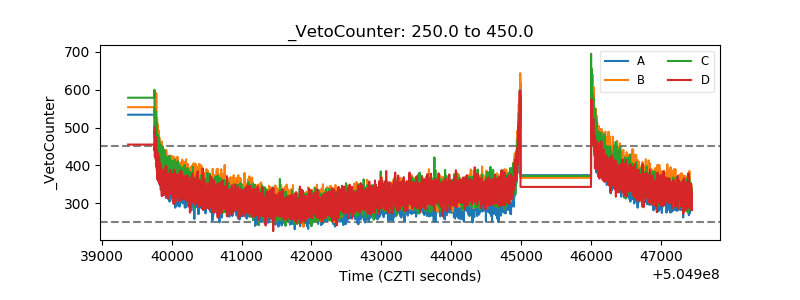 |